Effects of heat exposure and volumetric compression on
Poisson's ratios, Young's moduli and polymeric
composition during thermo-mechanical conversion of
auxetic open cell polyurethane foam
DUNCAN, Oliver <http://orcid.org/0000-0001-9503-1464>, CLEGG, Francis <http://orcid.org/0000-0002-9566-5739>, ESSA, Abdusalam, BELL, Anthony, FOSTER, Leon <http://orcid.org/0000-0002-1551-0316>, ALLEN, Tom and ALDERSON, Andrew <http://orcid.org/0000-0002-6281-2624>
Available from Sheffield Hallam University Research Archive (SHURA) at:
http://shura.shu.ac.uk/23226/
This document is the author deposited version. You are advised to consult the publisher's version if you wish to cite from it.
Published version
DUNCAN, Oliver, CLEGG, Francis, ESSA, Abdusalam, BELL, Anthony, FOSTER, Leon, ALLEN, Tom and ALDERSON, Andrew (2019). Effects of heat exposure and volumetric compression on Poisson's ratios, Young's moduli and polymeric
composition during thermo-mechanical conversion of auxetic open cell polyurethane foam. physica status solidi (b), 256 (1).
Copyright and re-use policy
See http://shura.shu.ac.uk/information.html
Sheffield Hallam University Research Archive
1 DOI: 10.1002/ ((please add manuscript number)) Article type: Full Paper
Effects of heat exposure and volumetric compression on Poisson's ratios, Young's moduli and polymeric composition during thermo-mechanical conversion of auxetic open cell polyurethane foam
Olly Duncan*, Francis Clegg, Abdusalam Essa, Anthony Bell, Leon Foster, Tom Allen, Andrew Alderson
O. Duncan, Dr. F. Clegg, A. Essa, Dr. A.M.T. Bell, Prof. A. Alderson
Materials and Engineering Research Institute, Sheffield Hallam University, Sheffield S1 1WB, UK
E-mail: [email protected] Dr. L. Foster
Centre for Sports Engineering Research, Sheffield Hallam University, Sheffield S1 1WB, UK Dr. T. Allen
Sports Engineering Research Team, Manchester Metropolitan University, Manchester M1 5GD, UK
Keywords: auxetic, foam, polyurethane, digital image correlation, shape memory
Abstract: The effects of thermo-mechanical auxetic foam conversion parameters on the
Young's modulus and Poisson's ratio of open-cell polyurethane foam are related to changes in
chemical bonding and cell structure. Applied volumetric compression, conversion temperature
and duration are reported on foam Young's modulus, Poisson's ratio and structural stability.
Fourier transform infrared spectral analysis on samples converted at and above 160°C
strongly indicates a hydrogen bond interaction increase in urea groups (C=O---H-N) and an
increase in hydrogen bonding population. Spectral changes inferred soft segment degradation
following extensive heat exposure (200°C, 180 minutes), specifically a shift and intensity
change in CH2 and C-O-C polyol bands and a broad baseline increase between 3600 and 2400
cm-1. These changes are linked to: i) resistance to dimensional recovery over time and during
re-heating, ii) Poisson's ratio becoming negative, then zero in tension or marginally positive in
compression, iii) Young's Modulus reducing then increasing, iv) mass loss, evidenced by
thermogravimetric analysis increasing from 150°C. The minimum mean values of Poisson's
2
retain their imposed compression over time are isotropic, with near constant Young's moduli
and Poisson's ratio (to 10 % compression/tension).
1. Introduction
Poisson's ratio is the negative of the ratio of transverse strain to axial strain.[1]
Thermo-mechanically converted auxetic foams were the first man-made auxetic (negative Poisson's
ratio, NPR) material.[1] The fabrication process first applies tri-axial compression to buckle
the ribs of thermoplastic open cell foam using a mold to apply a predetermined volumetric
compression ratio (VCR, initial volume/final volume). Isotropic (equal in all three axes)
compression is usually applied with VCR between two and five[2,3] although higher[4] and
lower[1,5] VCRs, and anisotropic compression[2,4,6–8] have been used. Buckled ribs are fixed in
position by heating (normally for 6 to 60 minutes but typically less than 30)[3] and cooling.[1]
Conversion parameters affect both the macro-cell structure [9,10] and the
nano/micro-polymeric[11] structure. Investigations have been undertaken to increase the magnitude of
NPR,[2,12] the strain range over which NPR remains constant,[13] structural and mechanical
homogeneity[2,5,14,15] and to tailor Young's modulus (referred to herein in the context of both
tension and compression).[16]
Instead of using a simple mold with a fixed volume, compression (during conversion)
has been applied; i) using a vacuum bag,[4] ii) in multiple stages with multiple or adjustable
molds[2,15] and iii) with rods passed through the bulk of the foam to apply more
uniform,[5,14,17–19] anisotropic or heterogeneous[5,17] compression. The aforementioned
compression methods were proposed, at least in part, to reduce variability when converting
large samples.[2,4,5,14,15,18,19] Alternative fixing methods have used a 'softening agent' (either
solvent or super critical CO2) instead of,[13,20] and in combination with,[13,21] thermal softening.
Conventional open cell foam typically has a polyhedral cell structure,[1,22] but is often
3
rise can cause clearly noticeable differences in Young's moduli and Poisson's ratio between
orientations.[9,22] Compressive and tensile modulus and Poisson's ratios are typically similar at
low (<5%) strain,[5,22,23] and depend on cell and polymeric structures. After cell ribs buckle at
~5% compressive strain,[1,22] many open cell foams require very little additional load to
compress them until densification at ~80% compression.[2,9] Beyond densification, pores close
and tangent modulus increases significantly.[9,22,23] Tensile stress vs. strain relationships of
open cell foams are typically quasi-linear (close to linear),[5,22] although non-linear
relationships are possible depending on the strain-dependent orientation of cell ribs.[22,24–28]
Auxetic foam cell structure has been described as comprising re-entrant cells,[1,2,12,22,29]
a series of connected rotating triangles,[30, 31] and a series of diamond cells with missing
connective ribs providing a kinked rib chiral structure.[32,33] Inward folding (in compression)
and outward straightening (in tension) of buckled ribs in a re-entrant structure can give
NPR.[22–24,30,34] In foams and most honeycombs, the exact mechanism is complex and involves
hinging around junctions between ribs, as well as rib flexure and stretching,[24,35] as shown
using in situ 3D X-ray microtomography and microstructurally faithful finite element
modelling.[36] If cell ribs are thicker or stiffer around joints then some rotation of rigid units
(joints) can occur.[30, 31] Rotation of joints is also realized in the missing rib model due to
straightening of the kinked ribs.[32,33] Missing ribs have only been identified on the surfaces of
auxetic samples and not within their bulk.[30] Additionally, the missing rib (auxetic) model has
lower density than the intact diamond (conventional) parent model. The increase in density of
auxetic foam over the conventional parent foam, imposed through the compression stage of
the thermo-mechanical conversion process, is not then accounted for in the missing rib model.
Unlike the missing rib model, both the re-entrant and connected triangles models predict the
observed increase in density for auxetic foam.
Applying isotropic compression in thermo-mechanical conversions buckles cell ribs in
4
proportion of ribs to a higher degree, which typically increases the magnitude of NPR.[2,29]
Over compression (typically to a VCR above five)[2,3] causes densification, preventing
transverse contraction and causing a positive compressive Poisson's ratio.[9] Volumetric
compression typically removes anisotropy (when applied tri-axially) by randomizing the cell
structure and produces quasi-linear compressive stress vs. strain relationships (since ribs are
already buckled).[22]
The Poisson's ratio of a three dimensionally isotropic, elastic material must fall
between -1 and 0.5.[1,37,38] So, isotropic material with a Poisson's ratio below -0.5 will exhibit
more transverse deformation than conventional isotropic material, and may have
correspondingly higher indentation resistance (proportional to the magnitude of Poisson's
ratio).[39,40] Foam with a Poisson's ratio below -0.5 could have higher resistance to penetration
under impact[28,40–42] and improve comfort of cushions,[43] which could be useful in sporting
(and other types of) protective equipment.[40]
Reported values of NPR in isotropic polymeric foams (including polyurethane (PU)
foams) are difficult to compare due to differences in the applied strain, strain rates and
measurement methods. NPR values ranging from 0 to as low as -0.7 have been
reported.[1,2,9,11–13,20,21,23,27,41,44–54] The heat applied during thermo-mechanical conversions
affects the uptake of imposed compression[9,10] and polymeric composition,[11] potentially
changing the relationship between rib flexure, stretching and hinging around junctions.[22,24,35]
Therefore, the physical mechanisms giving rise to the high magnitude NPRs (0.5 to
-1),[1,9,23,27,41,44,45] and the precise processing conditions to achieve them, remain unclear.
Auxetic foams are often shape memory polymers, returning substantially to their
original cellular structure and dimensions, accompanied by a return to positive Poisson's ratio,
when exposed to an external trigger such as sufficient heat or certain solvents (without the
constraint of a mold).[20,52,53,55] Auxetic foams with 'blocked shape memory' which partially
5
fabricated with multiple cycles of thermo-mechanical compression and thermal
re-expansion.[11] The hydrogen bonds which can fix an imposed re-entrant structure have a lower
glass transition temperature (Tg) than other bonds, which can produce shape memory upon
re-heating or by weakening with solvents.[20,52,53] Dimensional recovery over time can occur
following thermo-mechanically converted auxetic foam conversions.[2,11,50,52] Final density
ratio (FDR) has been used to describe the amount of regrowth following conversion,[11,50,52]
but since foam mass can also change due to degradation and/or solvent loss during heating,
final volume ratio (FVR, initial/final volume) will be used in this study.
Attempts have been made to create positive Poisson’s ratio foam that is more
comparable to auxetic foam than typical open cell foam to use in comparative tests, including
anisotropic, marginally NPR uniaxially compressed 'iso-density' (equal density) foams.[48,56]
Heating foam under isotropic compression for an extended period or at too high a temperature
produces re-entrant foam with a positive Poisson's ratio and increased Young's
modulus.[2,16,49] Suggested reasons why excessive heat produces a contorted, re-entrant
structure without an NPR include adhesion between cell ribs inhibiting transverse
deformation[2,27] and decomposition of the PU.[2] Spectral changes have been identified in one
previous study using Fourier transform infrared spectral analysis (FTIR) following PU
thermo-mechanical foam conversions.[11] Adhesion of cell ribs does not appear to have been
empirically confirmed in samples subject to excessive heat.[2,27] Residual stresses caused by
rapid cooling are considered possible and detrimental following conversions, with attempts
(annealing and hand stretching) made to remove them.[2,7]
The approach during typical thermo-mechanical conversions has been to adjust cell
shape while minimizing the likelihood of detrimental changes to polymeric structure, residual
stresses and adhesion between cell ribs.[2,7,29] The effects of applied compression,[1,2,16,29] oven
temperature,[2,12,16,29,49] heating time[2,12,41] and cooling method[50] on final density,[29,57] cell
thermo-6
mechanical conversion process has been developed to include mold lubrication, annealing and
hand stretching.[2,27] Annealing is normally in an oven (typically ~100°C), well below the
softening temperature.[2,7,17] Annealing is not always used and foam has been cooled in a mold
in air[10,12] and more quickly in running water or outside of a mold in air.[50] Hand stretching
between or after various heating stages has also been used to similar effect, supported by
mostly qualitative evidence, although some sample settling (reduced stiffness and a change in
Poisson's ratio) has been reported in the first cycles of compressive/tensile tests.[11,58]
Thermoplastic PU consists of hard (ordered) and soft (amorphous) segments.[59]
Copolymers and cross-linkers can affect PU characteristics.[12,13,59,60] Softening temperature
(or point) has been used to describe a temperature range whereby auxetic foam can be formed
following heating then cooling under compression. Thermocouples inserted into the foam
have been used to accurately monitor heating and cooling.[2,51] Other studies have quoted oven
temperatures and conversion times instead.[1,5,11,12] Thermal softening and/or heating above
any polymer or copolymer transition temperature can cause decreases in hydrogen bond
strength[12] and increased polymer chain mobility. Increased mobility allows permanent [11] or
temporary[10,20,53] re-organization of polymer chains and cell structure when subject to
volumetric compression and subsequent cooling. Degradation in polymer chains typically
occurs first in hard segments, then in soft segments.[61,62]
This work aims to: i) elaborate on the effect of heating time and temperature on
dimensional recovery, Young's modulus, Poisson's ratio and polymeric bonding mechanisms,
ii) investigate possible correlations between changes in dimensional recovery, Poisson's ratio,
Young's modulus, mass loss and polymeric bonding, iii) identify the presence or otherwise of
adhesion between cell ribs, missing cell ribs or any differences in polymeric bonding present
in maximum magnitude NPR and re-entrant structures with positive Poisson's ratio following
increased heat exposure and iv) test whether changes between phases (auxetic/non auxetic,
7 2. Methods
2.1. Foam Conversions
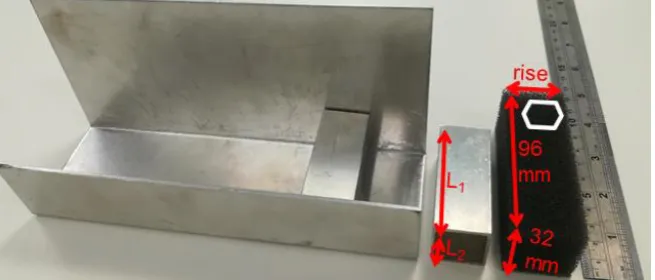
PUR30FR foam cuboids (Custom-foams, supplied cut to 32 x 32 x 96 mm, cell rise
aligned as received by the supplier, Figure 1) were thermo-mechanically converted with
isotropic compression in aluminum box section molds (2 mm wall thickness) with a VCR of
three. Samples were heat treated in a conventional oven (MCP Tooling Technologies LC/CD)
between 120 and 200°C (10°C increments) for either 20, 60 or 180 minutes. Six samples were
fabricated for each time and temperature combination and cooled to close to room
temperature in their molds (30 to 60 minutes). Cell rise direction, identified visually, was
perpendicular to the longest dimension for each sample (Figures 1 & 2a). From each set of six
samples, three were tested for dimensional stability and the remaining three samples were
tested for Poisson's ratio, Young's modulus and polymeric bonding using FTIR. Brief and
gentle hand stretching of samples that were tested for dimensional stability was applied after
removal from the mold. Samples fabricated at 140 and 160 °C for 180 minutes were also
mechanically characterized following heating to test their dimensional stability. Following
completion of the initial (VCR = 3) study, additional samples were fabricated (VCR = 2) at
combinations of heat and time that gave consistent negative and positive Poisson's ratios for
[image:8.595.74.402.583.723.2]samples with a VCR of three (140°C and 200°C for 60 minutes respectively).
8 2.2. Dimensional stability testing
Dimensional stability was tested a week after fabrication, by measuring sample
dimensions (Vernier calipers) both before and one hour after heating in an oven set to 200°C
(for 10 minutes) outside of their mold.[10,20,52] All samples were tested in the same
air-conditioned environments and stored in spacious, sealed containers with no compression
between fabrication and testing. Relative humidity was not measured during storage.
The 4 phases typically employed in the shape memory polymer cycle are: (i)
Deformation (at elevated stress and temperature); (ii) Cooling/fixing (at elevated stress); (iii)
Unloading (removal of stress at the lower temperature); and (iv) Recovery (re-heating to
elevated temperature under zero stress).[63] By analogy, the corresponding foam conversion
process and dimensional stability testing phases reported here are (i) Heating in a compression
mold (Deformation); (ii) Cooling in a compression mold (Cooling/fixing); (iii) Removal from
compression mold followed by brief hand stretching and leaving for 1 week (Unloading); and
(iv) Unconstrained (out-of-mold) re-heating (Recovery).
The SMP literature[63] defines the following measures of shape fixing, Rf (%), and
recovery, Rr (%):
𝑅𝑓(%) = 𝜀𝑢
𝜀𝑚× 100 (1)
𝑅𝑟(%) = (𝜀(𝜀𝑚−𝜀𝑝𝑢−𝜀𝑝))× 100 (2)
where m, u and p are the strains after the Deformation, Unloading and heat-induced
Recovery phases. In this work we use volumetric strain, and so the strain after the
Deformation phase is that imposed by the compression mold:
𝜀𝑚 = 𝑉−𝑉𝑉 0 0 =
𝑉
𝑉0− 1 = 1
9
where V and V0 are the imposed volume and initial volume, respectively. Similarly, u and p
are determined by using the volume measured after 1 week and unconstrained heating,
respectively, in place of the imposed volume in (3).
2.3. Mechanical Characterization
Mechanical testing was started one week after fabrication, and took four weeks.
Similar protocols to previous tests of the same and different PU foam were employed.[5,49]
After attaching 3 mm thick acrylic end tabs using epoxy resin, cyclic testing between 0 and
10% tensile strain (strain rate 0.0033 s-1,[5,49] sample frequency 25 Hz, 5 cycles, Instron 3367,
500 N load cell) allowed controlled sample settling,[11] and analysis of the final cycle. Cubes
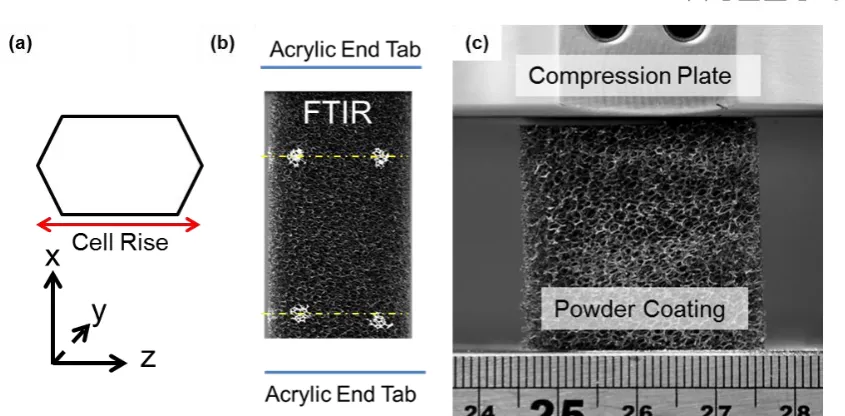
laser cut (Trotec 10000) from the center of tensile samples (after tensile testing, Figure 2b)
were compression tested (strain rate 0.0067 s-1)[5,49] to 10% strain, in all three orthogonal
planes. Samples were tested over four weeks in the following order, with a week between
tests to allow recovery:
Week 1) Tensile tests measuring Ex and νxz Week 2) Tensile tests measuring Ex and νxy
Week 3) Compression tests measuring Ez and νzx then Ex and νxz Week 4) Compression tests measuring Ex and νxy
Digital Image Correlation (DIC) was used to obtain axial and transverse strains[18,47,64]
and compared to marker tracking[5,14,57] in tension and Instron device displacement in both
tension and compression.[18] The top and bottom of the square target area in the center of each
sample were marked with ~2 mm diameter pins or liquid paper (Figure 2b) (target area sides ~
equal to sample width). Pins were used for samples fabricated at 120, 140, 160, 180 & 200°C
and liquid paper for samples fabricated at 130, 150, 170 & 190°C. Powder coating (Figure 2c,
Laponite RD, BYKAdditives) enhanced the speckle pattern provided by pores in compression.
No speckle pattern was used in tension, with sufficient contrast provided by the porous foam
10
Figure 2:a) Sample/cellular orientation, b) Tensile test setup, showing laser cut (yellow) region, with foam outside this area used for FTIR analysis, c) Compression test setup with powder coating
Tests were filmed (Cannon G16, 28 mm lens or Nikon D810, 28-300 mm lens, both
set to 1920x1080p at 25fps), with DIC analysis carried out using commercial software (GOM
Correlate, 2016). Cameras were focused prior to each test, and facet sizes were between 25
and 35 pixels (0.04 to 0.06 mm.pixel-1, depending on sample size and camera zoom checked
in the center and edge of images from each camera showing negligible distortion), standard
accuracy and matching against definition stage were typically selected. Linear trend lines
fitted to plots of transverse strain (t) vs. axial strain (a) (mean value across all facets within
target area, over the entire 10% strain range) were used to obtain Poisson's ratio, determined
from the negative of the gradient of the linear trend line (i.e. at = -t/a). Stresses were
calculated from cross sectional areas (measured with Vernier Calipers prior to each test) and
force data from the Intron's built in software (Bluehill 4.0). Tensile and compressive modulus
were calculated from the gradients of linear trend lines fitted (between 0 and 10% axial strain,
from DIC) to axial stress (a) vs. axial strain (i.e. Ea = a/a).
2.4. Polymeric Composition & Cell Structure
Sections cut from tensile samples (Figure 2b) of unconverted foam, and foam
11
minutes were analyzed in detail. X-ray diffraction data were collected using a PANalytical
X'Pert Pro diffractometer with Cu Kα X-rays, = 1.54050 Å over the range 10-70º 2θ. FTIR
were collected on a Nexus FTIR spectrometer over the wavenumber range of 4000 to 600 cm
-1
, with a resolution of 8 cm-1 and taking a mean over 64 scans. The baseline value was taken
between 3800 and 4000 cm-1. The higher wavenumber region (2400 to 3700 cm-1) of
absorbance spectra were normalized to the non-changing CH2 band (2872 cm-1). The low
wavenumber region (1000 to 1900 cm-1) of absorbance spectra were normalized to the
non-hydrogen bonded (free) Amide I band of urethane (1727 cm-1), which did not change
significantly. The aforementioned spectra were collected using an ATR accessory utilizing a
diamond crystal, spectra were also collected using a germanium crystal to assess the presence
of SAN particles (1700 and 2600 cm-1),[12] which were found to be absent.
Three heating/cooling cycles during Differential Scanning Calorimetry (DSC, Perkin
Elmer DSC 8000, -75 to 120°C, heating and cooling rate 10°Cmin-1) were used to assess Tg
following applied heat. Thermogravimetric analysis (TGA, Mettler Toledo TGAIOSC, Stare
System, 20 to 300°C, 10°Cmin-1) indicated degradation within (and above) the temperature
ranges used for conversion (25 to 300°C). Micro CT scans (SkyScan1172) of 7 mm diameter,
10 mm long cylinders of unconverted foam and foam converted with VCR of three (190°C,
60 minutes & 200°C, 180 minutes) were collected. Qualitative inspection of a 3 x 3 x 0.5 to 1
mm region (corresponding to 1 pore in depth) compared cell structures through the bulk of the
foam. Resolution at the analysis stage was 5 µm/pixel, and a transfer function adapted from
bone segment analyses was applied.
3. Results
All samples processed at T ≤ 150°C with a VCR of three underwent some dimensional
recovery (FVR < 3) over time, irrespective of heating time (Figure 3a). Increasing
temperature and time in all conversions decreased the level of re-expansion after a week in
12
dimensionally stable (FVR = 3) over this timescale, irrespective of heating time. Samples
converted at low temperatures and short time (T ≤ 140°C for 20 minutes, Figure 3a & b) had
already returned completely to their original dimensions (FVR = 1) after one week.
Unconstrained re-heating to 200°C for 10 minutes accelerated (promoted) dimensional
recovery in samples that had undergone partial re-expansion, and some samples that appeared
stable, after one week in ambient conditions (150 ≤ T ≤ 190°C for 20 minutes, 120 ≤ T ≤
170°C for 60 minutes, 120 ≤ T ≤ 150°C for 180 minutes, Figure 3b). The accelerated
complete or partial re-expansion following re-heating corresponds to shape memory
behavior.[11] The remaining samples (T = 200°C for 20 minutes, T ≥ 180°C for 60 minutes, T
≥ 160°C for 180 minutes) exhibited negligible re-expansion, i.e. remained stable, after
unconstrained re-heating (Figure 3b). The data point at T = 200°C for 180 minutes with an
FVR marginally above 3 after unconstrained re-heating agrees within the error (±5%)
associated with the volume measurement with VCR = 3.
The Rr (%) measure of heat-induced recovery was found to be linearly proportional to
the shape fixing measure Rf (%) until Rf (%) approached 100% whereupon Rr (%) showed
extremely large variation (Figure 3c). The data for foams produced at 20, 60 and 180 minutes
heating time during conversion were found to overlap the same linear trend in the Rr (%) vs.
Rf (%) plot.
Samples converted with a VCR of two exhibited similar relative re-expansion to those
fabricated with VCR of three (T = 140°C for 60 minutes partially re-expanded, and T = 200°C
13
Figure 3:a & b) Measured final volume ratio (initial/final volume) after a) 1 week, b) Re-heating to 200°C for 10 minutes, same vertical axis as a), c) Recovery (Rr (%)) vs. shape
fixing (Rf (%)) measure for all VCR = 3 foam samples produced at 20, 60 and 180 minutes
conversion heating times. Legend displayed below figures
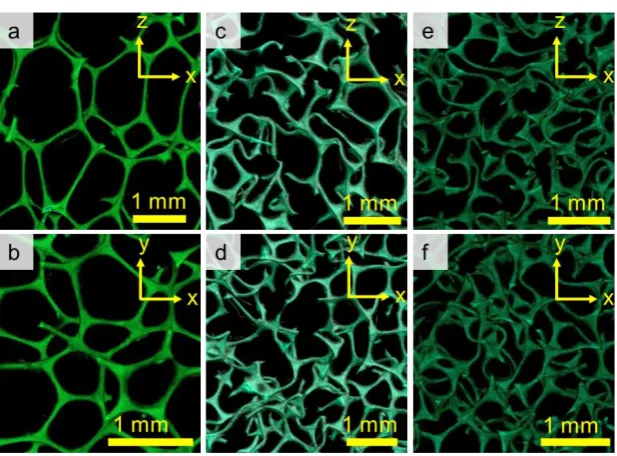
Unconverted, open cell foam showed its classic honeycomb-like, fully reticulated, cell
structure (Figure 4a & b) and elongated cell rise (Figure 4a).[22] Adhesion between ribs could
not be identified in the bulk scans of converted samples (Figure 4c to f), neither could any
qualitative evidence for the persistence of the original cell rise direction (agreeing with
previous work).[1,23] All apparent missing ribs (Figure 4c to f) were checked by adjusting the
depth of the target volume and are actually intact but simply passing through its perimeters.
[image:14.595.77.386.483.711.2]14
Unconverted foam had a positive Poisson's ratio with little local variation to transverse
strain across each sample (Figure 5a). Samples with maximum magnitude NPR also had a
near-constant NPR with some fluctuation in local strain suggesting some inhomogeneity in
the cell structure (Figure 5b). Samples heated at the higher temperatures and longer times
showed similar local strain fluctuation but spanning positive and negative values (Figure 5c).
Compressive and tensile transverse strain vs. axial strain relationships were quasi-linear for all
[image:15.595.75.543.268.393.2]samples over the tested region (0 to 10% strain, Figure 6).
Figure 5: Contour plot showing local transverse strain for a) Unconverted PUR30FR, b)
Foam with VCR = 3, heated for 180 minutes at 140°C & c) Foam with VCR = 3, heated for 180 minutes at 200°C. Axial loading was parallel to x axis, transverse strain parallel to z axis, as per schematic in a and shown on scale on right-hand side of figure c
Figure 6: Transverse vs. Axial (true, mean across all facets from DIC analysis) strain in a)
Compression, b) Tension (loading parallel to x axis, transverse deformation parallel to z axis)
Mean anisotropic Poisson's ratios of unconverted samples (~0.5 in tension and for
[image:15.595.76.423.503.675.2]15
direction) agreed with previous tests of the same foam and are similar to the foams with an
FVR of 1 (Figure 7).[5] For foams produced with a heating time of 20 minutes, Poisson's ratio
was positive, approximately constant and anisotropic (with noticeable differences between
orientations) for T ≤ 140°C, then decreased notably in magnitude and anisotropy as
temperature increased above 140°C, undergoing a transition to NPR when T = 150°C, and a
minimum value at T = 160°C. Further increases in conversion temperature did not change
isotropy but gradually (over the next ~30°C of heating) increased Poisson's ratio to marginally
positive values in compression (Figure 7a) and marginally negative values in tension (Figure
7b). Increasing heating time to 60 and 180 minutes gave the same general Poisson's ratio vs.
conversion temperature trend but systematically moved to lower conversion temperatures (i.e.
to the left in Figure 7). The maximum magnitude of NPR was the same for all heating times
(NPR ~ -0.2), comparable to other studies thermo-mechanically fabricating and testing
isotropic auxetic foam samples over a similar strain range.[11,21,48]
The foams with an applied VCR of two displayed tensile Poisson's ratios ~-0.2 and ~0
for 140°C and 200°C, 60 minute conversions, respectively, and near-zero Poisson's ratios for
these conditions in compression (Figure 7c). Samples fabricated at 140°C for 180 minutes
with a VCR of 3 retained tensile and compressive NPR following reheating at 200°C for 10
minutes without a mold (Figure 7c). An increase in NPR magnitude was found for the
16
Figure 7: Poisson's ratio (0 to 10 % strain) in a) Compression (samples with VCR = 3), b)
Tension (samples with VCR = 3), c) Additional VCR = 2, re-heated (rh) and unconverted (UC) samples (C = compressive, T = Tensile in legend). Lines (solid, dash & dash/dot for 20, 60 & 180 minute conversions respectively) connect mean over all orientations tested to guide the eye in a) & b), error bars = 1 s.d.
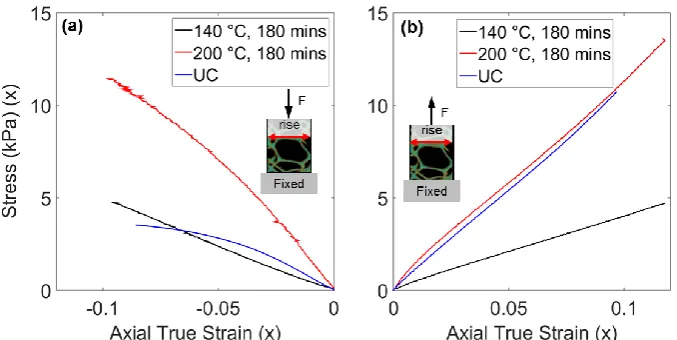
The unconverted foam compressive stress vs. strain relationship was nonlinear, with a
characteristic plateau region beginning between 4 and 6% compression (Figure 8a) as
previously reported.[5,22,23] Samples with maximum magnitude NPR exhibited a quasi-linear
compressive stress vs. strain relationship (140°C, 180 minutes, Figure 8a). All stress vs. strain
relationships were relatively linear in tension (Figure 8b). The marginally positive Poisson's
ratio sample converted at the higher temperature and time (200°C, 180 minutes) was quasi
linear in compression (Figure 8a) and required a higher load to reach an equivalent tensile or
compressive strain than the maximum magnitude NPR foam (Figures 8a & b).
The Young's moduli of unconverted samples in tension (Ex = 102 kPa) and
compression (Ez = 127 kPa, Ex = 60 kPa, compared with measurements taken up to 5% strain
for the non-linear unconverted foam, Ez = 115 ± 5 kPa, Ex = 74 ± 11 kPa) agreed with
previous tests of the same foam (Figure 9).[5] Young's modulus initially decreased with
conversion temperature to minimum values of ~30 kPa in tension and ~25 kPa in compression
(Figure 9a) at the same conditions giving minimum Poisson's ratio (Figure 7). Further
increasing conversion temperature increased compressive and tensile Young's modulus
(Figure 9). Increasing heating time moved the Young's moduli vs. conversion temperature
data to lower temperatures, similar to the Poisson's ratio trends. Samples fabricated with a
VCR of two, and those tested for thermal stability, have comparable tensile and compressive
Young's modulus (Figure 9c) to samples fabricated with a VCR of three heated for the same
17
[image:18.595.74.510.270.439.2]Figure 8: Stress vs. Axial True Strain in a) Compression, b) Tension (loading parallel to x axis)
Figure 9: Young's Modulus (0 to 10 % strain) in a) Compression (samples with VCR = 3), b)
Tension (samples with VCR=3), c) Additional VCR = 2, reheated (rh) and unconverted (UC) samples (C = compressive, T = Tensile in legend). Lines (solid, dash & dash/dot for 20, 60 & 180 minute conversions respectively) connect mean over all orientations tested to guide the eye in a) & b), error bars = 1 s.d.
Analysis of the XRD data only showed two very broad peaks positioned at 20 and 45°
2θ, characteristic of semi-crystalline polymers with both hard and soft segments (Figure
10a)[12]. FTIR spectra in the region 2400 to 3700 cm-1 (Figure 10b) normalized to the
symmetric CH2 band at 2872 cm-1 showed a small reduction in intensity of the CH2 stretch
band at 2912 cm-1 for all converted samples, but no significant differences between these until
heating increased to 200°C for 180 minutes.[60] The position of the N-H stretch band
associated with the unconverted foam (3305 cm-1)[12,60,65] indicates this band is involved in
hydrogen bonding network (free N-H bonds undergoing no hydrogen bonding are typically
18
towards lower wavenumbers (3302 cm-1) and dramatically increased in intensity, indicating
an environment where there is an increase in N-H groups undergoing stronger hydrogen
bonding and an increase in their relative population. The full width at half maximum
remained (mostly) constant except in the samples heated at 200°C for 180 minutes. A broad
underlying increase in intensity was observed between 3600 and 2400 cm-1 for the sample
heated at 200°C for 180 minutes. FTIR spectra in the region 1000 to 1900 cm-1 (Figure 10c)
normalized to the relatively unchanging Amide I band associated with free urethane (1727
cm-1)[12,60] showed the Amide I band of hydrogen bonded urea groups (predominantly C=O
stretching groups, ~1640 cm-1)[12,60] increased dramatically in magnitude when heated to
160°C and above.[65] Minor intensity decreases and broadening of the Amide II band
(predominantly C-N stretch & N-H bend, at 1531 cm-1)[61,66] progressively occurred when
heated at 200°C for prolonged periods of time, whilst a large intensity increase and shift to a
lower wavenumber for the asymmetric C-O-C stretch of polyol's (1077 cm-1)[61] was also
[image:19.595.74.539.464.640.2]evident after 180 minutes at 200°C.
Figure 10: a) XRD of PUR30FR; FTIR at b)High wavenumber (enlarged pop-out showing CH2 peak) & c) Low wavenumber on foam samples following conversion under the heating
conditions defined in b, UC = unconverted.
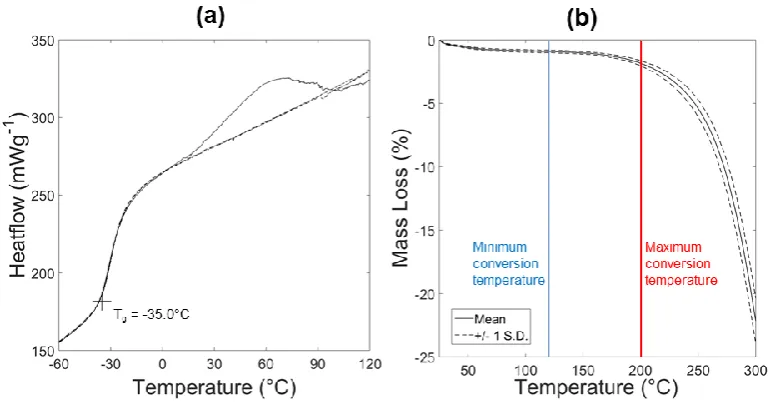
DSC (Figure 11a) shows Tg was consistent between cycles. The first cycle shows a
broad, variable transition between ~20 and ~90°C, which was not present in subsequent
19
between 25-90°C but was negligible between 100 and 150°C (Figure 11b) and then increased
marginally between 150 and 200°C (typical in thermo-plastics).[67] Significant mass-loss was
evident above 200°C (Figure 11b).
Figure 11: a) DSC (cycles between -75 and 120°C, showing heating following stabilization only) and b) TGA of 10-12mg PUR30FR samples
4. Discussion
The effects of conversion time and temperature on Young's modulus and Poisson's
ratio in thermo-mechanical conversions broadly agree with previous findings.[23,41,49] Samples
converted under conditions which underwent full dimensional recovery (FVR = 1) after one
week (T ≤ 140°C for 20 minutes) had similar positive Poisson's ratios (Figure 7), tensile
modulus (Figure 9) and reasonably similar compressive modulus (Figure 9) to the
unconverted foam. Compressive Poisson's ratio (Figure 7a) and Young's modulus (Figure 9a)
of anisotropic unconverted samples and samples converted with insufficient heat exposure to
randomize the cell structure and create isotropy were marginally higher in magnitude when
loading was parallel to cell rise (z axis). This agrees with previous results on tensile properties
for anisotropic foams.[7] Consequently, the tensile Poisson's ratio (Figure 7b) and Young's
modulus (Figure 9b) of the same samples would be expected to be higher in magnitude if
[image:20.595.73.463.152.354.2]20
Any data for VCR=3 samples with FVR < 3 in Figure 3a corresponds to materials
which displayed some dimensional recovery after the Unloading (removal from mold, brief
hand stretching and 1-week rest period) phase. Interestingly, the foams converted at 120°C
and 130°C for 180 mins showed substantial dimensional recovery (1.5 < FVR < 2, Figure 3a)
but retained high magnitude NPR (-0.2 < < -0.1, Figure 7a and 7b) after the Unloading
phase. These FVR and NPR values, achieved over time following a single
compression-heating process, without any Recovery phase, are very similar to the FDR (final density ratio)
and NPR values reported in 'blocked shape memory' foams.[11] The latter foams were
produced using a multi-stage repeated cycle process of auxetic conversion
(compression-heating) and reconversion (unconstrained (compression-heating).[11] The mass loss data in Figure 11b
indicate the FDR and FVR measures of re-expansion are likely to be similar (i.e. only
marginal, ~1%, difference) at these temperatures.
Some foams exhibited shape memory in the (unconstrained re-heating) Recovery
phase (150 ≤ T ≤ 190°C for 20 minutes, 120 ≤ T ≤ 170°C for 60 minutes, 120 ≤ T ≤ 140°C for
180 minutes, Figure 3b). The foams converted at 140°C for 180 minutes show 'blocked shape
memory' as described previously,[11] corresponding to nominal dimensional recovery (Figure
3b) but retention of NPR (Figure 7c) following re-heating. The FVR of 1.8 and NPR of ~-0.2
of the blocked shape memory foams produced here in a single shape memory cycle are again
very similar to the FDR (~1.5) and NPR (~-0.2) values reported in the blocked shape memory
foams previously produced using three to five cycles of thermo-mechanical conversion and
reconversion by unconstrained heating.[11]
The foams converted at 160°C for 180 minutes actually increase their magnitude of
NPR, particularly in compression (Figure 7), with a very small amount of re-expansion/shape
memory (FVR = 2.8) following unconstrained re-heating. Therefore unconstrained re-heating
can be employed to achieve either blocked shape memory in a single cycle (retaining NPR
21
dimensional stability. Repeated cycles of thermo-mechanical conversion and reconversion by
unconstrained heating, as reported by Boba et al.[11] is beyond the scope of the work in this
paper. However, we note the same basic thermo-mechanical conversion process and similar
open-cell PU foams are investigated in both studies. The possibility exists, therefore, of
blocked shape memory occurring after several conversion cycles for the process and foams
reported in this work.
At high conversion temperatures and/or longer times (T = 200°C for 20 minutes, T ≥
180°C for 60 minutes, T ≥ 160°C for 180 minutes) the samples exhibited dimensional
stability to unconstrained re-heating (Figure 3b), and possessed near-zero positive and
negative Poisson's ratios in compression and tension, respectively (Figure 7a & b). Young's
moduli increased with further heat exposure (Figure 9) but the stress vs. strain relationship
remained quasi-linear in compression (Figure 8a), typical of re-entrant structures (Figure 4d &
e).[1,22] The near-zero Poisson's ratios and increased Young's moduli agree with previous work
at high conversion temperatures and heating times.[2,16,49]
The wide variation in the heat-induced recovery measure Rr (%) data when Rf (%) ~
100% arises since m = u = p when shape fixing is total and retained even after
unconstrained re-heating (Figure 3c). In such a case, both the numerator and denominator
assume zero values in Equation (2) and Rr (%) is indeterminate, corresponding to recovery not
being possible in this case. In practice, this means that Rr (%) is the ratio of two small
numbers when Rf (%) ~ 100%, leading to large variations in Rr (%). The increasing Rr (%) vs.
Rf (%) behavior is consistent with the increased shape fixing after the Unloading phase, the
more scope there is for heat-induced dimensional recovery in the Recovery phase. The
overlapping of the data at conversion heating times of 20, 60 and 180 minutes implies the
bonding responsible for fixing and recovery is the same for any given Rf (%) value,
irrespective of the conversion time and temperature combination used to achieve this. If
22
samples would have expanded by a greater amount; decreasing u. Rf would therefore
decrease (Equation (1)), and the observed Rr (%) vs. Rf (%) response (Figure 3c) suggests Rr,
the measure of heat-induced recovery, would then also decrease. The choice of leaving a
period of 1 week following removal of the converted foam from the compression mold before
unconstrained re-heating was arbitrary. A further study into the length of this Unloading
phase now seems merited in light of the above results and discussion.
The applied VCR affected neither time nor heat dependent stability (Figure 3), and
only produced small changes in Poisson's ratio and Young's modulus. The compressive
Poisson's ratio of samples fabricated with a VCR of two was close to zero or marginally
negative in compression (Figure 7c), in agreement with previous work using the same
foam.[18,29,57] Samples fabricated with a VCR of three that partially sprung back after a week
to an FVR close to two (130°C, 180 minutes, 140°C, 60 minutes, 160°C, 20minutes, Figure
3a) exhibited compressive and tensile NPR (~-0.2, Figure 7) but the same compressive and
tensile Young's moduli and FVR as samples fabricated with a VCR of two (140°C for 60
minutes, ~40 kPa, Figure 9c). Extensive heat exposure caused large increases in both
Poisson's ratio (Figure 7) and Young's modulus (Figure 9) whether applied VCR was two or
three. Increasing heat-exposure, therefore, provides a route to produce additional
combinations of characteristics.
The Poisson's ratios span positive and negative values (~-0.2 to 0.5, Figure 7). Select
positive and negative Poisson's ratio re-entrant samples (i.e. VCR 3, 140 or 200°C, 180
minutes) were iso-density (Figure 3a), isotropic (Figures 7 & 9) and had quasi-linear stress vs.
strain (Figure 9) and transverse vs. axial strain (Figure 6) up to 10% tension or compression.
'Heat-set', iso-density re-entrant samples with a quasi-linear compressive stress vs. strain
relationship (Figure 8) and positive Poisson's ratio (Figures 6 & 7) could facilitate
normalization to compressive modulus during indentation tests. Samples tensile tested with
23
(Figures 7 & 9). Inserting pins for mechanical testing either had negligible effect due to
sample damage, or the effect was no greater than scatter due to imperfect liquid paper
markers.[17]
Glass transition temperature did not change following heat cycles up to 120°C
(Figures 11a), but samples went through a broad exothermic transition on their first cycle
(only). The broad transition occurred at a lower temperature (between ~30 and 90°C) than
increased hydrogen bonding was identified by FTIR (>160°C, Figures 10b & c), and the
exothermic event did not fix samples' VCR after a week (Figure 3a). The transition could be
related to a reorganization of polymer chains after evaporation of water (as evidenced by mass
loss in TGA between 35-90°C), through a crystallization-like process though there is as yet no
other evidence to support this (i.e. by XRD) nor any evidence of an endothermic evaporation
process by DSC. A similar change has been shown between cycles of DSC,[53] simply
attributed to thermal history. Mass loss evident in TGA suggested degradation was present but
not below 150°C (Figure 11b). As samples adopt their VCR (> 150°C, 20 minutes, Figure 3a),
FTIR identifies increases in the strength and population of hydrogen bonding (Figures 10b &
c) and sample Poisson's ratio reduces towards zero/negative values (Figures 5a & b).
FTIR shows the hydrogen bonding nature changes most as heat exposure increases
above 160°C for 20 minutes (Figures 10b & c). Changes were only evident under FTIR as
samples adapt NPR (Figure 7) and their VCR (Figure 3a). With increasing heat exposure, the
N-H stretch band (3200 to 3300 cm-1 Figure 10b) shifted to lower wavenumbers and increased
in intensity, while the intensity of the band due hydrogen bonded C=O urea groups also
increased (Figure 10c, ~1640 cm-1).[68] The unchanging band at 1727 associated with free
urethane groups[12,60] strongly indicates that hydrogen bonding changes are associated with
urea rather than urethane groups. Hydrogen bonded N-H has previously been suggested to fix
PU foam's imposed re-entrant structure following similar amounts of heating and
24
conversions show different unconverted and converted spectra to the PU used in this study.[11]
Figure 10 provides evidence of a continually increasing hydrogen bond interaction between
N-H and C=O of urea within the hard segments. An interaction between the soft segment
C-O-C polyol and N-H of either urea or urethane is possible, but changes to the C-C-O-C stretch
band (~1077 cm-1) were only present following conversion at 200°C for 180 minutes and are
probably caused by degradation. The minor decreases in the Amide II (1531 cm-1) and CH2
stretch bands (2912 cm-1), the broad underlying intensity increase observed between 3600 to
2400 cm-1 (Figure 10b and c) in the same sample and significant mass loss at and above
~200°C during TGA (Figure 11b) support polymer degradation.[11,12]
The changing hydrogen bonds provided sufficient fixing to completely block
dimensional recovery in one thermo-mechanical heating cycle (Figure 3 a & b), but also
changed the deformation mechanism so Poisson's ratio was only negative in tension (Figure
7). Young's modulus (as well as NPR, Figure 7) was unchanged after re-heating heat-set
samples (~40 kPa, Figure 9). Since the effect of heat exposure on polymeric bonding
measured by FTIR, Poisson's ratio, tangent modulus and dimensional stability correlate,
variation in large samples can now be attributed to either temperature or compression
gradients,[2,4,5,14,15,18,19] an important step in designing a commercial route to produce auxetic
foam.[40]
A possible reason (adhesion of cell ribs)[2,27] for the positive Poisson's ratio and
increased stiffness of samples heated at high temperature for long time was not identified.
Further work should apply direct volume correlation[36] following in-situ tensile tests using
micro CT scans of 'heat-set' samples to inspect whether touching ribs are stuck together or
able to separate. Aspects of thermo-mechanical conversions not included in this work were
annealing or cooling rate[50,59,67] and relaxation of residual stresses by hand stretching.[2,7]
Samples fabricated at 160°C for three hours only exhibit compressive NPR after
25
respectively), possibly be due to thermal relaxation. Whether the relaxation changes
polymeric and/or cell structure (leading to NPR) was unclear. Further work testing this PU
foam could include the effects of annealing, slow cooling and controlled isotropic relaxation
on NPR, Young's moduli and polymeric bonding. The volume compression in different foams
can be fixed by other mechanisms, such as by softening and re-hardening of copolymers.[12,13]
5. Conclusions
Thermo-mechanical auxetic conversions for open cell PU foam have been analyzed in
detail. The imposed re-entrant structure required sufficient softening (in this case by heat) to
fix it in place. The effect on dimensional stability, Poisson's ratios and Young's moduli of
small increases in conversion temperature were comparable to large increases in conversion
time. Minimum mean values for Poisson's ratio were ~-0.2 (VCR = 3, 130°C, 140°C and
160°C for 180, 60 & 20 minutes, respectively) and comparable to other similar studies.
Isotropic, re-entrant samples with quasi-linear stress vs. strain relationships and a low positive
Poisson's ratio (Figures 6 & 9) will be useful iso-density comparator foams when assessing
the effects of NPR on indentation resistance, vibration damping and impact force attenuation
(to name a few).
As heat exposure increased above 150°C for 20 minutes, several observations were
noted:
i) Samples became stiffer and Poisson's ratio generally increased from its minimum
value (~-0.2) towards (but not necessarily reaching) zero in tension, or small positive values
in compression. The samples heated for 20 minutes retained the largest magnitude of NPR as
heating temperature was increased.
ii) Sample expansion over time and after re-heating gradually reduced.
iii) The hydrogen bonding strength between urea groups (C=O---N-H) increased
relatively as did their population suggesting a possible mechanism to fix compression in the
26
iv) Mass loss became significant at 200°C showing onset of degradation - which was
backed up by several spectral changes
Samples fabricated at higher temperatures and longer times (200°C for 20 minutes, >
190°C for 60 minutes, > 160°C for 180 minutes) exhibited dimensional stability and tensile
NPR, but did not have compressive NPR. Samples fabricated with a VCR of three at 140°C
for 180 minutes retained their compressive and tensile NPR and almost complete imposed
compression (FVR > 2.7) after re-heating. Decreasing the conversion temperature to 120°C or
130°C for the same heating time of 180 minutes produced foams from a one-stage process
having similar NPR and FVR values to 'blocked shape memory' foams produced elsewhere
using a multi-stage cyclic process.
6. References
1. Lakes R.S. Foam Structures with a Negative Poisson's Ratio. Science. 1987.235(4792). 1038–40. 2. Chan N., Evans K.E. Fabrication methods for auxetic foams. J. Mater. Sci. 1997.32. 5945–53. 3. Critchley R., Corni I., Wharton J.A., Walsh F.C., Wood R.J.K., Stokes K.R. A review of the
manufacture, mechanical properties and potential applications of auxetic foams. Phys. Status Solidi Basic Res. 2013.250(10). 1963–82.
4. Bianchi M., Scarpa F., Banse M., Smith C.W. Novel generation of auxetic open cell foams for curved and arbitrary shapes. Acta Mater. 2011.59(2). 686–91.
5. Duncan O., Allen T., Foster L., Senior T., Alderson A. Fabrication, characterisation and modelling of uniform and gradient auxetic foam sheets. Acta Mater. 2017.126. 426–37.
6. Alderson A., Alderson K.L., McDonald S.A., Mottershead B., Nazare S., Withers P.J.,Yong, Y. Piezomorphic materials. Macromol. Mater. Eng. 2013.298(3). 318–27
7. Alderson A., Davies P.J., Alderson K.I.M.L., Smart G.M. The Effects of Processing on the Topology and Mechanical Properties of Negative Poisson’s Ratio Foams. Proc. IMECE2005 2005 ASME Int. Mech. Eng. Congr. Expo. Proc. IMECE200. 2005. 1–8.
8. Scarpa F., Pastorino P., Garelli A., Patsias S., Ruzzene M. Auxetic compliant flexible PU foams: static and dynamic properties. Phys. Stat. Sol. (b) 2005.242(3). 681–94.
9. Chan N., Evans K.E. Microscopic examination of the microstructure and deformation of conventional and auxetic foams. J. Mater. Sci. 1997(2). 5725–36.
10. Gatt R., Attard D., Manicaro E., Chetcuti E., Grima J.N. On the effect of heat and solvent exposure on the microstructure properties of auxetic foams: A preliminary study. Phys. Status Solidi Basic Res.
2011.248(1). 39–44.
11. Boba K., Bianchi M., McCombe G., Gatt R., Griffin A.C., Richardson R.M., Scarpa, F., Hamerton, I., Grima, J. Blocked shape memory effect in negative Poisson’s ratio polymer metamaterials. ACS Appl. Mater. Interfaces 2016. acsami.6b02809.
12. Li Y., Zeng C. On the successful fabrication of auxetic polyurethane foams: Materials requirement, processing strategy and conversion mechanism. Polym. (United Kingdom). 2016.87. 98–107.
13. Li Y., Zeng C. Room-Temperature, Near-Instantaneous Fabrication of Auxetic Materials with Constant Poisson’s Ratio over Large Deformation. Adv. Mater. 2016.28(14). 2822–6.
14. Duncan O., Foster L., Senior T., Allen T., Alderson A. A Comparison of Novel and Conventional Fabrication Methods for Auxetic Foams for Sports Safety Applications. Procedia Eng. 2016.147(0). 384–9.
15. Loureiro M.A., Lakes R.S. Scale-up of transformation of negative Poisson’s ratio foam: Slabs. Cell. Polym. 1997.16(5). 349–63.
27
converting process of auxetic foam using three different statistical methods. Meas. J. Int. Meas. Confed.
2018.119. (August 2017). 108–16.
17. Sanami M., Alderson A., Alderson K.L., McDonald S. a., Mottershead B., Withers P.J. The production and characterization of topologically and mechanically gradient open-cell thermoplastic foams. Smart Mater. Struct. 2014.23(5). 55016.
18. Allen T., Hewage T., Newton-Mann C., Wang W., Duncan O., Alderson A. Fabrication of Auxetic Foam Sheets for Sports Applications. Phys. Status Solidi Basic Res. 2017.1700596. 1–6.
19. Allen T., Duncan O., Foster L., Senior T., Zampieri D., Edeh V., Alderson A. Auxetic foam for snow-sport safety devices. Snow Sport. Trauma Saf. Proc. Int. Soc. Ski. Saf. 2016.21.
20. Grima J.N., Attard D., Gatt R., Cassar R.N. A novel process for the manufacture of auxetic foams and for their re-conversion to conventional form. Adv. Eng. Mater. 2009.11(7). 533–5.
21. Lisiecki J., Błazejewicz T., Kłysz S., Gmurczyk G., Reymer P., Mikułowski G. Tests of polyurethane foams with negative Poisson’s ratio. Phys. Status Solidi Basic Res. 2013.250(10). 1988–95.
22. Gibson L.J., Ashby M.F. Cellular solids. Structure and properties. 1997.pp.67, 176-183, 259-264, 286, 498.
23. Chan N., Evans K.E. The mechanical properties of conventional and auxetic foams. Part I: compression and tension. J. Cell. Plast. 1999.35(2). 130–65.
24. Masters I.G., Evans K.E. Models for the elastic deformation of honeycombs. Compos. Struct. 1996.35(4). 403–22.
25. Choi J.B., Lakes R.S. Non-linear properties of metallic cellular materials with a negative Poisson’s ratio. J. Mater. Sci. 1992.27(19). 5375–81.
26. Choi J.B., Lakes R.S. Nonlinear Analysis of the Poisson’s Ratio of Negative Poisson’s Ratio Foams. J. Compos. Mater. 1994.29. 113–28.
27. Choi J.B., Lakes R.S. Nonlinear properties of polymer cellular materials with a negative Poisson’s ratio. Mater. Sci. 1992.27. 4678–84.
28. Li, D., Dong, L., Lakes, R. S. The properties of copper foams with negative Poisson's ratio via resonant ultrasound spectroscopy. Phys. Status Solidi Basic Res. 2013.250(10). 1983-1987.
29. Allen T., Shepherd J., Hewage T.A.M., Senior T., Foster L., Alderson A. Low-kinetic energy impact response of auxetic and conventional open-cell polyurethane foams. Phys. Status Solidi Basic Res.
2015.9. 1–9.
30. Grima J.N., Gatt R., Ravirala N., Alderson A., Evans K.E. Negative Poisson’s ratios in cellular foam materials. Mater. Sci. Eng. A. 2006.423(1–2). 214–8.
31. Pozniak, A. A., Smardzewski, J., & Wojciechowski, K. W. Computer simulations of auxetic foams in two dimensions. Smart Mater. Struct. 2013.22. 084009
32. Smith C.W., Grima J.N., Evans K.E. Novel mechanism for generating auxetic behaviour in reticulated foams: Missing rib foam model. Acta Mater. 2000.48(17). 4349–56.
33. Gaspar N., Ren X.J., Smith C.W., Grima J.N., Evans K.E. Novel honeycombs with auxetic behaviour. Acta Mater. 2005.53(8). 2439–45.
34. Evans K.E., Alderson A., Christian F.R. Auxetic Two-dimensional Polymer Networks. 1995.91(16). 2671–80.
35. Alderson A., Evans K.E. Modelling concurrent deformation mechanisms in auxetic microporous polymers. J. Mater. Sci. 1997.32(11). 2797–809.
36. McDonald S.A., Dedreuil-Monet G., Yao Y.T., Alderson A., Withers P.J. In situ 3D X-ray
microtomography study comparing auxetic and non-auxetic polymeric foams under tension. Phys. Status Solidi Basic Res. 2011.248(1). 45–51.
37. Budynas R.G. Advanced strength and applied stress analysis. WCB/McGraw-Hill; 1999.pp.21, 80. 38. Wojciechowski, K.W. Remarks on "Poisson ratio beyond the limits of the elasticity theory". J. Phys. Soc.
Jpn. 2003.72. 1819-1820.
39. Evans K.E., Alderson A. Auxetic materials: Functional materials and structures from lateral thinking! Adv. Mater. 2000.12(9). 617–28.
40. Duncan O., Shepherd T., Moroney C., Foster L., Venkatraman P.D., Winwood K., et al. Review of auxetic materials for sports applications: expanding options in comfort and protection. Appl. Sci.
2018.8(6). 941.
41. Chan N., Evans K.E. Indentation resilience of conventional and auxetic foams. J. Cell. Plast. 1998.34. 231–60.
42. Lakes R.S. Design Considerations for Materials with Negative Poisson’s Ratios. J. Mech. Des.
1993.115(4). 696.
43. Lowe A., Lakes R.S. Negative Poisson’s ratio foam as seat cushion material. Cell. Polym. 2000.19(3). 157–67.
28
45. Brandel B., Lakes R.S. Negative Poisson’s ratio polyethylene foams. J. Mater. Sci. 2001.36(24). 5885– 93.
46. Dai Z., Weng C., Liu L., Hou Y., Zhao X., Kuang J., Shi, J., Wie, Y., Lou, J., Zhang, Z. Multifunctional Polymer-Based Graphene Foams with Buckled Structure and Negative Poisson’s Ratio. Sci. Rep. 2016.6. 32989
47. Chiang F.P., Uzer G. Mapping full field deformation of auxetic foams using digital speckle photography. Phys. Status Solidi Basic Res. 2008.245(11). 2391–4.
48. Scarpa F., Giacomin J., Zhang Y., Pastorino P. Mechanical performance of auxetic polyurethane foam for antivibration glove applications. Cell. Polym. 2005.24(5). 253–68.
49. Duncan O., Allen T., Foster L., Gatt R., Grima J. N., Alderson A. Controlling density and modulus in auxetic foam fabrications—-implications for impact and indentation testing. MDPI Proceedings. 2018.
2(6).250.
50. Bianchi M., Frontoni S., Scarpa F., Smith C.W. Density change during the manufacturing process of PU-PE open cell auxetic foams. Phys. Status Solidi Basic Res. 2011.248(1). 30–8.
51. Bianchi M., Scarpa F.L., Smith C.W. Stiffness and energy dissipation in polyurethane auxetic foams. J. Mater. Sci. 2008.43(17). 5851–60.
52. Bianchi M., Scarpa F., Smith C.W. Shape memory behaviour in auxetic foams: Mechanical properties. Acta Mater. 2010.58(3). 858–65.
53. Bianchi M., Scarpa F., Smith C.W., Whittell G.R. Physical and thermal effects on the shape memory behaviour of auxetic open cell foams. J. Mater. Sci. 2010.45(2). 341–7.
54. Wang Y.C., Lakes R., Butenhoff A. Influence of Cell Size on Re-Entrant Transformation of Negative Poisson’s Ratio Reticulated Polyurethane Foams. Cell. Polym. 2001.20(4–6). 373–85.
55. Yao Y., Luo Y., Xu Y., Wang B., Li J., Deng H., Lu H. Fabrication and characterization of shape memory polystyrene foams. Compos. Part B Eng. 2018.152. 1–7.
56. Ge C. A comparative study between felted and triaxial compressed polymer foams on cushion performance. J. Cell. Plast. 2013.49(6). 521–33.
57. Duncan O., Foster L., Senior T., Alderson A., Allen T. Quasi-static characterisation and impact testing of auxetic foam for sports safety applications. Smart Mater. Struct. 2016.25(5). 54014.
58. Bezazi A., Scarpa F. Mechanical behaviour of conventional and negative Poisson’s ratio thermoplastic polyurethane foams under compressive cyclic loading. Int. J. Fatigue. 2007.29(5). 922–30.
59. Reghunadhan A., Thomas S. Polyurethanes. In: Polyurethane Polymers. Elsevier Inc. 2017. 1–16. 60. Teo L.-S., Chen C.-Y., Kuo J.-F. Fourier Transform Infrared Spectroscopy Study on Effects of
Temperature on Hydrogen Bonding in Amine-Containing Polyurethanes and Poly(urethane−urea)s. Macromolecules. 1997.30(6). 1793–9.
61. de Haseth J.A., Andrews J.E., McClusky J. V., Priester R.D., Harthcock M.A., Davis B.L.
Characterization of Polyurethane Foams by Mid-Infrared Fiber / FT-IR Spectrometry. Appl. Spectrosc.
1993.47(2).
62. Kim B.H., Yoon K., Moon D.C. Thermal degradation behavior of rigid and soft polyurethanes based on methylene diphenyl diisocyanate using evolved gas analysis-(gas chromatography)-mass spectrometry. J. Anal. Appl. Pyrolysis. 2012.98. 236–41.
63. Mather P.T., Luo X., Rousseau I.A. Shape Memory Polymer Research. Annu. Rev. Mater. Res.
2009.39(1). 445–71.
64. Phillips N., Hassan G.M., Dyskin A., Macnish C., Pasternak E. Digital image correlation to analyze nonlinear elastic behavior of materials. Proc. - Int. Conf. Image Process. ICIP. 2018.2017–September. 4367-4371
65. Lee H.S., Wang Y.K., Hsu S.L. Spectroscopic Analysis of Phase Separation Behavior of Model Polyurethanes. Macromolecules. 1987.20(9). 2089–95.
66. Jiao L., Xiao H., Wang Q., Sun J. Thermal degradation characteristics of rigid polyurethane foam and the volatile products analysis with TG-FTIR-MS. Polym. Degrad. Stab. 2013.98(12). 2687–96. 67. Herrera M., Matuschek G., Kettrup A. Thermal degradation of thermoplastic polyurethane elastomers
(TPU) based on MDI. Polym. Degrad. Stab. 2002.78(2). 323–31.
68. A. Rudin. The Elements of Polymer Science & Engineering. 2nd ed. Academic Press, ISBN;
1992.pp.379,383.
Acknowledgements
29
supplying the funding to carry out the work (via. their Graduate Teaching Associate scholarship).