Information impacts on route choice and learning behavior in a congested
1network: An experimental approach
23
Xuan Lu1*, Song Gao2, Eran Ben-Elia3 4
5
1 Department of Civil and Environmental Engineering 6
University of Massachusetts Amherst 7
130 Natural Resources Road, Amherst, MA 01003 8
Email: [email protected]
9 10 11
2 Department of Civil and Environmental Engineering 12
University of Massachusetts Amherst 13
130 Natural Resources Road, Amherst, MA 01003 14
Email: [email protected]
15 16
3 Centre for Transport & Society 17
Faculty of Environment and Technology 18
University of the West of England 19
Frenchay Campus, BRISTOL, BS16 1QY 20
Email: [email protected]
21 22 23
* corresponding author 24
25
Words: 6098+7*250 = 7848 26
27 28 29 30
Submitted on: November 15, 2010 31
ABSTRACT
1
Every individual traveler makes route choices in an inherently uncertain environment, 2
due to random disruptions to the traffic system such as incidents and bad weather, and random 3
behavior of his/her fellow travelers. The premise underlying the development of Advanced 4
Traveler Information Systems (ATIS) that better-informed travelers make better route choices 5
both at the individual and system levels should not be taken as granted but rigorously tested. This 6
paper studies two types of information, namely en route real-time information on the occurrence 7
of an incident and ex post information on foregone payoffs (FPs), i.e., travel times on non-chosen 8
routes. Data were collected from an interactive experiment, where human subjects made multiple 9
rounds of route choices in a hypothetical network subject to random capacity reductions, and 10
travel times were determined by performance functions of route flows from the previous round. 11
Preliminary results and bootstrap statistical tests are presented. It is indicated that en route real-12
time information increases the network’s travel time saving and reliability under the specific 13
setting of the experiment, yet FP information has the opposite impact. The most efficient 14
information structure in terms of travel time saving is a combination of real-time information and 15
no FP information. Furthermore, the availability of real-time information at downstream nodes 16
encourages participants’ strategic behavior at the origin. Last but not least, FP information seems 17
to increase risk-seeking behavior, and it encourages route switching without real-time 18
information, but suppresses them with real-time information. These results are potentially 19
valuable for policy evaluations regarding further developments of ATIS. 20
Keywords: Route choice behavior, real-time information, forgone payoff, interactive experiment, 21
stochastic network, strategic route choice, learning 22
INTRODUCTION
1
Every individual traveler makes route choices in an inherently uncertain environment. 2
The sources of uncertainties in a traffic network can be broadly divided into two categories. At 3
one hand, there are unpredictable disturbances to the system that usually result in capacity 4
reductions, such as incidents, vehicle breakdowns, bad weather, special events, and work zones. 5
On the other hand, a more prevalent although probably less disruptive source is his/her fellow 6
travelers’ unpredictable behavior, where the collective random individual departure time and 7
route choices result in the random shifting of traffic flows in time and space. 8
A traveler can reduce the uncertainty in his/her decision-making by acquiring more 9
information. The natural source of information is the traveler’s own experience, obtained through 10
explorations of alternative routes over a relatively long time period on regular traffic conditions. 11
However personal experience is likely not enough given the large scale of the decision problem, 12
in terms of the number of alternative routes and the myriad of sources of uncertainties. 13
Information beyond personal experience can come from fellow travelers, and more recently, 14
advanced traveler information systems (ATIS) that makes use of the fast developing sensor, 15
telecommunication and computing technologies. Information provided by an ATIS can be 16
divided into three categories: historical, prevailing, and predictive (1). For example, Google 17
Maps provide archived average traffic conditions by time-of-the-day and day-of-the-week, which 18
could help travelers reduce the uncertainties from unknown alternatives. Google Maps also 19
provides information on prevailing conditions that are useful to travelers who are already 20
familiar with the area and need to know, for example, whether there are constructions on his/her 21
usual route today. Predictive information concerns the traffic conditions in the near future, which 22
have to be calculated by prediction models and not as widely available as the other two types. 23
Prevailing and predictive information could potentially reduce the uncertainties from disruptive 24
disturbances and day-to-day demand fluctuations. 25
In this paper, we focus on the impacts of two types of information, namely the en route 26
real-time information on the occurrence of an incident (prevailing) and the ex post information 27
on foregone payoffs (FPs), which are the travel times on un-chosen alternative routes (historical). 28
We study the impacts at both the individual and system levels. Specially, we are interested in the 29
following three questions: 30
1) How does FP information affect a traveler’s route choice learning process? 31
2) Does a traveler make strategic route choices, i.e., planning ahead for real-time 32
information downstream? 33
3) How does real-time information affect the performance of a traffic system subject to 34
random capacity reductions? 35
The rest of the paper is organized as follows. Related research is reviewed in the next 36
section underlying the contribution of this paper. The methodologies are then presented 37
including the experimental setup and analysis procedures. Preliminary results based on bootstrap 38
statistics are discussed in the following section. Finally we conclude with major findings and 39
future research directions. 40
41
LITERATURE OVERVIEW
In this section, we provide a literature overview along the lines of the aforementioned 1
three research questions. The review is limited to empirical research with stated preference (SP), 2
experimental and/or revealed preference (RP) data. Theoretical modeling and simulation studies 3
are out of the scope. 4
Decision makers can learn (over time) from their own experience i.e. feedback 5
information from their actual choices. Experience leads to reinforced learning but, at the same 6
time, it is also a function of sampling available information on the basis of the past experience. 7
Psychologists have been long aware of the“payoff variability effect” which suggests increasing 8
the level of variability in the decision environment inhibits reinforced learning. It occurs when 9
the decision maker receives no specific information describing the possible outcomes of choice 10
and has to rely on feedback from past experience (see e.g., 2). Descriptive information that 11
provides a more complete picture of the decision environment could potentially affect the 12
learning process, however, the resulting behavior varies. Several studies (e.g. 3, 4) assert that 13
travelers will tend to exhibit risk aversion when faced with static pre-trip travel time information. 14
Combining both experiential and descriptive information in the experiment setup, (5,6) have 15
shown that descriptive information expedites travelers’ learning but may also encourage them to 16
exhibit risk prone behavior. The exception is the study by (7) involving travelers’ interaction in a 17
competitive game setting. They show that travelers with access to FP information have less 18
capricious behavior (in terms of route switching). (8) also shows people perform best under the 19
most elaborate information scenario, though the benefit of ex post information decreasing over 20
time. 21
The literature saw a large body of studies on diversion or compliance under real-time 22
information, e.g., at a variable message sign (VMS). See (9)(10) for two recent reviews on this 23
topic. However, the modeled adaptation behavior is basically reactive – meaning that the 24
traveler’s decisions before arriving at a VMS do not consider the fact that the VMS will provide 25
updated traffic conditions in the future. In reality, travelers might decide to acquire information 26
as long as there is a reasonable prospect of reward from it (11). Therefore the fact that a branch 27
of the network has VMS installed could make it more attractive even before the traveler arriving 28
at the VMS location. A strategic traveler, in this case, is one that considers the availability of 29
information in all later decision stages, not just the current one. (12) and (13) verified that a 30
significant portion of subjects made strategic route choices, using PC- and driving-simulator-31
based experiments respectively. However, these studies were static in nature and did not account 32
for experiential or FP information. 33
A main drawback of all the aforementioned individual-based studies is that travel times 34
were usually obtained from underlying probability distributions that were not affected by the 35
travelers’ choices. Thus, the inherent link occurring on congested networks (recurring and non-36
recurring) between travelers’ route choices and travel times is missing in the current literature. 37
(14) (15) (16)(7) (17) (18)(19) carried out route choice experiments in congested networks 38
where travel times are determined by subjects’ route choices through either travel performance 39
functions or traffic simulations. However, their networks were deterministic and the day-to-day 40
variations in travel times resulted purely from travelers’ departure time and/or route choice 41
variations, not disturbances that brought forth random capacity reductions. In the domain of RP 42
data, (20) showed that by broadcasting expected travel times, VMSs can improve the network 43
As such, it is the purpose of this paper to overcome some of the drawbacks of previous 1
work by accounting for individual strategic route choices and learning processes and the 2
resulting system-wide outcomes in an experimental setting involving random disturbances and 3
an array of information types: en route real-time, experiential through feedback and FP. To the 4
best of the authors’ knowledge, this setup, which provides a conceivably more realistic 5
environment to study route choice behavior under uncertainty, has never been explored before in 6
the travel behavior literature. 7
8
METHODOLOGY
9
Experimental set up and design
10
In this research we adopted the network structure from (12), which allows strategic 11
routing behavior and also provides en route real-time information relating to incidents. A web-12
based non-cooperative interactive route choice experiment was carried out on a congested 13
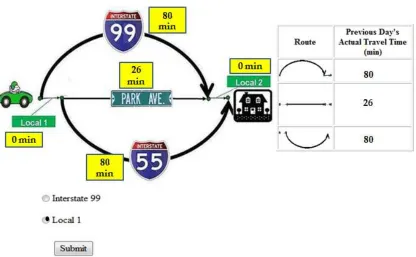
hypothetical network with occurring random incidents. Figure 1 presents a screen shot of the 14
experiment lay out containing three possible routes from origin to destination, whereby Park 15
Avenue is a stochastic link with random incidents; other links all have deterministic link 16
performance functions. 17
There are in total four scenarios with two control variables, real-time and FP information. 18
The real-time information relates to an incident indicator via a VMS located just before the 19
second branch, which tells drivers whether there is an incident on Park Avenue. This 20
information, however, is not available at any other node and only those passing the VMS are 21
exposed to it. A scenario without the real-time information is named an incident case, while that 22
with the real-time information is named an information case. Note that random incidents exist in 23
any of the cases. The FP information gives travelers the ex post travel times on their non-chosen 24
alternatives after each choice trial, and otherwise, only the chosen alternative’s travel time (i.e. 25
experiential information) was given. One session of the experiment consisted of two cases, 26
incident and information, both with FP. Another session of experiment consisted of the incident 27
and information cases under the without (w/o) FP situation. Twelve participants were allocated 28
randomly between the two sessions respectively with six participants each. In both sessions, 29
participants first took the incident case and then information case. Participants took a break and 30
received another round of instructions before a new scenario began to minimize the carryover 31
effect. Each combined experiment consisted of sixty trial days in the incident case followed by 32
1
FIGURE 1 Screen shot of Initial Experiment's Presentation
2
Following the recruiting method of (5)(6)(7)(17), which conducted human subject 3
experiments using university students for transportation or economic research, most of our 4
participants were students from the University of Massachusetts Amherst. In our two experiment 5
sessions, there are a total of twelve subjects, including six undergraduates, four graduates, one 6
professor and one from outside of the university. Each had to be at least eighteen years old and 7
hold a valid U.S. driver’s license with at least one year of driving experience. Our research is of 8
an exploratory nature that deals with human mental processes, and thus we adopted the common 9
approach in cognitive and behavioral studies where major breakthroughs were generally first 10
made in experiments conducted with university students and later further verified in field studies 11
(21). Future studies involving more diversified population groups are required if conclusions 12
from the exploratory phase are to be generalized to the general population. 13
The payment is $30 for each participant regardless of the performance during the 14
experiment. Our primary goal is to let the subjects apply their real life experience in making the 15
route choices. We try to avoid creating a sense of ‘winning’ during their trip making as in reality 16
travelers are not competing for monetary rewards. Moreover, providing a performance-based 17
incentive in a non-cooperative setting with a rather limited number of participants may induce 18
them to try to maximize personal gains by influencing equilibrium conditions, which they would 19
not be doing in reality where the ability of one driver to influence traffic conditions is negligible. 20
Therefore, the fixed payment is a compensation for them to take part in the experiment. 21
Secondly, if performance-based incentives are given, it is implicitly assumed that the same value 22
of time applies to every participant, which is not always the case and might bring unnecessary 23
complications. Moreover, there is no solid proof that people would have the same risk attitude 24
towards monetary gains (or losses) and travel time savings (or losses) and we are cautious in 25
neither necessary nor sufficient to ensure subjects' cooperativeness, thoughtfulness, or 1
truthfulness. 2
Before experiment, participants were instructed to complete a set of trips from work to 3
home on a day-to-day basis, and informed regarding the characteristic of each road in the 4
network. The free flow travel time on each road was shown on the map and the corresponding 5
congested coefficient was also explained during the instructions, whereby inter-state highways 6
have the lowest congested coefficient, local roads have the largest and the shortcut arterial Park 7
Avenue has the value in between. Participants were informed that incidents could occur on Park 8
Avenue with a probability of 0.25, which may results in significant congestion. However, the 9
exact cost functions were not revealed to them. The numbers in the yellow boxes were the links’ 10
actual travel times on the previous day. In day 1, those numbers reflected free flow link travel 11
times. A table provided participants with the previous day’s actual route travel times. Note that, 12
in the without FP case, only the information of the route traveled in the last day was shown. 13
Participants were required to make a choice at each of the two nodes by determining which link 14
to take next. Note that at the first step, if I-99 was chosen no other choice was made and the trip 15
was continued by taking Local 2 to the destination. Routes were chosen by clicking the 16
appropriate radio button and then the “submit” button to confirm. At the end of each trial-day, all 17
participants' route choices were recorded and the resulting actual travel time for each alternative 18
route was calculated by plugging the number of choices into the link performance functions. The 19
actual link and route travel times was presented at the beginning of the next day. 20
21
Equilibrium design
22
The link travel time depends on the numbers of participants choosing the link. 23
We use the following notation: 24
a : name of link 25
i : index of path (routing policy) 26
xa : flow on link a
27
fi : flow on path (routing policy) i
28
Ca(xa) : link travel time as a function of flow on link a
29
ei : (mean) travel time of path (routing policy) i
30
The travel time (in minutes) on a given link is a function of the link flow specified as 31
follows: 32
CI-99(xI-99) = 80 + xI-99, CI-55(xI-55) = 80 + xI-55, Clocal1(x local1) = 4xlocal1, 33
Clocal2(x local2) =4x local2, 34
CPark_ave(xpark_ave) = 26+ 3xpark_ave, with probability 0.75 (normal condition) 35
26+55xpark_ave, with probability 0.25 (incident condition) 36
The three paths are defined as follows: 37
Path 1: I-99-Local 2, 38
Path 2: Local 1-Park Avenue.-Local 2 39
We use a routing policy to describe the strategic route choice, which will be manifested 1
as paths under different network conditions. For example, one routing policy (Routing Policy 4) 2
can be defined as: “first take Local 1, and if the incident has occurred, take I-55, otherwise take 3
Park Avenue and then Local 2”. It will be manifested as Path 2 under the normal condition and 4
Path 3 under the incident condition. A path can be viewed as a specialized routing policy, e.g., 5
Path 2 can be described as follows: “take ‘Local 1’ at the origin, and take ‘Park Avenue’ no 6
matter what the VMS shows”. Notwithstanding, such adaptive strategies exist only under the 7
information case. This is because real-time information provided at the second branch allows 8
meaningful route changes, which helps participants update their route choice in response to 9
incident information. However, in the incident case, no such cognitive mechanism exists to 10
improve their choices. Therefore, only three fixed paths are available to a participant. 11
Route choice behavior can be compared to the theoretical results under the assumption of 12
user equilibrium principles. Under the incident case the resulting user equilibrium condition will 13
be generalized as such that all used paths have equal and minimum mean travel times. The 14
equilibrium solution’s flows are: f1 = f3 = 1.784, f2 =2.432, with the corresponding path travel 15
times are: e1 = e2 = e3 =98.65. 16
In contrast under the information case, we hypothesize routing-policy-based user 17
equilibrium where all used routing policies have equal and minimum mean travel times. There 18
are five possible routing policies in the network. Routing Policy 1 through 3 are Paths 1 through 19
3, and Routing Policy 4 is the one just discussed. Routing Policy 5 is the opposite of Routing 20
Policy 4, i.e. “first take Local 1, and if the incident has occurred, take Park Avenue and then 21
Local 2, otherwise take I-55”. Routing Policy 5 is conceivably inefficient. The equilibrium 22
solution’s flows are: f1 = f3 = f5 = 0, f2 =1, f4=5. We can verify that under these routing policy 23
flows, the network is in equilibrium such that Routing Policies 2 and 4 have equal and minimum 24
mean travel times of 96.25 minutes. 25
26
Bootstrap statistical tests
27
Since the decisions of the participants are inherently dependent upon each other, in a 28
sense each scenario provides just observations from one “compound subject” formed by six 29
element subjects. Moreover since the same group participated in both the incident and 30
information cases (i.e. repeated measurements), these are also dependent. These 31
complications restricted us from doing conventional statistical testing using a random 32
sample of subjects (both parametric and nonparametric). 33
Even though there is in a sense only one “compound subject” for each scenario, the 34
observations were obtained from a day-to-day random learning process. In order to draw 35
valid conclusions for the two specific “compound subjects”, we need to carry out statistical 36
testing that accounts for the random process over the sixty trial days. Instead of making 37
hypothesis over a random sample of subjects, all of our null hypotheses regarding no-38
difference are between two random processes using bootstrap techniques (23). These include 39
the following variables: average travel times, route shares and route switches. Bootstrap 40
simulation is an approximate method to derive statistics by re-sampling from the original 41
data - the approximation lies on the fact that the original data is treated as the true empirical 42
The block bootstrap method is used due to the data dependencies from day to day 1
(20). Blocks are re-sampled with block lengths having a geometric distribution with a mean 2
of 5, the number of weekdays in a week. We conduct the bootstrap of the time series 10,000 3
times and obtain 10,000 new time series, each with a length of sixty days. We can then 4
calculate the sample average from each bootstrap sample, which can be viewed as one 5
realization of the distribution of the sample average. The p-value for a null hypothesis of 6
equal mean between the two random processes can be obtained by counting the frequency at 7
which the difference between each pair of sample average realizations from the two random 8
processes is greater than or equal to the difference between the original sample averages. 9
Note that the “compound subject” remained intact and the re-sampling applied only to the 10
day-to-day process. 11
12
RESULTS
13
Route Shares
14
Table 1 summarizes the average route shares over the first and second thirty-day period 15
and all sixty days respectively, in each of the four scenarios. It can be seen that none of the 16
scenarios reached the theoretical equilibrium within the span of sixty days. Note that, the 17
equilibriums here refer to those we calculated in the equilibrium design, which are based on a 18
simplified traffic assignment model by assuming a minimum and equal mean travel time on each 19
used path/routing policy. Route shares in the information case with FP, are the closest to the 20
equilibrium pattern, and comparing the first and last thirty trials, we can also observe that route 21
shares are approaching the network equilibrium. This is because the information case with FP 22
has the lowest level of uncertainty among all scenarios, which makes it easier to get to the 23
equilibrium. Based on our previous assumptions, the equilibriums in the incident and information 24
cases are quite different, as there are only three paths in the incident case, compared to five 25
routing policies in the information case where real-time information is provided at the branch 26
allowing for a detour from prospective incidents. Such incident information does in fact affect 27
the individual behavior pattern, where more participants tend to choose the stochastic branch at 28
the origin node and the stochastic shortcut at the intermediate node in the information case than 29
in the incident case, regardless of FP, which indicates that travelers would take strategic 30
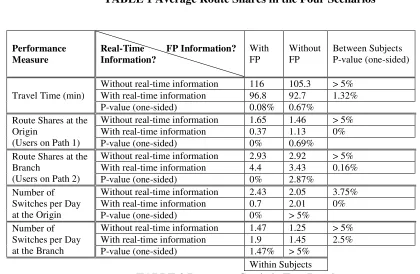
responses to the information en route. Table 2 summarizes the complete statistic results in route 31
shares, network travel time and switches, and it shows that there are significant differences on 32
road shares between the information and incident cases (with or without FP) at the level of 1% 33
(one-sided). However, according to conventional route choice models, this difference should 34
only exist at the intermediate node, where travelers are assumed to react on the spot to en route 35
information rather than plan strategically. Thus, the strategic advantage of the provided 36
information can be recognized as in the static study of (12)(13). 37
38
Iterations
Path 1 Path 2 Path 3
TABLE 1 Average Route Shares in the Four Scenarios
1 2
Performance
Measure Real-Time FP Information? Information?
With FP Without FP Between Subjects P-value (one-sided)
Travel Time (min)
Without real-time information 116 105.3 > 5%
With real-time information 96.8 92.7 1.32%
P-value (one-sided) 0.08% 0.67%
Route Shares at the Origin
(Users on Path 1)
Without real-time information 1.65 1.46 > 5%
With real-time information 0.37 1.13 0%
P-value (one-sided) 0% 0.69%
Route Shares at the Branch
(Users on Path 2)
Without real-time information 2.93 2.92 > 5%
With real-time information 4.4 3.43 0.16%
P-value (one-sided) 0% 2.87%
Number of Switches per Day at the Origin
Without real-time information 2.43 2.05 3.75%
With real-time information 0.7 2.01 0%
P-value (one-sided) 0% > 5%
Number of Switches per Day at the Branch
Without real-time information 1.47 1.25 > 5%
With real-time information 1.9 1.45 2.5%
P-value (one-sided) 1.47% > 5%
Within Subjects TABLE 2 Bootstrap Statistic Test Results
3
As for the impacts of FP, average route shares with FP are closer to the designed 4
equilibrium than those without FP, in both incident and information cases, which indicates that 5
providing FP helps push the network towards user equilibrium to some extent. However, for the 6
information scenario, participants in the FP case seem to be more risk-seeking than those in the 7
without FP sessions whereby more people choose the stochastic shortcut through Park Avenue. 8
Participants in the without FP group are more inclined to choose Path 1, which is the 9
deterministic route. According to the bootstrap statistical test, there is a significant difference 10
between the average route shares with and without FP at the origin at the level of 1% (one-11
sided). Moreover, the percentage of participants at the intermediate node who choose the 12
deterministic detour is also higher in the without FP cases than with FP. The bootstrap statistic 13
result shows a significant difference at the level of 5% (one sided). This can be explained that 14
without FP, participants become more sensitive when stuck in traffic, whereas the deterministic 15
route/detour is not too bad. Thus providing travel time information on all alternative routes could 16
potentially motivate more competition and risk-seeking behavior as suggested by (5,6). 17
Conversely, no such observation exists in the incident scenario. The bootstrap test fails to find a 18
significant difference in the shares at origin and intermediate node between the case with and 19
without FP. This may be due to the increase in the level of uncertainty, which may offset the 20
impact of FP. 21
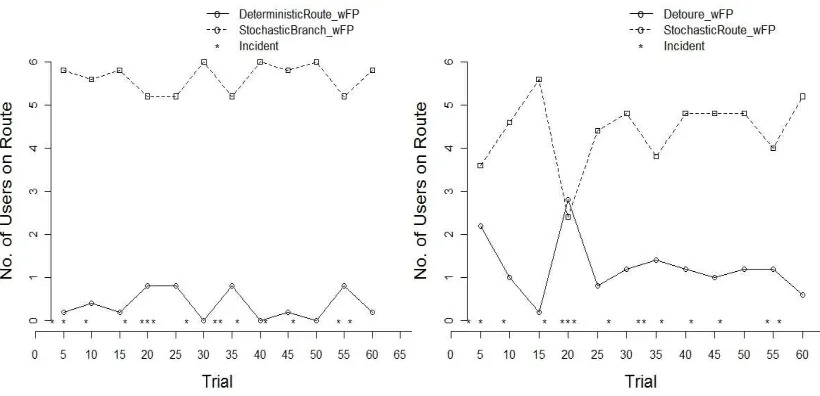
To find out how the network system performs over time, we plot in Figures 2 the average 22
route shares for every five trials at the origin and intermediate nodes in both incident and 23
information cases respectively. In Figure 2(1), shares are more stable over time with FP than 24
without FP in the incident case. This is probably related to an expedited learning rate with a 25
the information case. Comparing the charts in Figures 2(1) and 2(2) with the same index, we find 1
that shares in the information case are generally more stable compared to the incident case. This 2
indicates that real-time incident information can improve the system’s reliability. 3
4 5
(a) Route Shares at Origin Incident case with FPs (b) Route Shares at Stochastic Branch Incident case with FPs 6
7
(c) Route Shares at Origin Incident case w/o FPs (d)Route Shares at Stochastic Branch Incident case w/o FPs 8
(1) Route Shares at Two Decision Nodes in Incident Case with and without FP 9
1
(a) Route Shares at Origin Information case with FPs (b) Route Shares at Stochastic Branch Information case with FPs 2
3
(c) Route Shares at Origin Information case w/o FPs (d) Route Shares at Stochastic Branch Information case w/o FPs 4
[image:12.595.106.516.110.308.2](2) Route Shares at Two Decision Nodes in Information Case with and without FP 5
FIGURE 2 Route Shares at Two Decision Nodes 6
7
Network Travel Time
8
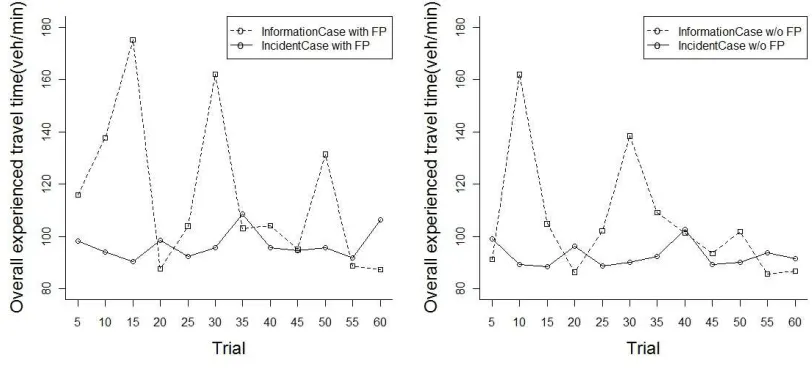
The overall network travel time is presented in Figure 3, taking the average over every 9
five trials. Overall network travel time is the average experienced travel time accounting for all 10
participants’ choices. Both Figure 3(a) and 3(b) show that average travel times are higher and 11
have larger volatility in the incident cases than in the information cases. This result indicates that 12
real-time incident information increases the efficiency and reliability of the network’s 13
travel time differences when providing incident information. In both with and without FP cases, 1
both differences are significant at the level of 1% (one-sided). Although in our designed user 2
equilibrium, the difference of mean travel times between the incident and information cases was 3
relatively small, with approximately 2.5 minutes difference, the actual observed difference is 4
much larger - 19.16 (with FP) and 12.6 (without FP) minutes respectively. In our cases, the 5
benefit that real-time information contributes to the network seems to be quite significant. It also 6
seems that without complete feedbacks, travel time is even lower under information cases. The 7
difference between the travel times with and without FP is significant at the level of 5% (one- 8
sided) under real-time information cases. This can be explained as a result of the higher tendency 9
to take the stochastic route in the FP group (more risk seeking). It also suggests that it may not 10
always be advisable to provide full feedbacks on non-chosen alternatives. 11
12
(a) With FP (b)Without FP
[image:13.595.101.507.280.466.2]13
FIGURE 3 Overall Network Travel Time
14
Route Switching
15
Route switches during the whole trip have been divided into two decision stages: one at the 16
origin, and the other at the intermediate node. A switch at origin is counted when a participant 17
switches to/from Path 1 from/to the stochastic branch, Path 2 or 3. A switch at stochastic branch 18
is counted only when a participant switches to/from Path 2 from/to Path 3. Results from the four 19
1
(a)Switch at Origin Incident case (b) Switch at Stochastic Branch Incident case 2
3
(c) Switches at Origin Information case (d) Switches at Stochastic Branch Information case 4
[image:14.595.106.506.121.311.2]5
FIGURE 4 Switches at Two Decision Nodes in Information and Incident Cases
1
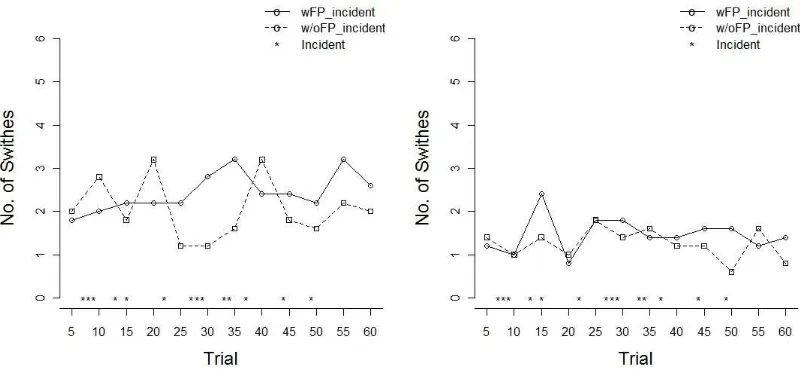
[image:15.595.107.503.108.308.2](a)Switches at Origin Information case (b) Switches at Stochastic Branch Information case 2
FIGURE 5 Daily Route Switches in the Information Cases
3
In Figure 4(a), in the incident scenarios the number of switches with FP is higher than 4
that of without FP at the origin node, with the difference significant at the level of 5% (one-5
sided) from the bootstrap statistical test. This is because participants with FP may experience two 6
situations; first - if no incident happens, travel time on Park Avenue is much lower than the other 7
two alternatives; second - if there is an incident and most participants choose the stochastic 8
branch, the deterministic route (I-99 –Local 2) has the least travel time. Without an incident 9
indictor assisting in making strategic choices, participants have to take their decision at the origin 10
and stick to it. For participants with neither information nor FP, if they find that the deterministic 11
route is acceptable, they tend to avoid unnecessary risk given that congestion is quite significant 12
when an incident occurs. This result is similar to those from previous studies relating to 13
individual choices (e.g., 6) that the lack of information increases risk-averse behavior. 14
However, under the information scenario in Figure 4(c) the trend is opposite, whereby 15
with FP provided, participants tend to switch less than without FP at the origin. This has also 16
been verified by a p-value of 0%. This is because real-time information at the branch allows 17
participants to make adaptive route choices to avoid the incident. When FP is provided, they 18
realize that choosing the branch also turns out to be an optimal decision. The impact of FP on 19
switching behavior is more significant at the origin than at the intermediate node, where incident 20
information has the decisive effect. In our experiments, the four scenarios stand for four 21
uncertainty levels. Participants tend to switch less in the two extreme conditions, when the 22
uncertainty level is either very low (with information and FP) or significantly high (without 23
information and without FP). Under the former condition, the situation becomes pretty clear, so 24
switching is unnecessary once participants learn which alternative is the optimal one. However, 25
in the latter condition, switches are avoided because very little feedback is provided, learning is 26
more difficult and participants tend to avoid unnecessary risks. The latter follows the predictions 27
Finally, in Figure 5 we present the number of switches in each trial rather than an average 1
over five trials for the information case. It can been seen that, regardless of the FP, most 2
participants respond and take advantage of the information provided at the intermediate node, 3
which indicates that strategic behavior (Routing Policy 4) has been widely adopted in the 4
information case. 5
6
CONCLUSION AND FUTURE DIRECTIONS
7
In this paper, experimental observations of a day-to-day traffic pattern evolution are 8
obtained in a simple congested network under exogenous disruptions with a given probability 9
distribution. The effects of en route real-time traveler information and ex post FP information are 10
assessed by comparing traffic patterns in the presence of uncertain disruptions. The comparison 11
is in route flows, total system travel time, and the numbers of switches. Due to the limited 12
number of experiment sessions and the small number of participants in each session, preliminary 13
results and bootstrap statistics are provided in this paper. The hypotheses are between two 14
random processes rather than over a random sample of subjects. Bootstrap statistical analysis 15
sheds some light on the trends of the route choice random process over sixty ‘days’. Based on the 16
1000 Bootstrap resampling samples, it is valid to draw statistical conclusions between two 17
random processes. 18
It is observed that en route real-time information leads to travel time savings. Providing FP 19
information makes the route flows closer to the user equilibrium pattern. However, this seems to 20
cause network travel time to increase and bootstrap statistics verify the trend in the information 21
case (but not in the incident case). The least network travel time is obtained under the scenario 22
‘with en route information and without FP’. Therefore, travel time saving also depend to a 23
certain extent on the network’s design. This adds to the empirical evidences that more 24
information in not necessarily better in a congested network. Route shares at the origin show 25
significant differences between with and without real-time information, which indicate that 26
travelers would plan in advance for the future availability of a VMS system. Last but not least, it 27
shows that participants in with FP scenarios are more risk seeking than those in without FP 28
scenarios regardless of information provision. FP information encourages route switching 29
without real-time information, but suppresses them with real-time information. 30
We are now conducting more experiment sessions with a larger sample size so that 31
statistical tests over the subject population can also be carried out. Another interesting direction 32
is to develop a traffic prediction model that can provide reasonably accurate predictions of the 33
experimental results. Such a model needs to explicitly work in a stochastic network, capture 34
travelers’ risk attitudes, strategic behavior, and learning behavior. 35
36
ACKNOWLEGEMENTS
37
This study is funded by the US Department of Transportation through the Region 1 38
University Transportation Center. We thank Moshe Ben-Akiva for the discussion on bootstrap 39
methods, and Ryan Pothering for helping conduct the experiments. 40
1
REFERENCES
2
1. Ben-Akiva, M., A. de Palma and I. Kaysi (1991). Dynamic network models and driver 3
information systems. Transportation Research Part A 25(5): 251-266. 4
2. Erev I., Barron, G. (2005), On adaptation, maximization and reinforcement learning among 5
cognitive strategies, Psychological Review, 112(4): 912-931. 6
3. Abdel-Aty M., Kitamura R., Jovanis P. (1997), Using stated preferences data for studying the 7
effect of advanced traffic information on drivers’ route choice, Transportation Research 8
Part C, 5 (1): 39-50. 9
4. Avineri E., Prashker, J.N. (2006), The impact of travel time information on travelers’ learning 10
under uncertainty, Transportation, 33(4): 393-408 11
5. Ben-Elia E., Erev I., Shiftan. Y. (2008), The combined effect of information and experience 12
on drivers’ route-choice behavior, Transportation 35:165-177. 13
6. Ben-Elia E. & Shiftan Y. (2010). Which road do I take? A learning-based model of route 14
choice with real-time information, Transportation Research Part A, 44: 249-264. 15
7. Selten R., T. Chmura , T. Pit ,S. Kube , M. Schreckenberg (2007), Commuters route choice 16
behavior, Games and Economic Behavior, 58: 394– 406. 17
8. Bogers E.A.I, Viti F, Hoogendoorn S.P. (2006). Joint modeling of ATIS, habit and learning 18
impacts on route choice by laboratory simulator experiments, Transportation Research 19
Record 1926, 189-197 20
9. Abdel-Aty, M. A. and Abdalla, M. F. (2006). Examination of multiple 2 mode/route-choice 21
paradigms under ATIS, IEEE Transactions on Intelligent Transportation Systems 7(3): 22
332–348. 23
10. Chorus, C. G., E. J. E. Molin and B. van Wee (2006). Use and Effects of Advanced Traveller 24
Information Services (ATIS): A Review of the Literature. Transport Reviews 26(2): 127-25
149. 26
11. Bonsall, P. (2004). Traveller behavior: Decision-making in an unpredictable world. Journal 27
of Intelligent Transportation Systems, 8:45-60. 28
12. Razo, M and Gao, S (2010). Strategic Thinking and Risk Attitudes in Route Choice: A Stated 29
Preference Approach. Transportation Research Record. Accepted. 30
13. Tian, H., S. Gao, D. L. Fisher and B. Post (2010). Route choice behavior in a driving 31
simulator with real-time information. Submitted to the 90th Annual Meeting of the 32
Transportation Research Board. 33
14. Mahmassani, H. S., G. L. Chang and R. Herman (1986). Individual Decisions and Collective 34
Effects in a Simulated Traffic System. Transportation Science 20(4): 258-271. 35
15. Mahmassani, H. and Liu, Y. (1998) Dynamics of Commuting Decision Behavior under 36
Advanced Traveler Information Systems, Transportation Research C, 7(2):91- 107. 37
16. Iida, Y., T. Akiyama and T. Uchida (1992). Experimental analysis of dynamic route choice 38
behavior. Transportation Research Part B 26(1): 17-32. 39
17. Morgan, J., H. Orzen and M. Sefton (2009). Network architecture and traffic flows: 40
Experiments on the Pigou-Knight-Downs and Braess paradoxes. Games and Economic 41
Behavior 66:348-372. 42
18. Rapoport, A., T. Kuglar, S. Dugar and E. J. Gisches (2009). Choice of routes in congested 43
traffic networks: Experimental tests of the Braess Paradox. Games and Economic 44
19.Ramadurai, G. and Ukkusuri, S.V. (2007). Dynamic Traffic Equilibrium under Information: 1
An Experimental Network Game Approach. Transportation Research Record. Vol. 2029, 2
pp.1-13 3
20. Kraan M.,van der Zijpp N., Tutert B., Vonk T., van Megen D. (1999), Evaluating 4
networkwide effects of variable message signs in the Netherlands, Transportation 5
Research Record, 1689, 60-66 6
21. Kahneman, D. and A. Tversky (1979). Prospect theory: An analysis of decision under risk. 7
Econometrica. 47: 263-292. 8
22. Tversky A. and Kahneman, D. (1992). Advances in Prospect Theory: Cumulative 9
Representation of Uncertainty. Journal of Risk and Uncertainty 5:297-323 10