A New Area based Algorithm for Traffic Sign Board
Detection and Classification by SVM Approach
Y. D. Chincholkar
Department of E&TC SCOE, Pune Maharashtra, India
Ayush Kumar
Department of E&TC SCOE, Pune Maharashtra, India
ABSTRACT
This paper proposes a new approach for traffic sign board detection and also describes the SVM approach for the shape recognition into different classes of traffic sign boards. First, the object is detected using based analysis. The area-based analysis is performed on the video frames area-based on the circularity parameter. The test input for the project is video obtained from a camera mounted on a vehicle. Before that, the image pre-processing techniques are applied to improve the quality of the image and to convert it into a binary image. Then the properties of the image frame have been obtained for further analysis. The feature generation is done to get the principal component for the classification of objects. Then the machine learning algorithm is applied to the dataset classification purpose. The classification into different classes (unsupervised shape recognition) is done with the SVM approach.
General Terms
Detection Algorithm, Feature Generation, Classification
Keywords
SVM – Support Vector Machine, Circularity, Unsupervised Shape Recognition
1.
INTRODUCTION
Traffic sign board detection and recognition system is an exciting topic for the advanced driver assistance and automatic vehicles. The system collects signification information on real time for the drivers to reduce their efforts in safe driving in the driving environment. The system is also essential for the automated road maintenance perspective. Now a day’s each road should be checked periodically for any missing or damaged signs, as such signs pose safety threats. The task of manually checking the state of every traffic sign is long and tedious, and it may lead to human error. By using techniques of computer vision, the task could be automated and therefore carried out more frequently, resulting in greater road safety. There are many features of the object like color, symmetry, aspect ratio, shape and others. Shape recognition is a prominent computer vision domain for recognizing image objects from their shape information in real time scenarios. Thus a hybrid system is needed that will help the drivers with the safety information while driving and also for driverless vehicles. There are many potential difficulties in detecting because of the complex environment and scenes around them. Complications are occlusions, climatic conditions and local light variations and not proper lighting in the night time. Recent increases in computing power have brought computer vision to consumer-grade applications. As computers offer more and more processing power, the goal of real-time traffic sign detection and recognition is becoming feasible. Some new models of high-class vehicles already come equipped
detection and identification of certain classes of traffic signs. The detected regions in the first phase are recognized in the recognition phase. Object recognition algorithms generally involve two essential steps; feature extraction and classification. Feature extraction methods focus on calculating the crucial features of the objects that are invariant under different conditions. And classification methods aim at distinguishing different feature patterns and classifying the objects accurately.
2.
LITERATURE SURVEY
Dongdong [1] uses a detector that includes classifiers to classify the traffic sign board. The operation is performed in various stages for the system evaluation and the tracking purpose. ElMargae Samira [2] used a Discrete Cosine Transform (DCT) to extract a global feature of a traffic sign, and similarly, Local Binary Pattern (LBP) is to obtain local descriptors. Classification of the features is done by the support vector machine (SVM). Ce Li [6] applied automatic segmentation into the homogenous region for merging based on similarities and then used morphological operators and boundary detection algorithm to extract the traffic sign board. They have used markers for the object and the background to obtain the traffic sign board.
Truong [7] had designed traffic sign board detection and recognition system on the ARM in three steps that are pre-processing, detection and recognition. Pre-processing includes chromatic color segmentation and refinement. They have the shape matching based on moment invariant and recognition by training the support vector machine and classify them. Artificial neural network (e.g., [15]) is another popular method used for optical character recognition in many applications. Road and traffic signs have been designed to be principally distinguishable from the natural or human-made backgrounds. They are characterized by many features make them recognizable concerning the environment.
Harini S [16] used background subtraction, object labeling and morphological operation for the detection of the red object for pre-processing and component extraction. Template matching using correlating coefficients is applied to recognize the detected object. Loy and Barnes [17] presented an algorithm that identifies polygon shaped signs (e.g., square, triangle, octagon) using radial symmetry detector. The accuracy of these shape based methods depends a lot on the edge operators being used by them, and these edges are vulnerable to noisy pixels.
3.
PRE-PROCESSING
27 scaled image is used for edge detection in the next step of
[image:2.595.56.281.97.232.2]pre-processing.
Fig 1: Color and Gray Scale Image
[image:2.595.317.543.277.405.2]The edges of the images are extracted to get the boundaries of the objects on that video frame. Once boundaries are obtained, and then find the different properties of the object. This step improves the quality of the image; also conversion is done into one plane gray scale so that it will take less time in processing when the detection algorithm is applied.
Fig 2: Gray Scale Image with edges
4.
DETECTION METHODOLOGY
Under-detection stage pre-processed image frame is used. Firstly, Contours of the image frame has been found then the area based algorithm has been applied to get the desired object. For the object detection, the circularity is calculated based on the derived formulae given in equation (2). If the circularity in the defined range then objects is detected and passed it to the next stage for the recognition.
4.1
Finding ROI/Contours
Once the Canny edge operator detects the edges, and then the boundaries of the object have found in that frame. Then region properties of the processed image frame are obtained. Once the borders are detected, the area and perimeter of the objects on that contours have been found out.
4.2
Proposed Area Based Algorithm
The circularity of the object is how close the object to a circle. The below mathematical equation is used to find the value of circularity. A circle is the most circular object. It is also the most compact in the sense that it encloses the most area for a given perimeter. There are many applications in which you want to say just how compact or circular an object is. One standard measure referred to in different places as circularity, compactness and shape factor compares the perimeter of a shape to the area it contains
(1)
The inverse of circularity is used for the area based analysis of the shape detection. In the area-based analysis, the below formulae inverse of equation one has been utilized.
4 (2)
The area-based analysis is selected for our analysis as other approached consumes much time in processing compare to this in real time. Circular, rectangular and triangular traffic sign boards are tried for detection with this analysis and experimental results are obtained successfully. This approach is used for the detection of traffic sign boards because the output of the detection step is passed to next part for the feature classification in different classes with a faster rate. This approach improves the recognition with reasonable accuracy because area based algorithm takes less time in processing compare to Hough transform. Experimental results obtained are shown in fig 3, fig 4 and fig 5 with area-based approach using Matlab software on I3 processor laptop with 4 GB RAM.
Fig 3: Triangular Traffic Sign Board Detection using the area-based approach
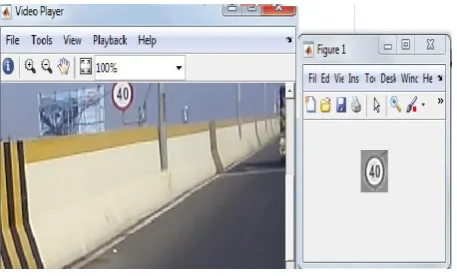
The below experimental results are obtained using area-based approach on Matlab software running on the system having I3 processor and 4GB RAM for circular traffic sign board detection with some assumptions that have been mentioned in subsection 4.3.
Fig 4: Circular Speed Traffic Sign Board Detection using the area-based approach
[image:2.595.56.283.310.450.2] [image:2.595.317.546.493.631.2]Fig 5: No Turns Traffic Sign Board Detection using the area-based approach
4.3
Performance Evaluation
[image:3.595.70.266.383.465.2]The Area-based approach has high detection rate and accuracy for the circular, triangular and rectangular traffic sign boards detection that have been experimented with the real-time video sequences taken by the camera mounted on a vehicle. Statistical analysis has been done to define a circularity range for the objects detection. To get the range, rectangular, triangular and circles are statistically applied to the detection algorithm for the observation.
Table 1: Statistical analysis of the circularity range for object detection
Shapes Range
(perimeter2/4*pi*area)
Circle 0.91-1.18
Rectangle 1.38-1.54
Triangle 1.54-1.75
The results obtained in fig 3, fig 4, fig 5 with the assumption of the excellent lightning condition and proper climatic condition. If the different atmospheric condition is considered like the occlusions, severe weather conditions, night time then for that scenario, the system has to be trained more to detect and recognize the traffic sign boards to avoid false detection.
5.
DATABASE PREPARED WITH
TRAINING DATA AND TO GET
FEATURE VECTOR
The different traffic sign board is classified into different classes for the training and to create a database. The different classes are informative, No Parking, No Turns, Parking, Turns, Speed. Multiple copies of one traffic sign boards have been put for the training. Once the database has been created successfully for training, then feature generation is done.
Feature generation can be done with statistical analysis or principal component analysis or Independent component analysis. Principal component analysis (PCA) is selected to get the similar feature into one vector for further steps. Under PCA analysis principal component is obtained, and first principal component has the highest possible variability. The principal components are eigen vectors of the symmetric covariance matrix. The feature of the object is achieved under one class from multidimensional to minor dimension. The
below steps have been performed for the recognition from training for the SVM till classification.
(i) First, different datasets of traffic sign boards are created, for example, five datasets have been taken for recognition depends on the feature of traffic sign boards. They are mentioned as below from 1 to 5. 1)Informative,2)no_turns,3)number_plate,4)speed and 5)turns
(ii) For each of these training set is created and for creating the training set first read the different datasets.
(iii) In the path for Dataset give the path location for these different dataset folders.
(iv) Resize of the images is done and then the cell array will be created for the dataset.
(v) Now the next step is to create a training set process. (vi) Read all the files and then concatenate the image and
later extract all its information.
(vii) Next, images are required to scale so resize operation is required to perform. While performing scaling operation, images need to convert to gray scale, so convert the images to gray scale if they are not already converted and then again resize it.
(viii) Now creating the training set, calculate the PCA of the images and store in a temporary variable.
(ix) Take the first row of the matrix where PCA data has been stored as the feature vector for classification purpose.
(x) Then different training sets has been created which are 1)training_informative,2)training_no_turns,3)training_n umber_plate,4)training_speed and 5)training_turns. Then label of the different sets needs to be done for classification purpose.
(xi) Train the SVM for different training sets using ‘svmtrain’ function.
(xii) After this, read the video and segment the different traffic signs from the video.
(xiii) Calculate their PCA.
(xiv) SVMclassify function is used to classify the traffic sign boards in different classes.
6.
FEATURE SELECTION AND
CLASSIFIER DESIGN
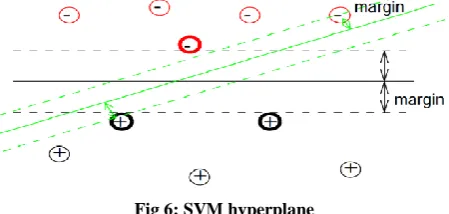
SVM classifier is used to classify the data into different classes after the detection and feature generation. SVM classifies the data by finding the best hyperplane that separates all data points of one class from those of other class. The best hyperplane is with the most significant margin between the two classes.
[image:3.595.316.541.643.750.2]29 The data for training is a set of points (vectors) ui along with
their categories vi. For some dimension d, the ui∊ Rd, and
the vi = ±1. The equation of a hyperplane is as below.
<w,u> + b = 0 (3)
Where w ∊ Rd, <w,u> is the inner (dot) product of w and u, and b is real. The following problem defines the best separating hyperplane. Find w and b that minimizes ||w|| such that for all data points (ui,vi),
vi(<w,ui> + b) ≥ 1 (4)
The support vectors are the xi on the boundary, those for
which vi(<w,xi>+ b) equals 1. For the convenience to
minimise, the problem is usually given as the equivalent problem of minimising<w,w>/2. This is called a quadratic programming problem. The optimal solution (ˆw,ˆb)enables the classification of a vector z as follows:
class(z)=sign(Eˆw,zF+ˆb) (5)
Then SVM has been trained using the svmtrain function, and it returns a structure, containing information in different fields about the trained support vector machine (SVM) classifier. Training is a matrix of training data where each row corresponds to an observation or replicates and each column corresponds to a feature or variable. Group indicates grouping variable or a cell vector of strings representing a class label. The below MAT file has been obtained after training for No Turns class of traffic sign boards.
Fig 6: Mat File for No turns class training
The below result has been obtained after SVM classification on the Matlab platform when the input for the implementation
[image:4.595.314.543.71.242.2]is video captured by a camera mounted on a vehicle.
Fig 7: Recognized traffic sign board with the class name
7.
IMPLEMENTATION ON OPEN CV
[image:4.595.315.543.420.527.2]The proposed algorithm is implemented on an OPEN CV platform for the faster processing in recognition on the Ubuntu operating system with C++ in real time. It has an excellent response time in classification using support vector machines, and it can process frames up to 35 frames per second. This proposed methodology can be implemented on Raspberry Pi with a camera mounted on vehicles to capture the road scenes. The below experimental results have been obtained on a Ubuntu 17.10 operating system using Open CV software.
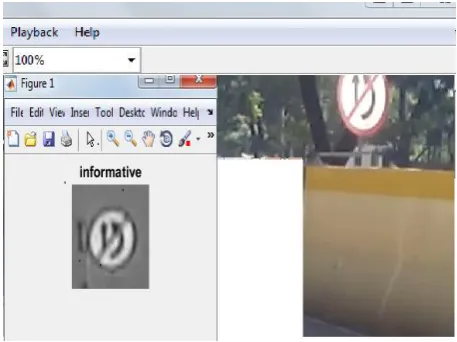
Fig 8: Recognized No Turns Traffic Sign board with the class name of the traffic sign board
[image:4.595.318.544.579.730.2]The results in figure 8 and 9 are obtained when the traffic sign board detection and recognition steps have been implemented on open CV platform with better response time for classification in real-time processing. The below experimental results are obtained on the system having Ubuntu 17.10 operating system, OPEN CV software with an I3 processor and 4GB RAM.
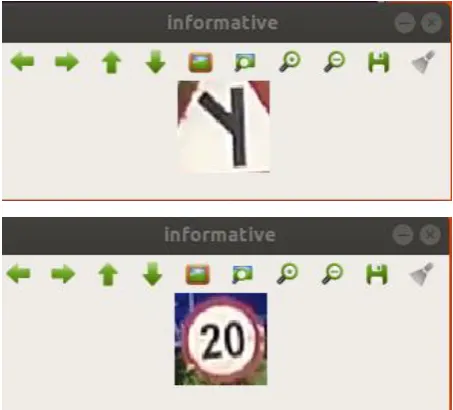
Fig 10: Recognized Traffic Sign Boards of informative class
8.
CONCLUSION AND FUTURE SCOPE
The proposed system can be used to provide the safety information for the driving assistance also it can be used for driverless vehicles. The inverse of circularity is utilized as derived formulae for the shape detection of different shapes traffic sign boards. The area-based analysis based on circularity provides faster detection rate with high accuracy that helped in the recognition stage with less computation time. The area-based approach is efficient for the unsupervised shape recognition when the detected shape is passed to the classifier. Firstly, the database has been trained with the traffic sign board’s images in different classes. SVM classifier is designed to classify the object in different classes based on the feature. The experimental results obtained by the area based algorithm, have excellent detection rate up to 98% with the assumption that there should be appropriate climatic and lightening condition. False detection was also observed that kind of detection is shown under an unknown class. SVM can classify the detected object in the respective six output classes but the response time is slow for the classification in Matlab software. The experimental results have proven that system has fast response and less computation time with the proposed area based algorithms when it is applied on Open CV software for the detection and recognition in real time.
9.
REFERENCES
[1] Dongdong Wang, XinwenHou and Cheng-Lin Liu, 2015. Traffic Sign Detection from Video: A Fast Approach with Tracking.
[2] El Margae Samira, AitKerroumMounir and Fakhri Youssef, 2014. Multi-stage fusion of local and global features based classification for traffic sign recognition.
[3] Shyamosree Pal, ParthaBhowmick, ArindamBiswas, 2011. FACET: A Fast Approximate Circularity Estimation Technique. IIT Kharagpur, India.
[4] TamasFerenczBente,SzilviaSzeghalmy, Attila Fazekas, 2018. Detection of lanes and traffic signs painted on IEEE international conference on Future IoT.
[5] Wiley Online Library.
[6] Ce Li, YalingHu, 2011. Salient Traffic Sign Detection Based on Multiscale Hyper complex Fourier Transform on 4th International Congress on Image and Signal Processing.
[7] Truong QuangVinh, 2015. Real-Time Traffic Sign Detection and Recognition System Based on Friendly ARM Tiny4412 Board on International Conference on communication, management, and telecommunications.
[8] Jim-Yang Chen, Peikun Yang, 1993. Shanghai Urban Traffic Route Guidance System on Vehicles Navigation and Information Systems Conference.
[9] Angela Tam, Hua Shen, Liu and Xiaoou Tang (2003). “Quadrilateral signboard detection and text extraction.” CISST, pp. 708-713.
[10] Juan J. Rodriguez, Cesar Garcia-osorio and Jesus Maudes (2008). “License plate number recognition – New Heuristics and a Comparative Study of Classifiers.”International Conference on Informatics in Control, Automation and Robotics – ICINCO, pp. 268-273
[11] Tran DucDuan, Tran Le Hong Du, Tran VinhPhuoc, Nguyen Viet Hoang (2005). “Building an Automatic Vehicle License-Plate Recognition System.” In Proc. Intl. Conf. in Computer Science (RIVF), pp. 59-63.
[12] F. Zernike, Physica, Vol. 1. P. 689, 1934.
[13] A. Broumandnia, M. Fathy (Dec. 2005). “Application of pattern recognition for Farsi license plate recognition.” ICGST International Conference on Graphics, Vision and Image Processing (GVIP-05).
[14] Shyang-Lih Chang, Li-Shien Chen, Yun-Chung Chung, and Sei-Wan Chen (2004). “Automatic License Plate Recognition. IEEE Trans. on Intelligent Transportation Systems”, Volume 5, No. 1, pp. 42-53.
[15] J. R. Parker and PavolFederl (1995). “An approach to license plate recognition.” Laboratory for Computer Vision, Computer Graphics Laboratory, University of Calgary.
[16] Harini S, Abhiram V, Rajath Hegde and Samarth Bharadwaj, 2017. A smart driver alert system for vehicle traffic using image detection and recognition techniques on a 2nd IEEE international conference on recent trends on electronics and communication technology.