Multi-regional fuzzy control for a pH neutralisation
process.
NORTCLIFFE, Anne <http://orcid.org/0000-0001-6972-6051>
Available from Sheffield Hallam University Research Archive (SHURA) at:
http://shura.shu.ac.uk/14463/
This document is the author deposited version. You are advised to consult the
publisher's version if you wish to cite from it.
Published version
NORTCLIFFE, Anne (2001). Multi-regional fuzzy control for a pH neutralisation
process. In: EUSFLAT Conference 2001, Leicester, 5-7 September 2001. 295-300.
Copyright and re-use policy
See
http://shura.shu.ac.uk/information.html
Sheffield Hallam University Research Archive
Multi-regional Fuzzy Control for a
pH Neutralisation Process
A. L. Nortcliffe
Department of Electronics and IT, School of Engineering,
Sheffield Hallam University, Sheffield, S 1 1 WB
Abstract
1
Introduction
pH control is the process of adding acid or base to opposing solutions aiming to achieve a solution of pH 7, defined as neutral solution. The function of the controller is to achieve a neutral output of the system. This in itself is not an easy problem to solve as pH control of a neutralisation process is a difficult non-linear control problem. This is largely due to the inherent non-linear behavior of pH measurement, and is further complicated by variable time delays in the process. The relationship between pH measurement and volume ratio of acid to base is non-linear and characteristically described as an S-type curve relationship. Therefore the pH control problem can be considered as posing three different regions of sensitivity for control. For this reason alone conventional methods of control provide unsatisfactory control results, as can only truly accommodate one region scenario.
This paper presents both simulated and practical results of applying a unique fizzy logic method to control the pH process, utilising the novel concept of mutli-regional PD type fuzzy logic control. Each region of sensitivity is assigned a unique fuzzy logic model and set of rules. The results are placed in context with the results of conventional means and traditional PD type fuzzy logic control combined with a variable transformation technique. The results demonstrate the accuracy of the methods in achieving the objective, that is an output of pH
7
Fuzzy logc control proposes an alternative method of control for systems where the dynamics of a system cannot be truly defined in mathematical terms. In the case in point pH control is a difficult non-linear problem, that can be defined mathematically for known influents into the system, but for unknown any mathematical model used is not true representation of the systems inputs. This is characterised by the fact that strong acid input has different non-linear characteristics to that of weak acid influent, as shown in Figures 1 and 2,
respectively. This is further compounded when weak acid and strong acid influents are combined, the non-linear characteristics change again and are interdependent on the volume and concentration ratio of weak to strong acid within the influent. Therefore the pH control problem lends itself to fuzzy logic control. Fuzzy relational model-based controller has been researched as a solution to the problem of pH control, [I], opposed to the Mamdani fuzzy logic control approach. The Mamdani approach is heuristic knowledge dependent, the knowledge engineering can be time consuming for process applications. The fuzzy relational model approach was successful yielding an improved performance, but this approach is more complex than the Mamdani approach. - -
The focus of this paper is on revisiting the Mamdani approach applied to this problem of pH control, but in conjunction with variable transformation technique. The concept and principles of applying PD fuzzy logic control to process control applications were adopted from [2]. The strategy actually implemented built upon the documented results in [3] noting and adhering to the advice of 1 .
conventional fuzzy logic controller to the pH process, but also an improved method using multi- region fuzzy logic controller as described in [4].
4 Acid region
F
0 1 I I I I
0 0.5 I 1.5 2
Ratio o f atkali to acid concentration
Figure 1: Strong acid and base titration (process of adding base or acid solution to the opposing solution, in this example base was added to acid)
I I I
0 0.5 I 1.5 2
[image:3.594.107.252.114.233.2]Ratio ofalkali to acid concmtration [B]/[&]
Figure 2: Titration curve of Weak Acid and Strong Base (Strong base solution was added to weak acid
solution)
Figures 1 and 2 depict the titration of different acid solutions with a base, each of these plots illustrate that once a titration of an acid with a base has been initiated:
1. The titration curve of an acid and strong base can be realistically described as having three distinct regions, (see Figure 1)
2. Equally the titration curve of a weak acid or strong and weak acid mixtures with a strong base can be described as having three regions, (see Figure 2)
Each of these regions has different characteristics, so it is plausible that each region requires a different fuzzy control strategy. Each region requires a different control outcome; for example the volume of base required to be added to acid solution in the acid region is approximately ten fold in quantity to that required by acid solution close to neutrality. Experience of operating and controlling the process to the point of neutrality has indicated the need for a
controller that can accommodate different input conditions, i.e. provide different type of accurate control action as and when required. This methodology uses an auxiliary process variable to indicate which region the system is operating within, in order to apply the appropriate control strategy. The multi-regional method has been developed to control an influent's (operating about the acid and neutral region) pH to 7.
The fuzzy controllers proposed were used in conjunction with variable transformation approach, opposed to the controller acting upon pH process variables that is the error (pH) and rate of change of error (pWmin). The system uses the anti-log of pH measurement; pseudo hydrogen ion concentration
(pseudo [H']) process variables. This anti-log technique is based upon work first reported in [5] and forms the basis of research into developing pH ,
control strategy to control pH of chemical effluent documented in [6]. The principle of the anti-log technique is that since the fundamental variables driving chemical reactions are concentrations rather
than pH per se, the synthesise pseudo concentration
variables is a more appropriate variable for which the control strategies should act upon. The other advantage of the technique is that it removes the non-linearity at source and yields an easier to handle linear signal.
2
Conventional Fuzzy Controller
[image:3.594.76.269.267.409.2]The output of the fuzzy controller can be expressed;
where
op23 the control output of the fuzzy controller (valve position) (%)
Fop23 the outcome of the fuzzy logic process
(%)
bi23 bias of the controller, for simulation purposes computed to be approximately 20% form normal conditions appIied to model of the process
[image:4.594.329.546.254.703.2]Figures 3 and 4 and Table 1 depict fuzzy set ranges and rule base as used by version 1 of the fuzzy controller.
Figure 3: Input fuzzy sets
[image:4.594.88.288.293.569.2]Table 1: AIC23 rule base
Figure 4: Fuzzy output adjustment set
where
e23 the feedback error (mg/m3)
de23 the derivative of the feedback error (mgrr~-~s-')
The objective of the fuzzy controlIer is to achieve zero feedback error and derivative feedback error.
Version 2 fuzzy controller investigates setting the fuzzy output adjustment range set to Fop23min, Fop23max to -100% and 100% respectively.
3
Multi-regional Fuzzy Controller
This paper proposes that a multi-regional fuzzy logic controller would provide a greater degree of accuracy in controlling the output of the system to the point of neutrality. In view of the very steep nature of the central region of the pH titration (S- type) curve. Essentially a controller that can accommodate the sensitivity required about the point of neutrality, but also able to react quickly and accurately to gross feedback errors fall outside this region of sensitivity. The proposed multi-regon fuzzy controller is based upon fuzzy sets depicted in Figures 6 to 10, and Table 1 is the generic rule base for each region.
Region 1
Figure 5: Region 1 input fuzzy sets
*w
Figure 6: Region 1 fuzzy output adjustment sets
Region 2
Figure 7: Region 2 input fuzzy sets
Region 3 output pH is well within acceptable limits for discharge of effluent (6 to 9 pH).
[image:5.595.322.552.95.215.2]Figure 9: Region 3 fuzzy input sets
Figure 10: Region 3 fuzzy output adjustment sets
4
Results and Discussion
The fuzzy logic control methodologies were applied to a system consisting of varying flow rate of a strong acid influent stream partially neutralised by strong base (thus is also varying in pH for empirical results). The output of the fuzzy controller is valve position required to induce the required volume of strong base to neutralise the acid influent.
Figure 11 illustrates the results of simulated study of the process and indicates that the fuzzy control of about the point neutrality is best achieved using fuzzy controller version 2, as least when disturbed by 30% change in acid stream flow rate. The percentage change in acid flow rate is based upon maximum permissible acid flow rate empirically measured, approximately 1.9 llmin. These results indicated that version 1 conventional fuzzy controller should not be carried forward to experimental implementation and investigation, as its output response is not within the acceptable limits of effluent discharge 6 to 9 pH.
,- - -resulk of Fuuy
I
I
Conlrol vl
--- resulk of Fuuy
Control v2
5.5
. . . . ... resulk of Multi-
5 .O I region Fuuy
Control o? ?, $9 ,? b? ',? $ ?, ?, 9?,o?
Time (min)
Figure 1 1: Matlab simulated response of the system to 30% step change in acid flow rate at 5 minutes.
A T 2 0P (pH)
- A m (pH)
-- Setpint AT23 (pH)
Time
Figure 12: Version 2 Fuzzy controller response to approximately 5%, 26% and 37% changes in acid flow rate and changes in the influent's pH (AT20) is
within recommended discharge guidelines 6-9 pH.
Upon closer examination of the output, its trajectory is that of a saw-tooth. The output signal generated is similar to the output of the electrical resistor capacity circuit with a square wave voltage supply, (see Figure 13), where the saw tooth output signal is due to charging and discharging of the capacitor. In this process case the saw tooth is induced by the triangle fuzzy controller switching from small valve output setting to large output setting, charging the system with base (greater base to acid ratio of inputs) and then decaying due to greater acid to base The imp1ementation of the ratio of inputs. The fuzzy controller essentially only controller utilises a bias that is calculated and utilises the outside fuzzy sets inducing odoff
in using a of the 'Pstream control, the adjustment of the semngs rate of change 'ystem to predict pseudo
[&I
to this 'Ystem, of the emor fuzzy sets should promote improved whereas in the simulated case the bias was pre- control. [image:5.595.330.540.257.398.2]Figure 13: Capacitor circuit
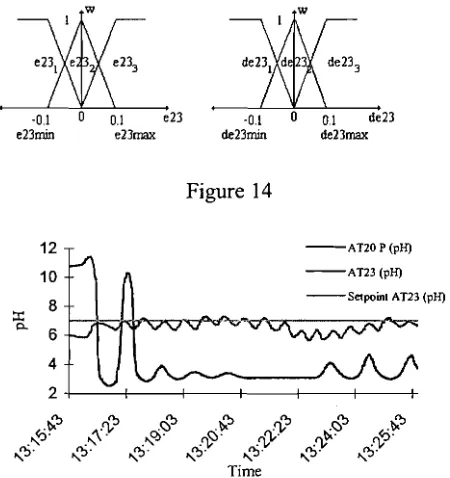
The revised tuned input fuzzy sets, Figure 14, yields a smaller oscillating and smoother output pH response, (see Figure 15). The shape and size of the output signal are an improvement on the previous fuzzy controller settings, but the revised rate of change of error fuzzy settings are too small for large acid flow rates. At large acid flow rates, results within the time span 13:22:23 and 13:24:00, it was observed that the output of the fuzzy controller is insufficient to restore the pH of the system to neutralisation and creates a positive offset output. These results illustrate the inadequacy of the revised fuzzy controller. Also, the possible advantages of applying multi-regional fuzzy control, that is a controller consisting of two coarse fuzzy controllers to ensure quick restoration to the setpoint upon the inducement of large output errors and one fine fuzzy controller to maintain the system at the setpoint.
Figure 14
12 -
-
AT20 P (pH)A n 3(pH)
8 -- S n p o i n l AT23 (pH)
Time
Figure 15: Revised Fuzzy controller response to approximately 26% and 36% changes in acid flow rate and changes in the influent's pH (AT20).
light of the empirical results of the conventional fuzzy controller. The generic rule base is still based upon Table 1.
Region 1
Figure 16: Region 1 input fuzzy sets
*W
Figure 17: Region 1 fuzzy output adjustment sets
Region 2
Figure 18: Region 2 input fuzzy sets
Figure 19: Region 2 fuzzy output adjustment sets Region 3
Figure 20: Region 3 fuzzy input sets
[image:6.596.131.245.71.132.2] [image:6.596.74.299.405.644.2]Figure 21 : Region 3 fuzzy output adjustment sets
Region 1 fuzzy controller is applied if the output error is less than -0.1 (mg/m3) else region 2 is applied. If the output is greater than -0.1 (mg/m3), but less than +O. 1 (mg/m3) else region 3 is applied.
The multi-regional controller is a promising method of control as an improvement on the revised fuzzy controller, (see Figure 22). It is important to stress here that the oscillations evident are very small and about pH 7 (the point of neutrality ) the variation is only marginally (f0.5 pH). Realistically the system can be considered to be neutral. In contrast to the revised conventional fuzzy controller, upon closer inspection of Figure 15 the excursions are marginally larger and the controller is unable to accommodate large acid flow rates.
A T 2 0P (pH)
12
-AT23 (pH)
10
----Setpoint AT23 (pH)
8 I,
6
4
2
Time
Figure 22: Multi-region Fuzzy response to approximately 26% and 47% changes in acid flow
rate and input stream's pH.
5
Conclusion
The multi-regional fuzzy controller shows the most satisfactory output. The output is consistently approximately pH 7, despite considerable disturbances in the acid flow rate and pH of the influent. Though at present in some areas it is acceptable to discharge effluent between pH 6 to 8, in others tighter controls apply. A controller that can achieve consistent results, producing an output of pH 7 would be warmly welcomed. The results of the mutli-regional fuzzy controller indicate that this
methodology is a promising solution to the non- linear problem of pH control. This method therefore warrants further investigation, i.e. test the robustness of the method to new conditions of acid flow rate and pH. Also, investigate the effectiveness of the method in neutralizing a weak acid influent and an influent consisting of a mixture of weak and strong acids.
Acknowledgements
J. Love for developing the variable transformation technique used in conjunction with the controllers presented in this paper.
References
[I] Sing C., and Postlethwaite B., "pH Control: Handling Nonlinearity and Deadtime with Fuzzy Relational Model-Based Control", volume 144, pages 263-268, 1997
[2] Ragot J., and Lamotte M., "Fuzzy Logic Control", International Jounral of Systems Science, volume 24, pages1 8254-1 848, 1993
[3] Majlessi, A., "Fuzzy l o g c control of pH process," MPhil Thesis, Manchester University, 1994
[4] Qin, S. J., and Borders, G. "Multiregion fuzzy logic controller for nonlinear process control."
IEEE Transactions on Fuzzy Systems, volume 2, pages 74-8 1, 1 994
[5] Love, J. "Design of a pH Control System for Effluent Treatment." SCSC Conference, Baltimore, pages 1 173-1 180, 1991
[6] Nortcliffe, A., "Anti-logging Approach to pH Control of Chemical Effluent." Phd Thesis, University of Shefiield, submitted March 2001
[image:7.594.76.292.390.503.2]