Behavioural, Management and Social Sciences Department of Psychology of Conflict, Risk, & Safety
Does it show when someone has hostile intentions?
A replication of Wijn et al. (2017)BACHELOR THESIS
Julie Charlotte Müller s1843907
1st supervisor: Dr Ir. Peter W. de Vries 2nd supervisor: Dr Margôt W.M. Kuttschreuter
Abstract
The study of Wijn et al (2017) concluded that environmental cues and cognitive load can
increase the possibility of correctly detecting hostile intentions. The current study aims to
replicate these findings, after critics doubted the validity of these results. Additionally,
behavioural indicators accompanying hostile intentions are researched to gain insight into how
much information is needed to be able to detect these malintentions as well as which specific
factors are used for the decision. Methods 23 participants watched the 143 videos of the original study, followed by a questionnaire regarding the indicators of deception. These results were
analysed with a multiple response analysis, coding of the open question as well as a factorial
repeated measurement ANOVA. Results The environmental cue or cognitive load had no main effect or interaction effect on the ability of detection. Contrary aspects were found between
indicators of the innocent condition and the hostile intention. As behavioural indicators,
participants used the body language, facial expressions, walking style, looking behaviour and
use of hands or how the person handed the bag. Discussion Since it was not possible to replicate the findings of Wijn et al. (2017) it is questionable how reliable environmental cues and
cognitive load are as methods to improve the detection accuracy of the participants.
Implications from this study are that more insight needs to be gained into detection since it is a
crucial topic to fight against terrorism and the importance of replication is highlighted.
Table of Contents
Does it show when someone has hostile intentions?...……….…...…...3
Theoretical Framework………....…..4
What happens when we deceive?………...6
Present Research………....………8
Method……….……….………...9
Design & Participants………....…9
Materials………...……10
Stimulus Material Questionnaire Procedure………..…12
Analysis………...….13
Quantitative Part Qualitative Part Results……….……….………..15
Quantitative Study………15
Concentration Hits and Misses Detection of hostile intent Qualitative Study………..17
Multiple Response Analysis Open Question Discussion………...……….……...22
Main findings……...……….………22
Conclusion Specific Points Strengths & Suggestions...………26
Reference List………...……….29
Appendices………...33
Appendix A: Informed Consent………33
Appendix B. Instruction………...….35
Appendix C. Questionnaires……….36
Appendix D. Behavioural Indicators……….37
Appendix E. Debriefing………...40
Appendix F. Coding Table………....41
Does it show when someone has hostile intentions?
Terrorism is a rising issue which gained a lot of media attention during the last years.
People are afraid of the terrorist attacks that happen all around the world. According to the
Global Terrorism Database (2018), the number of terrorist incidents had its highest point in
2014 where worldwide around 16.000 terrorist attacks occurred. Only eight years before, the
number was about one quarter (4.805), which illustrates its rise. A recent study conducted in
September 2018 by Statista analyses which countries worry the most about terrorist attacks,
estimating France, with 27% and Germany with about 24% in the top five of the rankings of 28
different countries.
To minimise the risk of such terrorist attempts, security programmes have been
developed that try to avoid such events by filtering out people that have hostile intentions. An
example of such a method are the behaviour-detection officers working at airports all over the
United States, as described by Weinberger (2010). A programme called Screening Passengers
by Observation Technique (SPOT) is the basis of the work of about 3.000 officers. They are
trained to identify people having hostile intentions to detect and eliminate possible threats to
the safety of other passengers. For the scientific basis of SPOT, Paul Ekman's research about
analysing facial expressions is used (Weinberger, 2010). SPOT is not the only existing
programme; others are also used at airports as for example the Future Attribute Screening
Technology (FAST) which monitors the vital signs of passengers to spot mal intentions.
Nevertheless, as Weinberger (2010) highlights these programs lack scientific evidence and
research is not far enough to speak of true detectors of hostile intentions.
So, behavioural analysis methodologies are far from reliable. When looking at the
research conducted in the field of determining deception, it becomes apparent that detecting
hostile intentions is not as simple as TV series like for instance ‘Lie to me’ tell us. Instead of
being able to judge people simply by their face, it is far more difficult to figure out if a person
is hiding something. Accordingly, there is a gap in research that is aimed to be filled to some
extent by this study. Here, the study of Wijn et al. (2017) already makes an attempt, which is
used as the basis for replication in this research. Furthermore, this is extended to looking at the
behavioural indicators which determine if someone is judged as having hostile intentions. With
this more insight is gained in developing methodologies that detect potential deceptive
behaviour and reduce possible threats to, for instance, the safety at airports. The research
question, therefore, is: Which behavioural indicators of a person determine if the judges decide
Theoretical Framework
To analyse the validity of deception detection methodologies, it is important to have a
closer look at the understanding gained in the last decades which is used as a theoretical basis
for those techniques. Some research was conducted to examine if people are actually able to
correctly identify deceiving people. Johnson and her colleagues (2018) carried out a study on
the basis of judging from analysing facial features functions and indeed participants were able
to detect criminal persons with a level of accuracy that is greater than chance. Similar results
were also found in the study of Valla, Ceci and Williams (2011), who showed images of the
faces of convicted criminals and innocent people, as well as the research of Thornton (1939)
where participants were successfully able to distinguish between pictures of lawbreakers and
lawful persons.
But what goes on in people that deceive? To begin with, a definition of deception is
necessary to comprehend the underlying aspects of methodologies such as SPOT. DePaulo et
al. (2003) define deception “as a deliberate attempt to mislead others” (p.74). This umbrella
term includes different aspects as for instance lying or hostile intentions. Since DePaulos
definition is quite a broad one might consider also other descriptions of deception. To be more
precise, the example of an actor highlights the difference. While acting one would then,
according to DePaulo, also be lying following that the actor misleads others by portraying a
different character. Vrij (2008) labels deception as ”a successful or unsuccessful deliberate
attempt, without forewarning, to create in another a belief which the communicator considers
to be untrue.” (as cited in Garner, 2019), so this definition adds the aspect of deceiving without
the knowledge or consent of the other person, excluding situations like the before mentioned.
Lying is one specific form of deceiving a person, although often these terms are used
interchangeably. Strictly speaking, lying is presenting knowledge as true although one knows
it is not (Stokke, 2013). Deception is more concealing or distorting the truth. So, lies are always
a form of deception but one can deceit without lying. To make this clearer, another example,
your friends want to smuggle a bomb and asks you what risks there are to consider. When you
tell him that there will be no cameras (implying that it is safe) you are not lying, still, you know
that there will be a security check he has to go through, and you are deceiving the person.
Studies show that although we are apparently pretty good liars it is difficult for us to
detect deception. In Feldman, Forrest and Happ’s study (2002) 60% of the participants admitted
that they lied at least once during a short conversation of 10 minutes. When looking at the ability
to disclose such forms of deceit, research demonstrated that the true detection probability is
apparently often make use of lies in our everyday life, it is quite difficult for us to discover these
lies in others.
And how do we discover deception? To answer this question, the research of Aldert Vrij
is most useful. His research contributed a lot to the evidence one has about deception and its
indicators, with the specific focus on non-verbal behaviour. Vrij (2000) demonstrates that there
is no universal set of behaviours that can be used as a guideline to detect deception, especially
since deceiving is really personality dependent. This means that different people show different
behaviours which makes it so difficult to generalize. Still, some non-verbal indicators are
presented by him, as for instance decreased hand and finger movements as well as less activity
in the legs or feet (Vrij, 2000).
Another aspect of deception is hostile intentions, which Wijn et al. define as the
”individual’s intent to act in ways that imply or aim to inflict harm onto others” (p.2, Wijn et
al., 2017). When looking at the work already done on deception, most of it focuses on lying,
leaving out other aspects. This created a gap in knowledge about deception since it is something
different to tell lies, a verbal act, and the attempt of hiding hostile intentions, which is mostly
behavioural. As Vrij (2000) makes clear ”the vast majority of deception research has addressed a setting in which the target speaks.” (p.161).
When looking more in-depth at what kind of features participants use to identify
criminal behaviour, there is less research available. One of the most often mentioned researchers
connected to this field is the clinical psychologist Paul Ekman, whose scientific evidence tries
to give some insight into the discovery of deceptive behaviour by studying emotions
(Weinberger, 2010). He claims that certain people are able to spot hidden emotions by analysing
specific facial expressions. These facial features are scientifically named ‘micro facial’
expressions and consist out of short-lasting movements, such as wrinkling one’s nose, that
represent covert mental states (Weinberger, 2010). Furthermore, he argues that deceiving is
accompanied most typically by the emotions of fear, guilt and excitement (Ekman, 1992). Here,
the latter two apply to the lying itself whereas the first is more connected to being fearful of
getting caught which is more applicable in the case of hostile intention. A typical indicator
during the experience of guilt in this context is gaze aversion (Vrij, 2000), whereas for fear and
excitement signs of stress are more likely.
Although Ekman gained a lot of media attention with his books and tv show, scientists
do not agree completely with his findings. Critics, as for instance Weinberger (2010) say that
peer-mentioned SPOT, which leads to filtering out people and interviewing them without a sufficient
scientific basis. Concluding from the research on using behavioural indicators, one can see that
already some thought-provoking impulses are given but still too less reliable findings are made.
What happens when we deceive?
When considering the scientific journey criminology has made, it becomes apparent that
although research argues that we are able to determine a criminal based on a picture, it is not
really clear in how far people are able to detect hostile intentions. Apart from the theoretical
framework about deception, studies need to be conducted to gain more insight into how we can
spot hostile intentions and improve behavioural detection methods. This starts with making
these intentions visible by experimentally manipulating subjects with certain cues.
The Goa Report from 2013 points out that people, in general, are not that good in
detecting deception, reaching a level only slightly above chance. A meta-analysis of Hartwig
and Bond (2011) trying to show why this is the case, offers the explanation of weak cues in the
experimental situation that lead to the fact that too little information is present to be useful as
the basis for judgement. The paper of Wijn and his colleagues (2017) makes an attempt to
correct for this, by studying if environmental cues improve the detection of participants with
malicious intent. Here, judges determine based on short video clips if people carry hostile
intentions. Although this study does not examine what exactly this judgement is based on it is
[image:7.595.83.437.517.696.2]a step in the right direction to investigate the detection of hostile intentions.
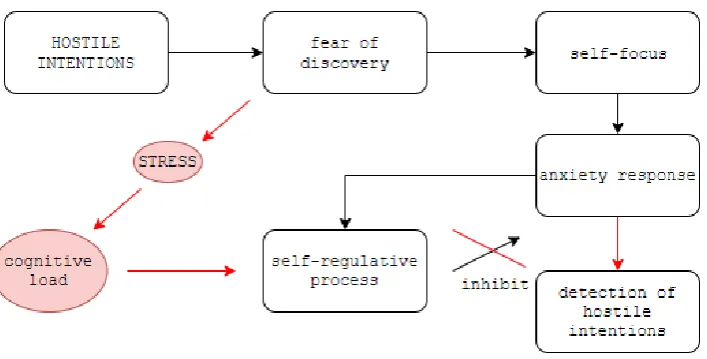
In Figure 1, one can see the underlying theoretical framework of the article of Wijn et
al. (2017), which is used as the basis for this study. To start, Wijn and his colleagues identify
that it all starts with having hostile intentions, which often leads to an overestimation of one’s
own behaviour, by believing that this is more salient to others (Gilovich, Medvec, & Savitsky,
2000). More specifically, this means that for example when cheating during an exam one tends
to think that their behaviour is especially remarkable to others and they expose you. The stakes
of this malicious intent are high, so is the fear of discovery which leads to heightened
self-focused attention (Brown & Stopa, 2007). This means that individuals have the tendency to
shift their attention to monitoring and assessing their own behaviour to use this as an inference
on how they may appear to others.
This bias of over-perceiving the degree of events directed towards oneself (Fenigstein,
1984) and fear of discovery lead to the activation of anxiety-related response pattern as, for
instance, the fight- or flight reply (Wijn et al., 2017). The mind prepares to survive the situation
and aims to inhibit the anxiety by restoring one’s self-presentation, so, for example, trying to
shake less or calm down. To do so, self-regulation is stimulated, meaning the capability to
reshape one self’s responses and inhibiting behavioural responses incompatible with one’s goal
of deception (Hofmann, Schmeichel, & Baddeley, 2012; Vohs, Baumeister & Ciarocco, 2005).
Undesirable behaviours are suppressed to appear more ‘normal’ so that observers do not detect
the hostile intentions one tries to hide. Problematic about this attempt of impression control is
that it is quite effortful to counteract unwanted behaviour (Vohs, Baumeister & Ciarocco, 2005),
including a high level of cognitive capacity needed to fulfil this (Baumeister & Heatherton,
1996). Hofmann, Schmeichel and Baddeley (2012) point out that this needed capacity is not
given when a person stands for instance under stress, which is a typical by-product of situations
including hostile intentions.
The difficulty is that in a situation where someone carries, for instance, a bomb, as in
the given study, the stress level of this person is quite high. Due to the cognitive load, which is
triggered by a stressful situation, the mind is not possible to inhibit anxiety anymore (displayed
in red, see Figure 1) which leads to a higher probability of being detected of having hostile
intentions. At this moment one is not able to suppress the undesirable behaviour, ergo is more
apparently showing that one does something illegal. This is a bit ironic since the primary goal
of the self-regulative processes is to weaken the possibility of getting caught by preventing for
instance errors in speech or body language, but with the stress, increase this is more
After Wijn and his colleagues published their article in 2017, criticism came up from
the authors Meijer, Verschuere and Merckelbach. They argue that the results of their study can
falsely be used as argumentation to build behavioural observation programmes since their
conclusion is ”fundamentally wrong” (p.2 Meijer et. al., 2017) and the results are not above chance level. As a reaction to these critics, Wijn (2017) argues that the study ”focuses on a specific element in behavioural detection programmes” (p.5) and therefore the findings cannot
be used, as Meijer and his colleagues argue, as general support for these programmes but only
as evidence limited to this specific element.
Present Research
The primary purpose of the current study is to replicate Wijn et al. (2017) and confirm
the validity of the previously found results. Moreover, this paper focuses more on the qualitative
side of this research, namely on the basis of the question what determines the detection of
malicious intent. Which indicators underly the decision of the judges to think someone has
hostile intentions or not? By answering this question, it is possible to come closer to the
possibility of correct detection of criminals.
For the replication of the Wijn et al. (2017) study, hypothesis 3 and 4 are reused to see
if similar findings result.
Hypothesis 1: The risk of exposure, signalled by environmental cues, leads to a higher ability of the observers to distinguish between hostile and non-hostile intentions.
Hypothesis 2: The probability of detecting hostile intentions will be higher when the participant’s cognitive load is constrained, due to the inhibition of the
self-regulation processes.
Apart from the quantitative part of this study, also a research question is added to
investigate the qualitative aspect of the detection of hostile intentions. Here it is desired to
understand what the judges use as the basis for their decision during the replication study of
Wijn and his colleagues. This leads to the research question:
Research Question: What kind of information is needed to predict the correct detection of hostile intentions? And, what are the specific behavioural indicators that
Methods Design & Participants
Based on the study of Wijn et al. (2017) a within-participants 2 (Hostile Intent: yes vs.
no) x 2 (Cue: present vs. not present) x 2 (Cognitive load: high vs. low) design was employed.
The stimulus material used to watch and judge by the participants consisted out of short video
clips from the second study of Wijn et al. (2017). This video footage includes the original
stimulus material of Wijn et al. (2017). The factors environmental cue and mental load are the
independent variables, whereas the recognition of hostile intention is the dependent variable.
Furthermore, a qualitative part was included asking questions about specific behaviour
indicators that determine if someone is carrying hostile intentions or not. The participants were
unknowing of these conditions and the set-up of the above-described design.
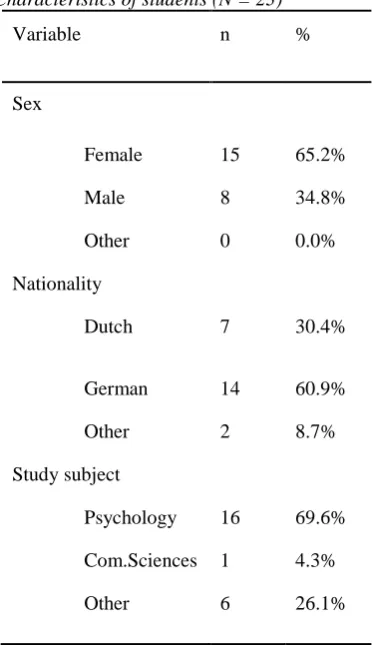
The sample includes 23 university students (see Table 1), wherefrom 8 are men and 15
women. The mean age of all participants is 22.35 (SD = 2.31). The sample size is based on a G Power test including eight groups and 15 measurements (0.5 f, α: 0.05, p: 0.8) that resulted in a total sample size of 16 (Faul, Erdfelder, Lang & Buchner, 2007). Moreover, Simonsohn (2014)
explains that for replication the sample size should be at least two and a half times the original
size, which is in this case 20 so in total 50 (Wijn et al., 2017). Due to cooperation with another
researcher, the sample size is increased to 60 but due to time issues it was not feasible to reach
the sample size of 60, therefore the goal of 20 was agreed. For further details about the
nationality or study programme of the participants see Table 1.
The students participated in exchange for 1.5 Sona System credits that they need to
obtain for their bachelor. The requirement to participate was the ability to fluently speak
English.They were recruited either via the Sona System, by giving out flyers in different classes
of the Psychology Programme, reciprocity of other researchers or personal messages to close
Table 1
Characteristics of students (N = 23)
Variable n %
Sex
Female 15 65.2%
Male 8 34.8%
Other 0 0.0%
Nationality
Dutch 7 30.4%
German 14 60.9%
Other 2 8.7%
Study subject
Psychology 16 69.6%
Com.Sciences 1 4.3%
Other 6 26.1%
Materials
Stimulus material. The quantitative part of this study includes the video footage of Study 2 of Wijn et al. (2017), which consists of 148 video clips, lasting from 19 - 43 seconds
with a total of about one hour. Each video provided the watcher with one case, followed by the
decision-screen including the question: (”Ik denk dat deze persoon het explosief in zijn/haar tas
heeft zitten”) ”I think this person is carrying a bomb in their bag.”and the answer possibilities (”Ja” of ”Nee”) ”Yes” or ”No” (see Figure 3).
The persons seen in the videos carry a laptop case (see Figure 2.2), containing either
books (non-hostile intentions) or mock explosives (hostile intention), through a 20 meter long
hallway to a certain checkpoint were a preceding participant is waiting (see Figure 2.1) Halfway
an environmental cue was administered of a white noise resembling a police walkie-talkie’s
static noise (cue) versus no noise (no cue). Later on, in the cue videos, the noise was deleted to
not prime the judges. Also, a grey square was edited in the videos, so the participant was not
able to see the preceding person waiting (see Figure 2.1).
Furthermore, as cognitive load manipulation, the experimental assistants had to count
their steps in the high cognitive load version, contrary to not receiving more load. To increase
that if they fail they would have to fill out another time-consuming questionnaire, whereas if
they would succeed smuggling the bag they had a higher chance of winning a monetary price
of 100€. This potential gain or loss was used to motivate the actors to not stand out at the
checkpoint and be detected. After reaching the end of the hallway and queuing up, the video
ends.
Figure 2.1. Screenshots of the example video 1 Figure 2.2. Close shot of the participant in the example video 2
Figure 3. Screenshot of the decision-screen
Questionnaire. In the qualitative part of this study, a questionnaire was used to find out which behavioural indicators were involved in the hostile vs. non-hostile decision (Appendix
C). This was conducted through Qualtrics, containing a total 19 of questions. At the end of the
study, the first questionnaire asks for demographics like age, gender and nationality as well as
an examination of the participation in terms of for instance concentration (see Appendix C2).
The second questionnaire, containing 12 questions, was used to gain insight into the behavioural
indicators determining hostile intentions. First, an open question was placed to find out what
features the participant used. The open question: ”What behavioural indicators did you use for
your decision?” is followed by multiple-choice questions (for further information see Appendix
[image:12.595.69.457.196.339.2]and another open question to see if anything remaining is not included but was important in the
decision (“Are there any other behavioural indicators that are not mentioned above but were important during your decision while watching the videos?”).
These questions were based on the answers people gave in a previously conducted pilot
study together with the before mentioned results regarding behavioural indicators according to
Vrij (2000). For this pilot study, four different persons were asked to watch eight, individually
chosen, random videos and make notes about which behavioural indicators they used during
their decision making. Here, hostile and non-hostile indicators were asked, which ended as the
basis for the final questionnaire.
Multiple answers were possible to the questions, as for instance: ”Did you use the body
language of the person as an indication for hostile intentions?”, ”Did you use the person's walking style as an indicator of innocence?” (see for the total questionnaire Appendix D).
Furthermore, the scales of neuroticism & agreeableness of the personality test NEO-PI-R were
included which is part of a related study. These results will not be discussed and analysed any
further in this current study.
Procedure
The judges were invited to the university facilities and told that they were going to watch
some videos. In the beginning, a brief explanation was given about the purpose of the research
followed by the informed consent via Qualtrics (see Appendix A). After signing the informed
consent, a short instruction was given based on the original study of Wijn et al. (2017). Since
the original instruction integrated into the Matlab file is in Dutch, this was translated into
English and included in Qualtrics (see Appendix B). This informs the judges that half of the
people displayed in the videos carry a bag with a bomb whereas the other half carried books
through the hallway. Matlab was opened and the participants viewed the original instruction.
After this, the participants had the chance to practice the procedure with five example videos to
get familiar with the study.
Then a summary of the instructions is shown, the videos start, followed by the decision
screen where the ”yes” or ”no” answer was recorded for each video. After the first half, a screen
pops up to explain to the participant that he or she can do a short break before finishing the
study. Then Matlab has closed automatically and the participant had to give heads up so that
the researcher could come and open Qualtrics were the remaining questionnaires were shown.
After this, a short debriefing was given to the participant. It was explained, via Qualtrics,
was used during the videos as well as the expectations of having better detecting rates with
these (see Appendix 2.5). At the end of the procedure, the participants had the opportunity to
fill their email in a list to provide them with feedback on their hit rate. The study lasted around
90 minutes in total.
Analysis
Quantitative Part. To analyse the found data mixed methods were applied. To start off, with the quantitative part of the study to answer the hypotheses, no participant was excluded
from our data set. Furthermore, 9 videos had to be deleted due to unknown conditions, resulting
in a total of 143 videos. Then the raw data from Matlab was exported for each participant to
Excel. As feedback for the participants on how good they scored, their hit rates and false alarms
were calculated. Then the data of the descriptive statistics and frequencies of aspects age,
gender and nationality were imported from Qualtrics to SPSS. All calculated values were
rounded to the second number after the decimal point.
Then, the answers of the participants in form of yes and no were recoded into the new
variables called miss, hit, false alarms and correct rejections distinguished by the conditions of
the videos (cue x load, no cue x no load, load x no cue, cue x no load). Then the means were
calculated per category and used for the ANOVA. Factorial repeated-measurements ANOVA’s
were conducted with cue and load as independent variables as well as hits, misses, false alarms
or correct rejections as dependent variables.
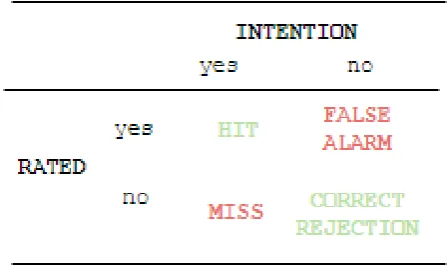
Moreover, the signal detection theory by Zhang and Müller (2005) was used as a basis
(see Table 2). Here, there are two categories, namely how the participants ‘rated’ as well as the true ‘intention’ of the persons in the video. The answers are, therefore, rated as guilty (yes) or
not guilty (no) for both. This results into a hit, when the participant rated the person as guilty
and they are actually guilty and miss if one is not rated as guilty but is indeed guilty. A false
alarm is when the judge decided that this person is carrying a bomb although, in fact, they are
not. Lastly, a correct rejection is when the judge correctly decided the person in the video does
Table 2
Hits and Misses
To find out the individual scores of the participants to be able to give them feedback the
hit rates (H) and false alarm rates (F) were imported from Matlab to Excel. Hit rates consist of
the number of people rated guilty divided through the number of people with a hostile intention.
The false alarm rates are calculated by dividing the number of people rated as guilty with the
number of people with a non-hostile intention.
Qualitative Part. To answer the research question, the answers to the questionnaires regarding the behavioural indicators were analysed. This can be divided into the analysis of the
open questions as well as the multiple-choice questionnaire.
Open Question. With a deductive approach, the answers to the open questions were coded with the program Atlas.ti 8. To ensure inter-rater reliability, this coding process was
conducted independently by two researchers. It was not necessary to exclude any of the
answers. First, the answers were first of all categorized according to the condition, so either
hostile intentions or innocence. Due to the small length of the total answers, the whole set was
coded once by both researchers. To ensure the intersubjectivity, only similar codes were used
for further analysis. As overarching categories, the subject areas from the results of the pilot
study were used as a basis, and advanced categories were created when something new was
mentioned. Then, the coding was conducted once more with the final coding scheme (see
Appendix F). Important to mention is that the behavioural indicators or group of these were
only coded once per answer, meaning that even if the participant mentioned them more often it
is only counted once.
In the end, after independently coding all answers, the two investigators ended up with
a per cent agreement of 77.7% and high inter-rater reliability (Krippendorff’s c-Alpha binary
[image:15.595.75.299.115.248.2]interrater-agreement, corrected for chance agreement and Cronbach's alpha measures more the internal
consistency of a unidimensional scale.
Regarding the analysis of the coding, first frequency tables were created to have an
overview of the total frequency of the code groups. Moreover, the percentages were used as a
basis for comparison to answer the research question regarding the behavioural indicators. The
frequency tables are used to compare the comments about hostile as well as non-hostile
behaviour.
Multiple Choice Questionnaire. Since the MC-Questionnaire had the option of choosing multiple responses as an answer, a multiple response analysis was conducted to partly
answer the research question regarding the behavioural indicators. Therefore, the results of
Qualtrics were transferred to SPSS and frequency tables were created for each question. By
this, insight was gained in which aspects determined if a person was judged as carrying a bomb
or only books.
Results Quantitative Part
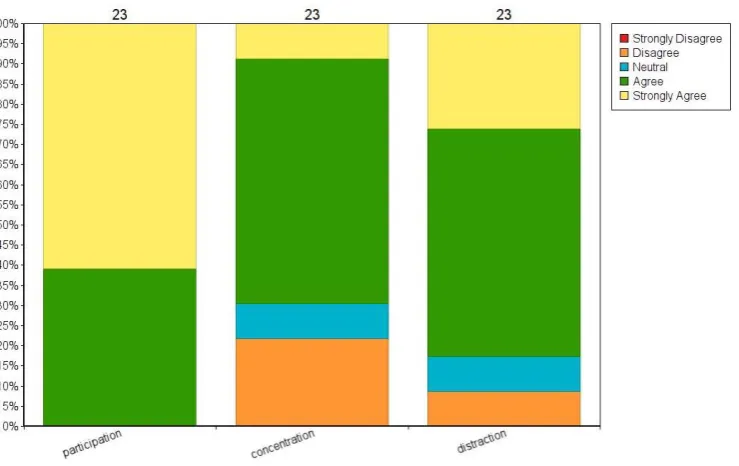
Concentration. In order to test in how far the participants were able to concentrate while watching the videos, a five-point Likert scale was used to test their participation level
with three questions (see Figure 3). When looking at the answer, no outliers were found.
Regarding how serious they took the study, one can say that the participants showed overall
agreement with the statement (M =4.61, SD = 0.50). When looking at the concentration of the participants (M = 3.57, SD = 0.95), the majority agreed that they were able to do so (60% for Agree), still five people disagreed (22%). For the last question, most of the participants were
Figure 3. Participation Questionnaire
Hits and Misses. When looking at the descriptive statistics of the hits and misses, it is apparent that the misses are most common (M = 0.63, SD = 0.14). This is followed by the correct rejections (M = 0.6, SD = 0.13), with hits as the least common one (see Table 3). So, most participants detected non-guilty persons correctly but true guilty people wrongly.
Moreover, more people were judged as having hostile intentions then they actually had.
Table 3
Descriptive Statistics of Hits and Misses
N Minimum Maximum Mean Std. Deviation
hits 23 .07 .58 0.37 0.14
misses 23 .42 .93 0.63 0.14
false alarms 23 .06 .57 0.40 0.13
correct rejections
23 .43 .94 0.6 0.13
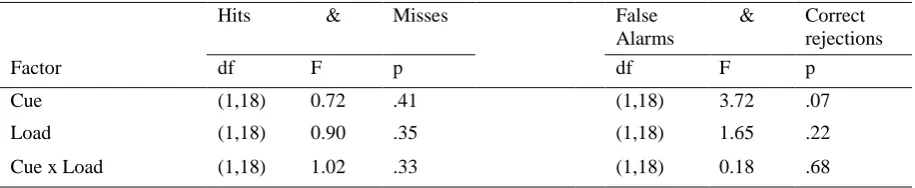
Detection of hostile intent. The factorial repeated measures ANOVA showed no statistically significant effect of cue or load on either hits, misses, false alarms or correct
rejections (displayed in Table 4). The calculations for the hits and misses as well as the false
alarms and correct rejections resulted in the same numbers, therefore they are displayed together
[image:17.595.75.504.477.613.2]No significant main effect was found of cue on the hits and misses, F (1,18) = 0.72, p =
.407, as well as the false alarms and correct rejections, F (1,18) = 3.72, p = .07. So, detection rates of the participants were not better when the person seen in the video received the cue of
the walkie talkie noise in comparison to no given cue. This is similar for the cognitive load,
here also no statistically significant main effect was found (see Table 4). This means that when
the people had to count their steps, judges were not better able to decide if this person carries a
bomb in their bag or not.
When looking at the interaction between cue and load (see Table 4), no significant
interaction effect was found for the hits and misses (p = .33) as well as for the false alarms and correct rejections (p = .68). Overall, this means that the findings of Wijn et al’s (2017) could not be replicated. So, no significant differences were found for the factors cue and load, which
[image:18.595.71.529.358.452.2]was the original hypothesis of Wijn et al. (2017).
Table 4
Tests of Within-Subject Effects of ANOVA
Hits & Misses False
Alarms
& Correct rejections
Factor df F p df F p
Cue (1,18) 0.72 .41 (1,18) 3.72 .07
Load (1,18) 0.90 .35 (1,18) 1.65 .22
Cue x Load (1,18) 1.02 .33 (1,18) 0.18 .68
Qualitative Part
Multiple Response Analysis. For the research question ”Which behavioural indicators
of a person determine if the judges decide that they have hostile intentions?”, the answers
regarding the non-verbal behaviour of people carrying a bomb or books were examined. For
each question, there is one table including the frequencies split up in the two conditions of
hostile and non-hostile intentions.
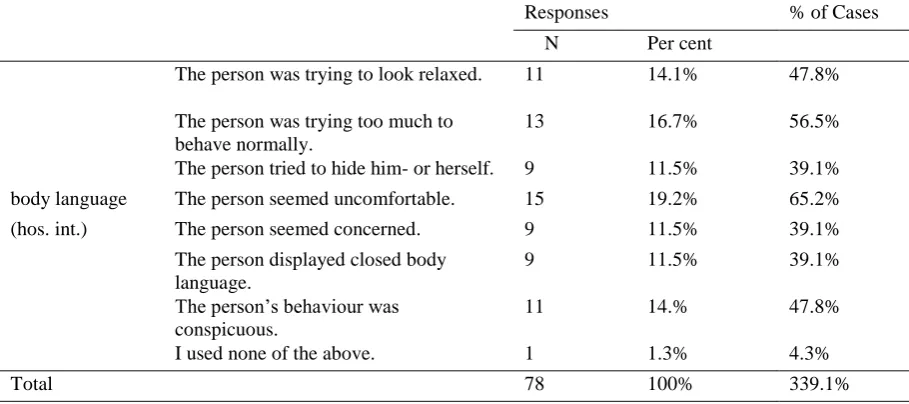
Body Language. Firstly, the condition of the hostile role was explored starting off with the indicator body language. Here it is remarkable, that the indicator about seeming
uncomfortable was mentioned most often (19.2%; 65.2%, see Table 5). Furthermore, people
mentioned that trying to behave normally was an important aspect (17%) as well as looking
relaxed (14%) and being conspicuous, where the latter two are mentioned both by 11 people.
This indicates that all mentioned aspects regarding body language are important for the
Table 5
Frequencies for Question 1 (body language), hostile intentions
Responses % of Cases
N Per cent
The person was trying to look relaxed. 11 14.1% 47.8%
The person was trying too much to behave normally.
13 16.7% 56.5%
The person tried to hide him- or herself. 9 11.5% 39.1% body language The person seemed uncomfortable. 15 19.2% 65.2%
(hos. int.) The person seemed concerned. 9 11.5% 39.1%
The person displayed closed body language.
9 11.5% 39.1%
The person’s behaviour was conspicuous.
11 14.% 47.8%
I used none of the above. 1 1.3% 4.3%
Total 78 100% 339.1%
When looking at the aspect of body language in the innocence questionnaire, it is
remarkable that here behaving normally (16%) and feeling comfortable (18.5%) are also
mentioned the most (see Table 6). This is followed by being relaxed (N = 14) and not being
concerned (N = 13). So, the opposite of the indicators of hostile intentions applies to being
innocent.
Table 6
Frequencies for Question 1 (body language), innocence
Responses % of Cases
N Percent
The person was relaxed. 14 15.2% 60.9%
The person behaved normally. 16 17.4% 69.6%
The person did not try to hide him- or herself.
11 12% 47.8%
body language The person seemed comfortable. 17 18.5% 73.9% (innocence) The person did not seem concerned. 13 14.1% 56.5%
The person displayed open body language.
8 8.7% 34.8%
The person’s behaviour was unobtrusive.
3 3.3% 13%
The person behaved confidently. 10 10.9% 43.5%
I used none of the above. 0 0% 0%
Total 92 100% 400%
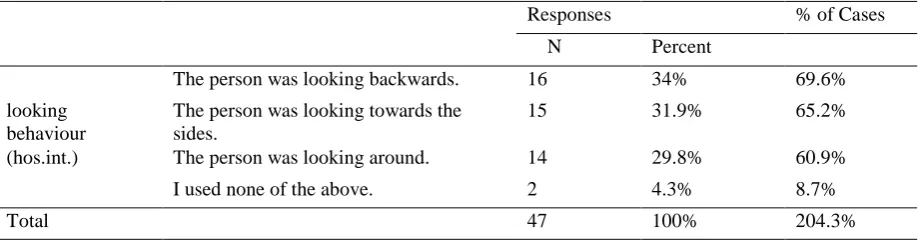
Looking Behaviour. For the indicator ‘looking behaviour’, regarding the hostile intentions condition, it is apparent that looking backwards, towards the sides and around are
[image:19.595.68.526.475.665.2]of these were seen as indicators of carrying a bomb, contradicting to the results regarding the
innocent condition. Here, although less often, looking towards the sides was mentioned most
(9%). Still, a total of ten people said that they used none of the aspects (see Appendix G, Table
[image:20.595.73.533.205.325.2]13).
Table 7
Frequencies for Question 2 (looking behaviour), hostile intentions
Responses % of Cases
N Percent
The person was looking backwards. 16 34% 69.6%
looking behaviour
The person was looking towards the sides.
15 31.9% 65.2%
(hos.int.) The person was looking around. 14 29.8% 60.9%
I used none of the above. 2 4.3% 8.7%
Total 47 100% 204.3%
Use of Hands. The third question dealt with the use of hands of the persons with the result that fiddling at their clothes was used as an indicator for hostile intentions with 40.6%
(see Appendix G, see Table 14). Regarding this category, for the innocent condition, no aspect
resulted in more than ten responses (Appendix G, Table 15).
Table 8
Frequencies for Question 3 (walking style), hostile intentions
Responses % of Cases
N Percent
The person was walking slowly. 13 23.2% 56.5% walking style
(hos.int.)
The person was walking too fast. 11 19.6% 47.8%
The person had a tense way of walking 14 25% 60.9%
The person walked down the hallway in a straight line.
6 10.7% 26.1%
The person’s walking style was determined.
10 17.9% 43.5%
I used none of the above. 2 3.6% 8.7%
Total 56 100% 243.5%
Walking Style. For the category ’walking style’ more responses were recorded for the different aspects of hostile intentions, included in Table 8. A tense way of walking was indicated
most often as an important aspect with 25%, together with a slow walking style (23.2%). This
[image:20.595.70.527.471.634.2]responses). For the innocent part of this question, 23 responses were recorded for ”The person
had a normal way of walking”, so a total of 57.5 per cent (see Appendix G, Table 16).
Facial Expressions. The last category included the facial expressions of the people seen in the videos (Table 9). Here, for the hostile intentions, having tense facial expressions was
distinctive for the decision of the judges (16, 25%). Avoiding eye contact and looking at the
ground were other important indicators (both 21.9%, 14). Lastly, trying to look cool was a
response from ten people (see Table 9). Regarding the indicators of innocence, 19 judges
mentioned that having relaxed facial expressions is decisive for being innocent (see Appendix
G, Table 17). Smiling was mentioned by 14 persons as a sign of having no bomb in their bag.
This total of around 39 % is in contrast to the 11% that choose smiling as a sign for having a
[image:21.595.72.530.350.500.2]bomb.
Table 9
Frequencies for Question 3 (facial expressions), hostile intentions
Responses % of Cases
N Per cent
The person was smiling. 7 10.9% 30.4%
facial expression The person was avoiding eye contact. 14 21.9% 60.9%
(hos.int.) The person was looking at the ground. 14 21.9% 60.9%
The person was trying to look cool. 10 15.6% 43.5%
The person had tense facial expressions. 16 25% 69.6%
I used none of the above. 3 4.7% 13%
Total 64 100% 278.3%
Open Question. In total, 31 responses were collected regarding the open question:
”What behavioural indicators did you use for your decision?”. These answers ranged from
shortest 2 words to 75 words for the longest one. For the second open question regarding
remaining behavioural indicators, only two persons gave an answer, speaking about the
interaction of the person seen in the video. The rest of the participants did not mention
something additional after the multiple response questions.
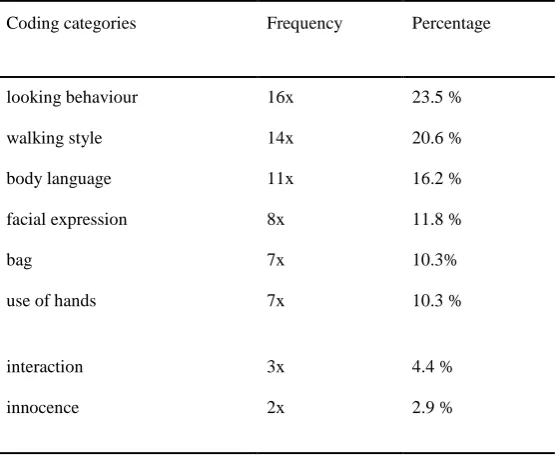
When coding the 525 words in total, eight codes developed (see Table 10). Participants
Next, the body language, namely their impression of the person or more general
movements, was the third mentioned indicator. Here, answers varied from seeming ”nervous; guilty or rather insecure” to ”fast, twitched movements; statistic walking posture” or being
”overconfident”.
Regarding the way the person held their bag, 10 % mentioned that, for instance,
”put[ting]down their bag” or ”the bag loosely hanging or held with firm grip” as a sign that
the person was having a bomb with them. Moreover, someone mentioned that he/she thought
”if you have explosives you probably not want them just standing around”. Their facial
expressions and use of hands were mentioned with a similar number, eight and seven times.
Here, ”looking tedious; grinning for no apparent reason” and ”extreme smiling” were seen as
having hostile intentions.
Also, the code ”innocence” was applied twice, including that either not doing
something ”obvious” or ”talking to other people waiting” made them seem innocent. This is
contradicting to other answers since three people indicated that this interaction was for them an
indicator for hostile intentions. Moreover, seeming ”trustworthy when started smiling” was
used, which others saw as negative was mentioned in terms of innocence.
Lastly, three people mentioned the interaction the person had with others in the scene
was an indication for carrying a bomb. Either ”how close to another person the person stopped”
[image:22.595.77.356.516.743.2]or ”seeking contact with other people” in line was decisive.
Table 10
Frequencies of Open Question (total = 68)
Coding categories Frequency Percentage
looking behaviour 16x 23.5 %
walking style 14x 20.6 %
body language 11x 16.2 %
facial expression 8x 11.8 %
bag 7x 10.3%
use of hands 7x 10.3 %
interaction 3x 4.4 %
Discussion Main findings
Conclusion. Overall, one can conclude that the findings of this research do not confirm the results of the original study of Wijn and colleagues (2007). The environmental cue or
cognitive load had no main effect or interaction effect on the ability of the observers to correctly
detect hostile intentions. Originally hypothesized was first that the risk of exposure, signalled
by the cue, would lead to a higher detection accuracy, which is proven to be rejected based on
the results. Moreover, the probability of judging correctly was not higher when the participants
had to count their steps, so the second hypothesis about the cognitive load is also rejected.
When looking at the distribution of the hits and misses, it is apparent that most
participants missed the actual wrongdoer in the sense that they falsely judged an innocent
person as guilty. This was followed by the ‘correct rejections’, so rightly determine the innocent
person. Most unlikely were the hits, so the least people were able to correctly detect the person
having hostile intentions. Therefore, both hypotheses can be rejected, which is contradicting to
the results of Wijn et al. (2017), who concluded that ”cues that may signal exposure can improve
the detection of hostile intention [..] provided that potential wrongdoers have a relatively high
cognitive load” (p.18, Wijn et al., 2017).
Moreover, this paper had the intention to gain more insight into the behavioural
indicators accompanying hostile intentions. Here, the results of the multiple-choice
questionnaire as well as the coding of the open question revealed that there are several
indicating factors. For the open question, the way a person looks was most indicative for
participants regarding if a person is carrying mock explosives with them. Also, their walking
style as well as their body language determined if the participants judged them as guilty or
innocent.
This is in contrast to the results of the multiple response questions since the indicators
‘looking behaviour’ and ‘walking style’ were only mentioned in the top three. For this method,
body language was mentioned as the most important. This can be explained by the order of the
questions since the open question was to start of what you think you used for your decision,
whereas the multiple response questions go more into depth about the different specific
indicators. For the questions regarding innocence, body language was also the most mentioned
indicator in the open question, followed by the walking style of the person, which is rated here,
in this condition, as much more important than for the hostile intentions.
When looking more closely into the results of the multiple response questionnaire, no
In most of the aspects, somehow contrary aspects, for instance, walking slowly and walking too
fast were chosen by the participants. Body language, i.e. feeling uncomfortable or trying to
behave normally, were indicative of carrying a bomb as well as looking to all kinds of
directions. Moreover, participants used the way of walking and use of hands as behavioural
indicators. The only contrast between the innocent and guilty condition was seen when it came
to the behaviour of smiling, which was judged in both directions.
Concluding, when it comes to the results of the behavioural indicators it is difficult to
name specific aspects one could use to determine if a person is carrying a bomb or not. Results
showed that many different aspects were a basis for the decision of the participant, but no
specific indicator was standing out.
Specific Points.Deception Detection. In the following, the found results regarding the behavioural indicators are compared to the existing literature in this field. Firstly, participants
stated that when the person was avoiding eye contact, this was an indication for them that they
had something to hide. Previous research about eye movement concerning deception has stated
diverse opinions. Some researchers describe that truth-telling implies a longer duration in eye
contact (Knapp et al. as cited in Hocking & Leathers, 1980), but, for instance, McClintock and
Hunt argue that, while deceiving, one has more eye contact and lastly Matarazzo examined that
there is no difference in eye contact (both cited in Hocking & Leathers, 1980).
In the current study, participants also mentioned the looking behaviour of the people in
the videos. Looking backwards, to the ground or the sides were, for the participants, an indicator
of carrying a bomb. This can be connected to the programme Neuro-Linguistic Programming
(NLP), which uses the position of the eyes as an indication if the person is lying or not (Bandler
& Grinder, 1975). Results of NLP argue that humans tend to look to the left when they
remember past events, whereas looking to the right is more connected to constructing a false
truth to conceal one’s lies. Although this is a widely spread theory (Hocking & Leather, 19808),
the scientific evidence for this is weak and replications could not find support for these findings
(Witkowski, 2010).
Another indicator mentioned was the facial expression, which is in line with research
that claims that through facial movements, in terms of contracting or relaxing, one can detect
deception better. For this, the Facial Action Coding System (FACS) is used to monitor
differences in facial expressions during deceiving (Ekman, Friesen & Hager, 2002). Mondal
and her colleagues (2018) argue that conscious activation in the facial muscles is used to mask
but challenging source for deception since the deceiver has the most ability to control his face.
However, the wrongdoer has less control over his outer extremities, e.g. legs or feet, which
bring us to another indicator: body language.
Literature shows that a decrease in leg and foot movements, as well as hand and arm
movements, are nonverbal behaviour indicators, and, in general, the overall liveliness is reduced
(Hocking & Leathers, 1980; Vrij, 1996). Also, in deceivers, fewer head movements are
displayed, which is contrary to the results found in this study. Participants mentioned a lot of
movement, from fiddling on one’s clothes to the way the person in the video was holding their
bag. As a meta-analysis shows, this can be explained due to their misbelief that people who
want to hide something are nervous, which, in their imagination, would lead to the increased
movement (DePaulo, 1992; DePaulo et al., 1985; Ekman, 1989 cited in Vrij, 1996). However,
this is actually not the case.
Lastly, one has to keep in mind that there is no consistent pattern of behaviour when it
comes to deception and carrying hostile intentions. Not only personality differences but also
the individual ability to monitor one’s behaviour influences the probability of detecting hostile
intentions. These individual differences make it difficult to create a general and reliable source
of deceit detection.
Replication. When looking at the fact that this current research was a replication of the study Wijn and colleagues (2017), one has to have a look at how closely it was conducted to
the original one. One main aspect here is that the study of Wijn and others (2017) was conducted
in Dutch, thus, the instruction, as well as the decision screen, were written in Dutch. Although
all these texts were translated into English and the participant was instructed about this language
issue, it could have still influenced the study.
Concentration. Results of the participation questionnaire indicated that the participants took the study seriously, were overall able to concentrate and were not distracted. This is
somehow contradicting to the feedback the researchers got from the participants as well as the
personal expectations. The study took the participants a total of 90 minutes, wherefrom 60-70
minutes entailed watching the videos. These clips were rather monotonous, watching a person
walking down the same hallway for about 160 times. Although after half of the videos, there
was the possibility to take a break, participants explained that they wanted to ‘get it over with
quickly’ and only one person made actually use of the offered break. Therefore, it was expected
that the rates for the question regarding the concentration would be lower. The study by Cornish
minutes. Due to individual differences in attention, it is difficult to claim a fixed amount of
time, still, a total of 90 minutes of the current study exceeds this number by far.
Nevertheless, although some people answered with disagree on the question about their
concentration, the overall score showed that they agreed. This could be the result of a social
desirability bias, meaning that people did not answer honestly but more in the way of what
answer they thought would be expected of them (Stuart & Grimes, 2009). This response bias
interferes with the truth since the participant tends to answer in a manner to be seen favourably
by the researchers. Most of the participants were psychology students, also currently writing
their bachelor thesis and, due to that, knew about what makes a good study and what does not.
One explanation, therefore, could be that they expected the reliability of the questionnaire to
decrease if they stated they were not concentrated. Still, the questionnaire was anonymous,
whereas the feedback was given personally to the researchers, so the social desirability bias
only partly explains the received feedback. Since the participants admitted personally that it
was really hard for them to focus, it is difficult to find a clear explanation for the difference
between the results and the feedback.
Moreover, the original study used a grey square in the videos to cover up the person
preceding in the queue, probably to not distract the participant so he or she was able to fully
concentrate on the person walking the hallway. For this study, it was more contrary meaning
that most participants were distracted and asked the researcher if it was a problem with the PC
or it is intended.
Strengths & Suggestions
The main strength of this research is the aspect that it is a replication of the study of
Wijn et al. (2017). Close communication was possible with the researchers of this paper and
instructions were used from the original study to reconstruct the study as accurately as possible.
The field of psychology is currently experiencing a lack of replications and, if they are done,
they are likely to be unsuccessful or differ from the original as in this study (Maxwell, Lau &
Howard, 2015). Especially with topics like the one of deception, where less research is
available, it is important to be certain of the results since these also have consequences for the
real world.
Imagine you are walking nervously at the airport (due to reasons like fear of flying) and
some SPOT officers stop you and wrongly claim you are carrying a bomb, for instance, based
posting evidence that does not have high enough statistical power so one can speak, for instance,
about universal behavioural indicators. With replications, this power is enhanced, and this study
attempted to do so. Wijn et al. (2017) suggested in their paper to focus future research on the
actual behaviour of wrongdoers portraying hostile intentions, which is done in this study.
Therefore, more insight is gained in the ability to detect such intentions, which highlights the
contribution of this paper to the development of knowledge in the field of behavioural detection
methodologies.
To further enhance the strength and validity of this study, some suggestions are
formulated to gain more insight into deception detection. The main suggestion based on the
aforementioned issues with this replication study is to improve and adapt the study setting. This
research was already conducted two times (Fokkens, 2018; Schenk, 2018; Wijn et al., 2017)
resulting in non-significant results. Here, the feedback of the participants, as well as information
from other literature, could enhance the reliability and validity of the study setting.
Another suggestion is regarding the duration of the study. Some participants mentioned
they would have liked some indication on the screen in terms of how far they already are or
how many videos are left. Here, one could include, for instance, a bar showing the progress or
using percentages of how many videos are left (for instance in steps: 25%, 50% and so on).
With this, the motivation and effort of the participants could be increased which may have been
a problem which caused the non-significant results. Another suggestion could be to include
larger sample size and, therefore, reduce the number of videos to achieve higher concentration
and still maintain high reliability and validity.
Furthermore, the environment of the stimulus material is another aspect that could be
improved. As Wijn (2017) already mentions in his response to the critics, the videos only show
a controlled environment with no real terrorists carrying a bomb. He suggests that future
research should be conducted in more naturalistic settings. In the videos of Wijn et al. (2017)
the neutral hallway has no associations with an environment where behavioural detection
methodologies are normally used. Therefore, Pérez-Rosas et al. (2015) did exactly this, they
observed people in a real-life setting, namely TV street interviews, and this resulted in a better
than chance level detection of deception. This might be more fitting for lying than hostile
intentions, but it already shows what influence an environmental change can have.
The aspect of the environment can also be connected to what Wijn et al. (2017) mention
as a limitation in the original study, namely, that their participants may not have experienced
experimental assistant is not able to empathize with the role of a terrorist, this could also
influence how far the observes can decide if this person is portraying hostile intentions.
Making videos in, for instance, the setting of an airport or on the train would be more
fitting to the experiment. With this, it could increase the experience of hostile intentions, which
in turn could also increase the ability to correctly identify people that are carrying a bomb. With
these adjustments, the people would not only execute the instruction of carrying a bomb but
would sense to some extent how it actually feels to be a deceiver wanting to hide from the
security officers. Moreover, one could arrange a different camera angle not including the
proceeding person in the queue to not distract, as mentioned by the participants, so there is no
need to cover it up with the grey square.
In conclusion, one can say that it is difficult to answer the question: How much
information is needed to predict the correct detection of hostile intentions? And, what are the
specific behavioural indicators what person use for this detection? To answer this, more
research needs to be done to compare the different indicators. Moreover, the field of deception
has to focus its research on the question if environmental cues can increase the sensitivity of
people to correctly detect hostile intentions.
Lastly, the growing concern regarding the replication crisis shows how urgent it is to
recreate studies to enhance the statistical power and to be certain about the results. Finding out
more about deception, so it can be used as a valid basis for behavioural detection methodologies,
is necessary to decrease terrorism in the future. Therefore, instead of misusing the evidence
found, it should be used as support to increase sensitivity in the handling, for instance, of
Reference List
Bandler, R., & Grinder, J. (1975). The structure of magic. (Volume 1). Palo Alto, CA: Science and Behavior Books.
Baumeister, R. F., & Heatherton, T. F. (1996). Self-regulation failure: An overview.
Psychological Inquiry, 7, 1–15. doi:10.1207/s15327965pli0701_1
Bond, C. F., & DePaulo, B. M. (2006). Accuracy of deception judgments. Pers Soc Psychol. Rev., 10(3), 214-34. doi:10.1207/s15327957pspr1003_2
Brown, M. A., & Stopa, L. (2007). The spotlight effect and the illusion of transparency in
social anxiety. Journal of Anxiety Disorders,21, 804–819. doi:10.1016/j.janxdis.2006.11.006
Cornish, D., & Dukette, D. (2009). The essential 20: Twenty components of an excellent care team. Pittsburgh, PA: Diane Publishing.
DePaulo, B. M., Lindsay, J. J., Malone, B. E., Muhlenbruck, L., Charlton, K., & Cooper, H.
(2003). Cues to deception. Psychological Bulletin, 29, 74–118. doi:10.1037/0033- 2909.129.1.74
Ekman, P. (1992). Telling lies: clues to deceit in the marketplace, politics and marriage.
New York, NY: W.W. Norton
Ekman, P., & Friesen, W. V. (1969). Non-verbal leakage and clues to deception. Psychiatry, 32, 93-94. doi:10.1080/00332747.1969.11023575
Ekman, P., Friesen, W.V., & Hager, J.C. (2002) Facial Action Coding System. Manual and investigator’s guide. Salt Lake City, UT: Nexus.
Faul, F., Erdfelder, E., Lang, A.G., & Buchner, A. (2007). G*Power 3: A flexible statistical
power analysis program for the social, behavioral, and biomedical sciences. Behavior Research Methods, 39, 175-191. doi:10.3758/BF03193146
Feldman, R. S., Forrest, J. A., & Happ, B.R. (2002). Self-presentation and verbal deception:
Do self-presenters lie more? Basic and Applied Social Psychology, 24(2), 163-170. doi:10.1207/S15324834BASP2402_8
Fenigstein, A. (1984). Self-consciousness and the overperception of self as target. Journal of Personality and Social Psychology, 47, 860-870. doi:10.1037/0022-3514.47.4.860 Fokkens, A. (2018) Does it show when someone has hostile intentions? When in doubt,
replicate! (Unpublished bachelor’s thesis). University of Twente, Enschede, Netherlands.
Gilovich, T., Medvec, V. H., & Savitsky, K. (2000). The spotlight effect in social judgment:
An egocentric bias in estimates of the salience of one's own actions and appearance.
Journal of Personality and Social Psychology, 78(2), 211-222. doi:10.1037/0022-3514.78.2.211
Global Terrorism Database (2018, August). Global terrorism in 2017. University of Maryland. Retrieved from
https://www.start.umd.edu/pubs/START_GTD_Overview2017_July2018.pdf
Hartwig, M., & Bond, Jr. C.F. (2011). Why do lie-catchers fail? A lens model meta-analysis
of human lie judgments. Psychological Bulletin, 137, 643. doi:10.1037/a0023589 Hocking, J. E., & Leather, D. G. (1980). Nonverbal indicators of deception: A new theoretical
perspective. Communication Monographs, 47(2), 119-131. doi:10.1080/03637758009376025
Hofmann, W., Schmeichel, B. J., & Baddeley, A. D. (2012). Executive functions and self-
regulation. Trends in Cognitive Sciences, 16(3), 174–180. doi:10.1016/j.tics.2012.01.006
Johnson, H., Anderson, M., Westra, H. R. & Suter, H. (2018). Inferences on criminality based
on Appearance, Butler Journal of Undergraduate Research, 4(6). Retrieved from https://digitalcommons.butler.edu/bjur/vol4/iss1/6
Maxwell, S. E., Lau, M. Y. , & Howard, G. S. (2015). Is psychology suffering from a
replication crisis? What does “failure to replicate” really mean? American
Psychologist, 70(6), 487-498. doi:10.1037/a0039400
Meijer, E. H., Verschuere, B., & Merckelbach, H. (2017). Failing to tell friend from foe: A
comment on Wijn et al. (2017). Legal and Criminological Psychology, 23(1), 2-4. doi:10.1111/lcrp.12118
Mondal, A., Mukhopadhyay, P., Basu, N., Bandyopadhyay, S. K., & Chatterjee, T. (2018).
Identification of unique characteristics of deception from facial expression. Current Science, 114(4), 901-906. doi:10.18520/cs/v114/i04/901-906
Pérez-Rosas, V., Abouelenien, M., Mihalcea, R., Xiao, Q., Linton, C. J., & Burzo, M. (2015).
Verbal and nonverbal clues for real-life deception detection. Proceedings of the 2015 Conference on Empirical Methods in Natural Language Processing, 2336-2346. doi:10.18653/v1/D15-1281.
Simonsohn, U. (2014). Small telescopes: Detectability and the evaluation of replication
Results. Psychological Science, Forthcoming. doi:10.2139/ssrn.2259879 Statista (2018, November 1). The countries worrying the most about terrorism. Retrieved
from
https://www.statista.com/chart/7292/the-countries-worrying-the-most-about-terrorism/
Stokke, A. (2013). Lying, deceiving, and misleading. Philosophy Compass, 8(4). doi:10.1111/phc3.120
Stuart, G. S. & Grimes, D. A. (2009). "Social desirability bias in family planning
studies: A neglected problem". Contraception. 80(2), 108–112. doi:10.1016/j.contraception.2009.02.009
Thornton, G. R. (1939). The ability to judge crimes from photographs of criminals: a
contribution to technique. The Journal of Abnormal and Social Psychology, 34(3), 378-383. doi:10.1037/h0055531
U.S. Government Accountability Office [GOA]. (2013, November 8). Aviation security. TSA should limit future funding for behavior detection activities. (GOA publication No.
GAO-14-159). Washington, DC. Retrieved from
https://www.gao.gov/products/GAO-14-159
Valla, J. M., Ceci, S. J., & Williams, W. M. (2011). The accuracy of inferences about
criminality based on facial appearance. Journal of Social, Evolutionary, and Cultural Psychology, 5(1), 66-91. doi:10.1037/h0099274
Vohs, K. D., Baumeister, R. F., & Ciarocco, N. J. (2005). Self-regulation and
self-presentation: Regulatory resource depletion impairs impression management and
effortful self-presentation depletes regulatory resources. Journal of Personality and Social Psychology, 88, 632–657. doi:10.1037/0022-3514.88.4.632
Vrij, A. (2000). Detecting lies and deceit: The psychology of lying and implications for professional practice. Wiley.
Vrij, A. & Semin, G. R. (1996). Lie experts' belief about nonverbal indicators of deception.
Journal of Nonverbal Behaviour, 20(1). doi:10.1007/BF0224871522
Weinberger, S. (2010). Airport security: Intent to deceive? Nature, 465(7297), 412-415. doi:10.1038/465412a
Wijn, R. (2017). Response. Legal and Criminological Psychology, 23, 5-6. doi:10.1111/lcrp.12119
friend from foe: Environmental cues improve detection accuracy of individuals with
hostile intentions. Legal and Criminological Psychology, 23, 2-4. doi:10.1037/0033-2909. 129.1.74
Witkowski, T. (2010). Thirty-five years of research on Neuro-Linguistic Programming. NLP
research database. State of the art or pseudoscientific decoration? Pol. Psychol. Bull, 41, 58–66. doi:10.2478/v10059-010-0008-0
Zhang, J., & Mueller, S. T. (2005). A note on ROC analysis and non-parametric estimate of