University of Warwick institutional repository: http://go.warwick.ac.uk/wrap
This paper is made available online in accordance with publisher policies. Please scroll down to view the document itself. Please refer to the repository record for this item and our policy information available from the repository home page for further information.
To see the final version of this paper please visit the publisher’s website. Access to the published version may require a subscription.
Author(s): Turgay Celik and Tardi Tjahjadi
Article Title: Multiscale texture classification using dual-tree complex wavelet transform
Year of publication: 2009 Link to published article:
http://dx.doi.org/10.1016/j.patrec.2008.10.006
Publisher statement: “NOTICE: this is the author’s version of a work that was accepted for publication in Pattern Recognition Letters . Changes resulting from the publishing process, such as peer review, editing, corrections, structural formatting, and other quality control mechanisms may not be reflected in this document. Changes may have been made to this work since it was submitted for publication. A definitive version was subsequently published in Pattern Recognition Letters, VOL:30, ISSUE:3, February 2003, DOI:
Multiscale texture classification using dual-tree complex wavelet transform
Turgay Celik, Tardi Tjahjadi
School of Engineering, University of Warwick,
Gibbet Hill Road, Coventry, CV4 7AL, United Kingdom, Email: [email protected].
Abstract
This paper presents a multiscale texture classifier that exploits the Gabor-like properties of the dual-tree complex wavelet transform, shift invariance and 6 directional subbands at each scale, and uses a feature vector comprising of a variance and an entropy at different scales of each of the directional subbands. Experimental results demonstrate its robustness against noise and a higher classification accuracy than a discrete wavelet transform based classifier.
Keywords:
texture classification, dual-tree complex wavelet transform, multi-resolution analysis
1. Introduction
Numerous methods have been proposed for texture feature extraction and classification (Tuceryan & Jain, 1993). A comparative study (Randen & Husoy, 1999) suggests that for texture classification it is preferable to extract texture features by learning discriminative texture features from texture samples. Most approaches to texture analysis use a hybrid of different methodologies, making it difficult to cate-gorize them. By considering the main methodology used in texture analysis, we can loosely classify them into three main categories (Kim & Kang, 2007).
Statistical approach to texture analysis is motivated from the findings that the human visual system recognizes textured objects based on the statistical distribution of their image grey levels via first-order, second-order, or higher-order statistics (Julesz et al., 1973), (Julesz, 1962). The most commonly used method is the grey-level co-occurrence matrix (Haralick et al., 1973), which estimates texture properties related to the second-order statistics. It is worth pointing out that although statistical textural features are usually used to classify texture regions, most of them are extracted explicitly or implicitly based on a statistical representation of texture.
texture model that decomposes textures into deterministic and non-deterministic fields, that correspond to regular textural component and random textural component, respectively. Usually, these models can capture the local contextual information in a texture image. However, the model parameters are optimized based on an image representative features instead of its discriminative features.
Signal processing approach to texture analysis includes multichannel Gabor filter, wavelet transform, finite impulse response (FIR) filter, etc. Gabor filter is appealing because of its simplicity and support from neurophysiological experiments (Faugeras, 1978). Gabor filters have been used for texture segmentation despite being based on texture reconstruction (Jain & Farrokhnia, 1991), (Arivazhagan et al., 2006). A general filter bank is often too large because it is designed to capture general texture properties. However, textures can be classified by only a small set of filters, which gives rise to the filter selection problem. For example, a neural network system has been used to select a minimum set of Gabor filters for texture discrimination while keeping the performance at an acceptable level compared to the case without filter selection (Jain & Karu, 1996). In these filtering methods, texture images are usually decomposed into several feature images through projection by using a set of selected filters. These filters are often based on representation such that textures are reconstructed with the minimum information loss. On the other hand, our proposed approach extracts features that maximizes the separation or discrimination among different textures. The wavelet based methods are similar to Gabor based methods with the Gabor filters replaced by Discrete Wavelet Transform (DWT) (Wang et al., 1998), (Laine & Fan, 1993), (Arivazhagan & Ganesa, 2003), (Arivazhagan & Ganesa, 2003, 1), (Muneeswarana et al., 2005), (Kim & Kang, 2007), (Kokare et al., 2007), (Hiremath & Shivashankar, 2008). Since the DWT is shift variance, a shift in the signal degrades the performance of DWT based classifiers.
For the purpose of pattern discrimination, linear Fisher discriminant (Duda et al., 2001) can incorpo-rate feature extraction, dimensionality reduction and discrimination. However its linear optimal solution heavily depends on the assumption that the input patterns have equal covariance matrix. This assump-tion is usually not true for real data. To overcome this limitaassump-tion, a kernel version of the Fisher discrim-inant is recently developed for nonlinear discriminative feature extraction. The optimal solution of the kernel Fisher discriminant corresponds to the optimal Bayesian classifier which accounts for the mini-mization of the classification (Bayesian) error rate (Sch¨olkopf & Smola, 2002), (Mika et al., 1999). But these methods are computationally expensive.
Since the dual-tree complex wavelet transform (DT-CWT) (Kingsbury, 2001) is a special case of the Gabor filters with complex coefficients it has the directional advantages of the Gabor filters but requiring less computation. Furthermore, it is better than DWT as it is approximately shift invariance and has good directional selectivity in two dimensions. Thus, we propose a computationally efficient multiscale texture classifier using DT-CWT which exploits these advantages. The proposed multiscale texture classifier utilises the benefits of the multiresolution structure of DT-CWT for multiscale feature extraction.
The paper is organized as follows. Section 2 presents DT-CWT. Section 3 presents the proposed mul-tiscale texture classifier, and the learning and classification of texture features for different classes. The experimental results and discussions are presented in Section 4. Finally, Section 5 concludes the paper.
2. Dual-tree complex wavelet transform
Standard DWT’s suffer from shift dependence, i.e., the decomposition of image energy between levels of a multiscale decomposition can vary significantly if the original image is shifted prior to decomposition. In order to address the problem of shift variance, complex wavelets have been proposed. A complex wavelet is a set of two real wavelets with a 90◦ phase difference.
(a) (b) (c)
(d) (e) (f)
(g) (h) (i)
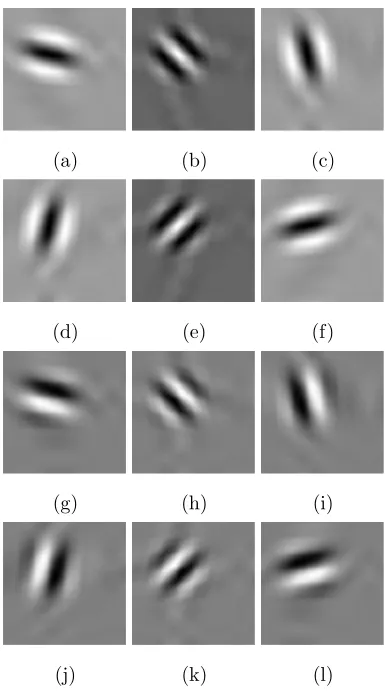
[image:4.595.199.393.90.436.2](j) (k) (l)
Fig. 1. The real and imaginary parts of the impulse response of the DT-CWT filters for the 6 directional subbands: (a) real,−15◦; (b) real,
−45◦; (c) real,−75◦; (d) real, 75◦; (e) real, 45◦; (f) real, 15◦; (g) imaginary,−15◦; (h) imaginary,−45◦; (i) imaginary,−75◦; (j) imaginary,
75◦; (k) imaginary, 45◦; and (l) imaginary, 15◦.
of the 2-dimensional DT-CWT at approximately±15◦,±45◦ and±75◦ (Kingsbury, 2001). The impulse
responses of the filters for the 6 directional subbands are shown in Fig. 1.
Since DT-CWT produces complex coefficients (Ri,s, Ci,s) for each directional subband at each scale, we
use the magnitude of the coefficients, i.e.,
Mi,s =
q R2
i,s+Ci,s2 (1)
wheresrefers to scale,i∈ {±15◦,±45◦,±75◦}is a set of 6 subbands andM
i,sis magnitude of the
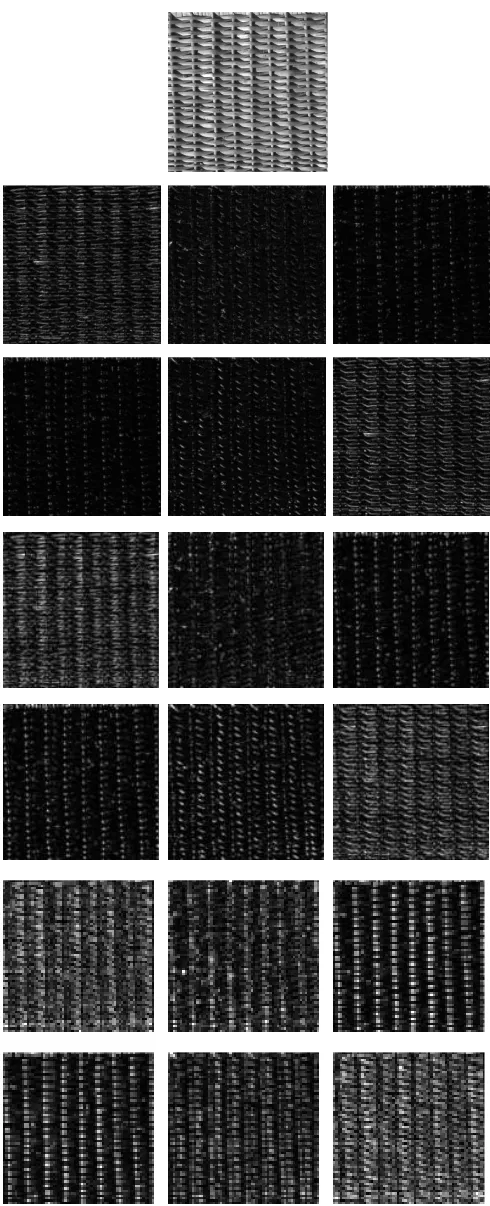
coeffi-cients of subbandiat scales. Fig. 2 shows a sample texture image from the MIT VisTex database (MIT Vison and Modeling Group, 1998) and itsMi,1,Mi,2andMi,3. For visualization purpose the magnitude of
all subbands have been normalized to [0,1].
3. The proposed texture classifier
Fig. 2. Magnitude of DT-CWT coefficients in 6 subbands for a texture sample (Fabric.0013) from the MIT VisTex database. The first image is the original image, the next 6 images are Mi,1, the following 6 images are Mi,2, and the final 6 images are Mi,3. For each group of 6
database to find the target texture class. The comparison between two feature vectors is performed using a modified Euclidean distance.
3.1. Feature extraction
Denote Mi,s(x, y) as the magnitude of complex coefficient in directional subband i and scale s, and
(x, y) is the spatial location for the corresponding subband with 1 ≤ x ≤ I , 1 ≤ y ≤ J. We define a variancevi,sand an entropyei,s(Laine & Fan, 1993) as the features forMi,s, i.e.,
µi,s=
1 IJ I X x=1 J X y=1
Mi,s(x, y) (2)
vi,s=
1 IJ I X x=1 J X y=1
(Mi,s(x, y)−µi,s)2 (3)
ei,s=−
1 IJ I X x=1 J X y=1
Mi,s(x, y)2log(Mi,s(x, y)2) (4)
The variancevi,sis used to measure the spread of the grey-level distribution. It is expected to be large
if the grey levels of the image are widely spread out. This feature is used to estimate the contrast of the texture. The entropyei,sis used to measure the randomness of the grey-level distribution. It is expected
to be high if the grey levels are distributed randomly throughout the image. More features can be used for texture classification (Laine & Fan, 1993), however we find that these two features are sufficient to produce a good performance.
The two features are extracted to form a feature vectorf~k,tfor test imagekfrom a known texture class
t, i.e.,
~ fk,t =
[~v±[a,b,c],1· · ·~v±[a,b,c],s~e±[a,b,c],1· · ·~e±[a,b,c],S] √
2S (5)
wherea= 15◦,b = 45◦,c= 75◦,Sis the number of scales used in DT-CWT, and
~v±[a,b,c],s =
[v−a,sv−b,sv−c,svc,s vb,sva,s]
q v2
−a,s+v−2b,s+v2−c,s+vc,s2 +vb,s2 +va,s2
(6)
~e±[a,b,c],s =
[e−a,se−b,se−c,sec,seb,sea,s]
q
e2−a,s+e2−b,s+e2−c,s+e2c,s+e2b,s+e2a,s
(7)
At each scale we extract 12 features, 6 for~v±[a,b,c],s and 6 for ~e±[a,b,c],s. Thus, f~k,t is a vector with 12S
elements.
3.2. Texture learning and classification using DT-CWT
In order to perform a supervised texture classification using DT-CWT, the following learning stage for the texture classifier is required:
(i) Decompose a training texture image usingSlevels of DT-CWT and normalize each subband by its energy;
(ii) For each scales, use Eq. (5) to generate the feature vector for each directional subband; (iii) Repeat steps (i) and (ii) for all sample images in the same texture class;
(iv) Generate the mean and variance of the featurelfor each texture classt, i.e.,fmt,landσt,l, respectively,
(v) Repeat the above steps for each different texture image in the training stage.
After the features have been learned for each texture class, the following classification stage is performed: (i) Decompose an unknown texture image using S levels of DT-CWT and extract its feature vector
using step (i) and (ii) of the learning stage, denoting the feature vector byf~u;
(ii) Calculate the distance betweenf~uand the mean feature vectorfm~
tof each classtusing
Dc = d(f~t, ~fmt) (8)
where d( ) is distance or discrimination function and
~
fmt = 1
L
L
X
k=1
~
fk,t (9)
whereLis the number of texture samples used in training;
(iii) Assign the unknown texture to texture class ˜tifD˜t< Dtfor all ˜t6=t.
The discrimination function is
d(f~u, ~fmt) =
12S
X
l=1
(fu
l −fmt,l)2
σt,l
(10)
wherefu
l is the featurelof the test image, andσt,lis the standard deviation of the featurefmt,l. Eq. (10)
means that features with small variances are more informative than features with high variances, and thus it enhances features with small variances and degrades those with high variances.
4. Experimental results and discussion
The effectiveness of the proposed texture feature extraction approach to texture classification is evalu-ated by performing supervised classification of several test images with varying texture complexities from two commonly-used natural texture image databases: MIT VisTex database (MIT Vison and Modeling Group, 1998) and Brodatz album (Brodatz, 1966). Each texture image has a size of 512×512, with 256 grey levels. Each image is globally histogram equalized and normalized to [-1,1] to ensure that the tex-tures are not trivially discriminable simply based on the local mean or local variance. Different portions of the input patterns of each texture class are selected and used for training the texture classifier. We avoid using the texture patterns on a texture border for training because these patterns are not representative of the texture.
Twelve images containing similar textural patterns (thus making classification more difficult) from each of the MIT VIS-Tex database and Brodatz album as respectively shown in Fig. 3 and Fig. 4 are used. A hybrid texture database is formed by including all the twenty-four texture samples from both databases. Each texture image is divided into two non-overlapping parts of size 256×512, one for training and one for testing. Overlapped samples are generated from the training texture images using a sliding window of sizeK×K which is moved with shifts of ∆ in both the horizontal and vertical directions. The number of test samples varies with the value of ∆. The value of ∆ is set to 4 to give a reasonable overlap between two test samples, thus a total of 3072 texture samples are used in training for each class. After training, another 3072 samples are used to evaluate the performance of the texture classifier.
The performance of a texture classifier is measured using a confusion matrix (Kohavi & Provost, 1998)
CM.CMis aL×Lmatrix forLdifferent texture classes andCM(i, j) refers to the classification rate
when samples from classiare identified as classj. Two figure of merits are used in conjunction withCM:
average correct classification rateaccrand average false classification rateaf cr, where
accr = 1
L X
∀(i,j),i=j
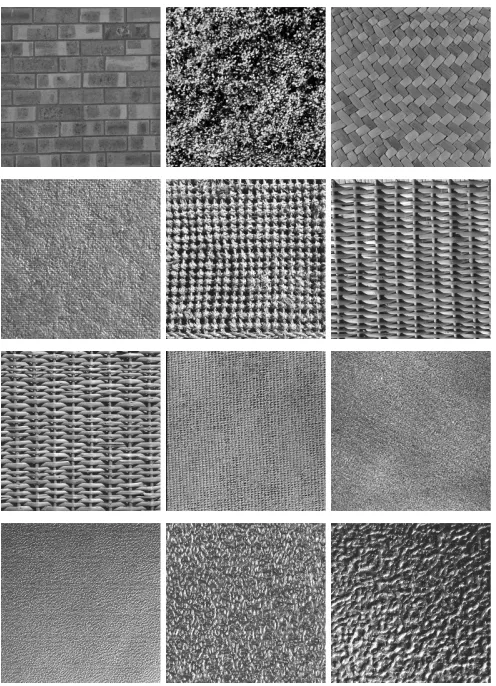
Fig. 3. Texture samples from the MIT VisTex database: Brick.0001 (m1); Leaves.0003 (m2); Fabric.0001 (m3); Fabric.0007 (m4); Fabric.0009
(m5); Fabric.0013 (m6); Fabric.0014 (m7); Fabric.0017 (m8); Fabric.0018 (m9); Metal.0001 (m10); Metal.0002 (m11); and Metal.0005 (m12).
af cr = 1
L×(L−1)
X
∀(i,j),i6=j
CM(i, j) (12)
We performed experiments to evaluate the effects of the number of scalesS and Gaussian noise on the proposed multiscale texture classifier using DT-CWT. In order to make comparisons with DWT, the same structure of the proposed multiscale texture classifier is applied to DWT where the features are extracted from the high-pass subbands. DWT produces three subbands at each scale which are directional at 0◦,
45◦and 90◦. The same features as in Eq. (3) and (4) are used for each directional subband. For each scale
and forS levels of DTW, 6 (i.e., 3×2) features are extracted, giving a total of 6Sfeatures.
In general DWT based texture feature descriptors use similar features as defined in Eq. (3) and (4) but with different formulations, e.g., (Arivazhagan & Ganesa, 2003), (Arivazhagan & Ganesa, 2003, 1), (Muneeswarana et al., 2005). Thus, if we show that our proposed feature vector performs better in DT-CWT than in DWT, then it is highly expected that if the features used in DWT based classifiers are employed in our DT-CWT based multiscale classifier then they will also perform better.
4.1. The effects of the number of scales
Using the images from the MIT VisTex database (MIT Vison and Modeling Group, 1998), the first experiment determines the effects of the number of scalesSused for the feature vectorf~k,t. The top half
of Table 1 shows the confusion matrices for different values ofS. The results for the MIT VisTex database in Table 2 shows that the accr forS = 1 is 94.8% while theaf cr is as high as 0.5%. When S = 2 the
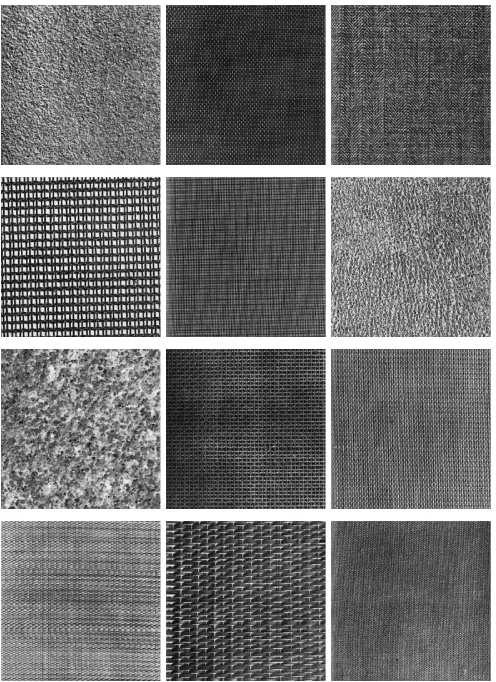
Fig. 4. Texture samples from the Brodatz album: D4 (b1); D6 (b2); D17 (b3); D20 (b4); D21 (b5); D24 (b6); D28 (b7); D52 (b8); D53 (b9);
D55 (b10); D65 (b11); and D77 (b12).
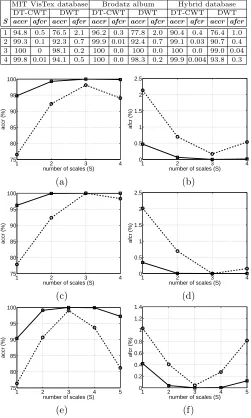
where the accr andaf cr are respectively 100% and 0%. Fig. 5 (a) and (b) respectively show with solid lines the accr andaf cr with respect to the number of scales used. It is clear thatS = 3 gives the best correct classification with low false classification.
The same test is applied to the twelve images from the Brodatz album (Brodatz, 1966) as shown in Fig. 4. The lower half of Table 1 shows the confusion matrices for different values ofS. The results for the Brodatz album in Table 2 shows that theaccr for S = 1,2,3 are respectively 96.2%, 99.9% and 100%. The af cr forS = 1,2,3 are respectively 0.3%, 0.01% and 0%. The accr and af cr with respect to the number of scales used are shown with solid lines in Fig. 5 (c) and (d), respectively. It is clear thatS = 3 gives the best correct classification with low false classification.
The confusion matrices for the DWT are shown in Table 3 for the two test sets of images. The results when compared with those of the DT-CWT based classifier (as shown in Table 2) show that the discrim-ination power of DT-CWT is higher than DWT. The overall classification of DT-CWT and DWT with respect to the number of scales used are shown in Fig. 5. It is clear from Fig. 5 and Table 2 that the DT-CWT based texture classifier outperforms the DWT based texture classifier by having highaccrand low
af crfor both sets of texture images. The exception occurs whenS = 3 for the Brodatz album where the performance of both algorithms are the same.
Table 1
Confusion matrices for DT-CWT for different number of scales usedSon texture samples of classmnfrom the MIT VisTex database and
of classbnfrom the Brodatz album with ∆ = 4, i.e., 3072 training and test samples.
MIT VisTex database
S=1 m1 m2 m3 m4 m5 m6 m7 m8 m9 m10 m11 m12
m1 100 0 0 0 0 0 0 0 0 0 0 0
m2 1.6 97.3 0 0 0 0 0 1.2 0 0 0 0
m3 0 0 99.6 0 0 0 0 0 0 0 0 0.4
m4 4.4 0 0 95.6 0 0 0 0 0 0 0 0
m5 0 0 0 0 82.6 0 0 0 17.4 0 0 0
m6 0 0 0 0 0 100 0 0 0 0 0 0
m7 0 0 0 0 0 0 100 0 0 0 0 0
m8 0 0 0 0 0 0 0 100 0 0 0 0
m9 0 0 0 0 0 0 0 0 62.8 0 37.2 0
m10 0 0 0 0 0 0 0 0 0 100 0 0
m11 0 0 0 0 0 0 0 0 0 0 100 0
m12 0 0 0 0 0 0 0 0 0 0 0 100
S=2 m1 m2 m3 m4 m5 m6 m7 m8 m9 m10 m11 m12
m1 100 0 0 0 0 0 0 0 0 0 0 0
m2 0 100 0 0 0 0 0 0 0 0 0 0
m3 0 0 100 0 0 0 0 0 0 0 0 0
m4 0 0 0 100 0 0 0 0 0 0 0 0
m5 0 0 0 0 100 0 0 0 0 0 0 0
m6 0 0 0 0 0 100 0 0 0 0 0 0
m7 0 0 0 0 0 0 100 0 0 0 0 0
m8 0 0 0 0 0 0 0 100 0 0 0 0
m9 0 0 0 0 0 0 0 0 100 0 0 0
m10 0 0 0 0 0 0 0 0 0 91.5 0 8.5
m11 0 0 0 0 0 0 0 0 0 0 100 0
m12 0 0 0 0 0 0 0 0 0 0 0 100
S=3 m1 m2 m3 m4 m5 m6 m7 m8 m9 m10 m11 m12
m1 100 0 0 0 0 0 0 0 0 0 0 0
m2 0 100 0 0 0 0 0 0 0 0 0 0
m3 0 0 100 0 0 0 0 0 0 0 0 0
m4 0 0 0 100 0 0 0 0 0 0 0 0
m5 0 0 0 0 100 0 0 0 0 0 0 0
m6 0 0 0 0 0 100 0 0 0 0 0 0
m7 0 0 0 0 0 0 100 0 0 0 0 0
m8 0 0 0 0 0 0 0 100 0 0 0 0
m9 0 0 0 0 0 0 0 0 100 0 0 0
m10 0 0 0 0 0 0 0 0 0 100 0 0
m11 0 0 0 0 0 0 0 0 0 0 100 0
m12 0 0 0 0 0 0 0 0 0 0 0 100
Brodatz album
S=1 b1 b2 b3 b4 b5 b6 b7 b8 b9 b10 b11 b12
b1 100 0 0 0 0 0 0 0 0 0 0 0
b2 0 59.1 29.7 0 11.2 0 0 0 0 0 0 0
b3 0 0 96.0 0 0 0 0 4.0 0 0 0 0
b4 0 0 0 100 0 0 0 0 0 0 0 0
b5 0 0 0 0 100 0 0 0 0 0 0 0
b6 0 0 0 0 0 100 0 0 0 0 0 0
b7 0 0 0 0 0 0 100 0 0 0 0 0
b8 0 0 0 0 0 0 0 100 0 0 0 0
b9 0 0 0 0 0 0 0 0 100 0 0 0
b10 0 0 0 0 0 0 0 0 0 100 0 0
b11 0 0 0 0 0 0 0 0 0 0.3 99.7 0
b12 0 0 0 0 0 0 0 0 0 0 0 100
S=2 b1 b2 b3 b4 b5 b6 b7 b8 b9 b10 b11 b12
b1 100 0 0 0 0 0 0 0 0 0 0 0
b2 0 100 0 0 0 0 0 0 0 0 0 0
b3 0 0 99.2 0 0 0 0.4 0.4 0 0 0 0
b4 0 0 0 100 0 0 0 0 0 0 0 0
b5 0 0 0 0 100 0 0 0 0 0 0 0
b6 0 0 0 0 0 100 0 0 0 0 0 0
b7 0 0 0 0 0 0 100 0 0 0 0 0
b8 0 0 0 0 0 0 0 100 0 0 0 0
b9 0 0 0 0 0 0 0 0 100 0 0 0
b10 0 0 0 0 0 0 0 0 0 100 0 0
b11 0 0 0 0 0 0 0 0 0 0 100 0
b12 0 0 0 0 0 0 0 0 0 0 0 100
S=3 b1 b2 b3 b4 b5 b6 b7 b8 b9 b10 b11 b12
b1 100 0 0 0 0 0 0 0 0 0 0 0
b2 0 100 0 0 0 0 0 0 0 0 0 0
b3 0 0 100 0 0 0 0 0 0 0 0 0
b4 0 0 0 100 0 0 0 0 0 0 0 0
b5 0 0 0 0 100 0 0 0 0 0 0 0
b6 0 0 0 0 0 100 0 0 0 0 0 0
b7 0 0 0 0 0 0 100 0 0 0 0 0
b8 0 0 0 0 0 0 0 100 0 0 0 0
b9 0 0 0 0 0 0 0 0 100 0 0 0
b10 0 0 0 0 0 0 0 0 0 100 0 0
b11 0 0 0 0 0 0 0 0 0 0 100 0
Table 2
Classification rates of the proposed classifier in (%) using DT-CWT and DWT for the MIT VisTex database, the Brodatz album, and the Hybrid database.
MIT VisTex database Brodatz album Hybrid database
DT-CWT DWT DT-CWT DWT DT-CWT DWT
S accr afcr accr afcr accr afcr accr afcr accr afcr accr afcr
1 94.8 0.5 76.5 2.1 96.2 0.3 77.8 2.0 90.4 0.4 76.4 1.0
2 99.3 0.1 92.3 0.7 99.9 0.01 92.4 0.7 99.1 0.03 90.7 0.4
3 100 0 98.1 0.2 100 0.0 100 0.0 100 0.0 99.0 0.04
4 99.8 0.01 94.1 0.5 100 0.0 98.3 0.2 99.9 0.004 93.8 0.3
1 2 3 4 75 80 85 90 95 100
number of scales (S)
accr (%)
1 2 3 4 0 0.5 1 1.5 2 2.5
number of scales (S)
afcr (%)
(a) (b)
1 2 3 4 75 80 85 90 95 100
number of scales (S)
accr (%)
1 2 3 4 0 0.5 1 1.5 2 2.5
number of scales (S)
afcr (%)
(c) (d)
1 2 3 4 5 75 80 85 90 95 100
number of scales (S)
accr (%)
1 2 3 4 5 0 0.2 0.4 0.6 0.8 1 1.2 1.4
number of scales (S)
afcr (%)
(e) (f)
Fig. 5. Comparison between the classification rates of DT-CWT (solid lines) and DWT (dashed lines) for different databases: (a) average correct classification for the MIT VisTex database; (b) average false classification for the MIT VisTex database; (c) average correct classification for the Brodatz album; (d) average false classification for the Brodatz album; (e) average correct classification for the Hybrid database; and (f) average false classification for the Hybrid database.
features or use non-decimated wavelet transform. The effect of this phenomenon and the effectiveness of the proposed classifier for inter-database discrimination are evaluated on the Hybrid texture database. The results are shown in Fig. 5 (e) foraccr, Fig. 5 (f) foraf crand in Table 2. It is clear from Fig. 5 (e) and (f) that the proposed classifier in DT-CWT domain outperforms the proposed classifier in DWT domain. It is noticeable that, the proposed classifier in DT-CWT domain does not degrades its performance as much as in DWT domain while S increases. The proposed classifier provides 100% performance when
S = 3 but the performance degrades forS >4.
4.2. The effects of noise
Table 3
Confusion matrices for DWT for different number of scales used Son texture samples of classmnfrom the MIT VisTex database and of
classbnfrom the Brodatz album with ∆ = 4, i.e., 3072 training and test samples.
MIT VisTex database
S=1m1 m2 m3 m4 m5 m6 m7 m8 m9m10m11m12
m1 79.9 0 0 0 0.4 0 0 19.7 0 0 0 0
m2 0 100 0 0 0 0 0 0 0 0 0 0
m3 0 0 100 0 0 0 0 0 0 0 0 0
m4 0 0 0 100 0 0 0 0 0 0 0 0
m5 0 0 0 0 17.2 0 0 0 53.0 29.8 0 0
m6 0 0 0 0 0 76.8 23.0 0.1 0 0 0 0
m7 0 0 0 0 0 0 100 0 0 0 0 0
m8 88.0 0 0 0 0 0 0 12.0 0 0 0 0
m9 0 0 0 0 0 0 0 0 100 0 0 0
m10 0 0 0 0 0 0 0 0 57.8 42.2 0 0
m11 0 0 0 0 0 0 0 0 0 0 100 0
m12 0 0 0 0 0 0 0 0 9.0 0 0.7 90.4
S=2m1 m2 m3 m4 m5 m6 m7 m8 m9m10m11m12
m1 85.0 0 0 0 0 0 0 15.0 0 0 0 0
m2 0 100 0 0 0 0 0 0 0 0 0 0
m3 0 0 99.2 0 0 0 0 0 0 0.8 0 0
m4 0 0 0 100 0 0 0 0 0 0 0 0
m5 0 0 0 0 100 0 0 0 0 0 0 0
m6 0 0 0 0 0 91.1 8.9 0 0 0 0 0
m7 0 0 0 0 0 0 100 0 0 0 0 0
m8 0.4 0 0 0 0 0 0 99.6 0 0 0 0
m9 0 0 0 0 0 0 0 0 100 0 0 0
m10 0 0 0 0 0 0 0 0 67.1 32.9 0 0
m11 0 0 0 0 0 0 0 0 0 0 100 0
m12 0 0 0 0 0 0 0 0 0 0 0 100
S=3m1 m2 m3 m4 m5 m6 m7 m8 m9m10m11m12
m1 100 0 0 0 0 0 0 0 0 0 0 0
m2 0 100 0 0 0 0 0 0 0 0 0 0
m3 0 0 100 0 0 0 0 0 0 0 0 0
m4 0 0 0 100 0 0 0 0 0 0 0 0
m5 0 0 0 0 100 0 0 0 0 0 0 0
m6 0 0 0 0 0 100 0 0 0 0 0 0
m7 0 0 0 0 0 8.6 91.4 0 0 0 0 0
m8 1.6 0 0 0 0 0 0 98.4 0 0 0 0
m9 0 0 0 0 0 0 0 0 100 0 0 0
m10 0 0 0 0 0 0 0 0 0 100 0 0
m11 0 0 0 0 0 0 0 0 0 0 100 0
m12 0 0 0 0 12.2 0 0 0 0 0 0 87.8
Brodatz album
S=1 b1 b2 b3 b4 b5 b6 b7 b8 b9 b10 b11 b12
b1 39.3 0 0 0 0 0 4.3 20.7 0 0 0 35.7
b2 0 28.9 71.0 0 0.1 0 0 0 0 0 0 0
b3 0 0 100 0 0 0 0 0 0 0 0 0
b4 0 0 0 100 0 0 0 0 0 0 0 0
b5 0 0 0 0 100 0 0 0 0 0 0 0
b6 0 0 0 0 0 100 0 0 0 0 0 0
b7 24.3 0 0 0 0 0 34.4 0 0 0 0 41.3
b8 13.5 0 0 0 0 0 0.1 86.3 0 0 0 0
b9 0 0 0 0 0 0 0 0 100 0 0 0
b10 0 0 0 0 0 0 0 0 0 100 0 0
b11 0 0 0 0 0 0 0 0 0 0 100 0
b12 16.9 0 0 0 0 0 34.1 3.6 0 0 0 45.3
S=2 b1 b2 b3 b4 b5 b6 b7 b8 b9 b10 b11 b12
b1 99.9 0 0 0 0 0 0.1 0 0 0 0 0
b2 0 100 0 0 0 0 0 0 0 0 0 0
b3 0 0 100 0 0 0 0 0 0 0 0 0
b4 0 0 0 100 0 0 0 0 0 0 0 0
b5 0 0 0 0 100 0 0 0 0 0 0 0
b6 0 0 0 0 0 100 0 0 0 0 0 0
b7 0 0 0 0 0 0 99.3 0 0 0 0 0.7
b8 0 0 0.1 0 0 0 83.5 16.1 0 0 0 0.3
b9 0 0 0 0 0 0 0 0 100 0 0 0
b10 0 0 0 0 0.5 0 0 0 0 93.6 5.9 0
b11 0 0 0 0 0 0 0 0 0 0 100 0
b12 0 0 0.4 0 0 0 0 0 0 0 0 99.6
S=3 b1 b2 b3 b4 b5 b6 b7 b8 b9 b10 b11 b12
b1 100 0 0 0 0 0 0 0 0 0 0 0
b2 0 100 0 0 0 0 0 0 0 0 0 0
b3 0 0 100 0 0 0 0 0 0 0 0 0
b4 0 0 0 100 0 0 0 0 0 0 0 0
b5 0 0 0 0 100 0 0 0 0 0 0 0
b6 0 0 0 0 0 100 0 0 0 0 0 0
b7 0 0 0 0 0 0 100 0 0 0 0 0
b8 0 0 0 0 0 0 0 100 0 0 0 0
b9 0 0 0 0 0 0 0 0 100 0 0 0
b10 0 0 0 0 0 0 0 0 0 100 0 0
b11 0 0 0 0 0 0 0 0 0 0 100 0
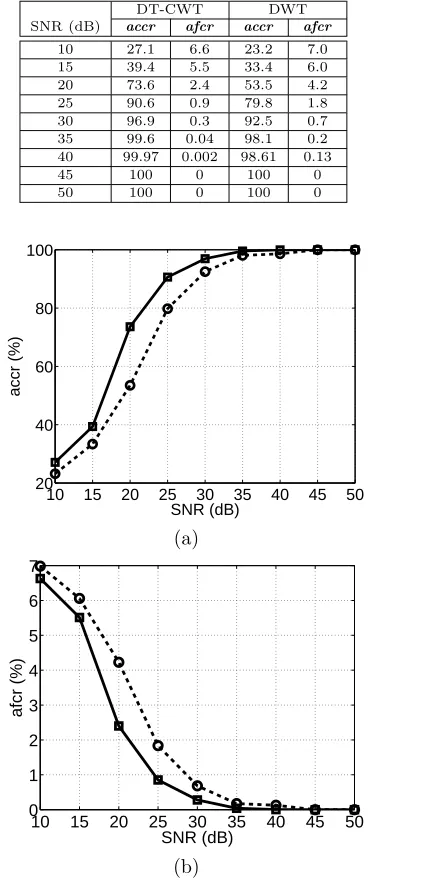
Table 4
The average classification rates in (%) of DT-CWT and DWT in the present of various noise levels for the Brodatz album whenS= 3.
DT-CWT DWT
SNR (dB) accr afcr accr afcr
10 27.1 6.6 23.2 7.0
15 39.4 5.5 33.4 6.0
20 73.6 2.4 53.5 4.2
25 90.6 0.9 79.8 1.8
30 96.9 0.3 92.5 0.7
35 99.6 0.04 98.1 0.2
40 99.97 0.002 98.61 0.13
45 100 0 100 0
50 100 0 100 0
10 15 20 25 30 35 40 45 50 20
40 60 80 100
SNR (dB)
accr (%)
(a)
10 15 20 25 30 35 40 45 50 0
1 2 3 4 5 6 7
SNR (dB)
afcr (%)
(b)
Fig. 6. Comparison between the classification rates of DT-CWT (solid lines) and DWT (dashed lines) in the present of various noise levels for the Brodatz album whenS= 3: (a) average correct classification rate; and (b) average false classification rate.
against the noisy test images. The afore mentioned procedure to create the training and test databases is used with the noisy test images. At each noise level, the experiment is repeated 5 times and the average of the 5 results is taken as the performance of the classifier.
5. Conclusion
In this paper we propose a novel algorithm for texture classification using DT-CWT. The proposed texture classifier achieves an average correct classification rate of 100% and an average false classification rate of 0% forS = 3 on two sets of texture samples of varying complexities and a hybrid test set. This performance shows that the proposed variance and entropy as features of the magnitude of the DT-CWT complex coefficients in 6 directional subbands for 3 scales are good candidates for texture classification. The proposed classifier utilises the benefits of multiscale structure of DT-CWT. The performance of the proposed classifier has also been shown to be robust against noise. The multiscale structure of the proposed classifier not only makes it robust against noise but also improves its ability to make better discrimination between textures.
We also compared the performance of the proposed DT-CWT classifier with the DWT based classifier, and show that the former outperforms the latter by achieving high correct classification rate and low false classification rate. Furthermore, the proposed classifier is more robust against noise in DT-CWT domain than DWT domain.
In this study, we have only used two simple but effective features for texture classification. The spatial information of textures can be used to further improve the performance of the classifier, which will be our future work. We also expect that including the phase information of DT-CWT will improve the classification. Furthermore, we have not employed any feature selection prior to classification. We expect that the feature selection procedure by employing PCA or ICA (Duda et al., 2001) will improve the performance of the proposed texture classifier on larger databases. This will also be our future work.
Acknowledgments
The authors would like to thank Warwick University Vice Chancellor Scholarship for providing the funds for this research.
References
Arivazhagan, S., Ganesan, L., 2003. Texture classification using wavelet transform. Pattern Recognit. Letts. 24, 1513–1521.
Arivazhagan, S., Ganesan, L., 2003 (1). Texture segmentation using wavelet transform. Pattern Recognit. Letts. 24, 3197-3203.
Arivazhagan, S., Ganesan, L., Padam Priyal, S., 2006. Texture classification using Gabor wavelets based rotation invariant features. Pattern Recognit. Letts. 27, 1976–1982.
Brodatz, P. 1966. Textures: A Photographic Album for Artists and Designers. Dover, New York, USA. http://www.ux.his.no/∼tranden/brodatz.html.
Cariou, C., Chehdi, J., 2008. Unsupervised texture segmentation/classification using 2-D autoregressive modeling and the stochastic expectation-maximization algorithm. Pattern Recognit. Letts. 29, 905– 917.
Cohen, F., Fan, Z., Patel, M., 1991. Classifcation of rotated and scaled textured images using gaussian markov random field models. IEEE Trans. Pattern Anal. Mach. Intell. 13 (2), 192–202.
Duda, R.O., Hart, P.E., Stork, D.G., 2001. Pattern Classification (2nd ed.). John Wiley and Sons. Faugeras, O., 1978. Texture analysis and classification using a human visual model. In: Proc. IEEE Int.
Conf. Pattern Recognit., 549–552, 1978.
Hiremath, P.S., Shivashankar, S., 2008. Wavelet based co-occurrence histogram features for texture clas-sification with an application to script identification in a document image. Pattern Recognit. Letts. 29, 1182–1189.
Jain, A., Farrokhnia, F., 1991. Unsupervised texture segmentation using Gabor filters. Pattern Recognit. 24 (12), 1167–1186.
Jain, A. Karu, K., 1996. Learning texture discrimination masks. IEEE Trans. Pattern Anal. Mach. Intell. 18 (2), 195–205.
Julesz, B., 1962. Visual pattern discrimination. IRE Trans. on Information Theory 8 (2), 84-92.
Julesz, B., Gilbert, E.N., Shepp, L.A., Frisch, H.L., 1973. Inability of humans to discriminate between visual textures that agree in second-order statistics – revisited. Perception 1 (2) , 391–405.
Kim, S.C., Kang, T.J., 2007. Texture classification and segmentation usingwavelet packet frame and Gaussian mixture model. Pattern Recognit. 40, 1207–1221.
Kingsbury, N.G., 2001. Complex wavelets for shift invariant analysis and filltering of signals. Journal of Applied and Computational Harmonic Analysis 3, 234–253.
Kohavi, R., Provost, F., 1998. Glossary of Terms. Machine Learning 30 (2/3), 271–274.
Kokare, M., Biswas, P.K., Chatterji, B.N., 2007. Texture image retrieval using rotated wavelet filters. Pattern Recognit. Letts. 28, 1240–1249.
Laine, A., Fan, J., 1993. Texture classification by wavelet packet signatures. IEEE Trans. Pattern Anal. Mach. Intell. 15 (11), 1186–1191.
Liu, F., Picard, R., 1996. Periodicity, directionality, and randomness: Wold features for image modeling and retrieval. IEEE Trans. Pattern Anal. Mach. Intell. 18 (7), 722–733.
Mika, S., R¨atsch, G., Weston, J., Sch¨olkopf, B., M¨uller, K.R., 1999. Fisher discriminant analysis with kernels. In: Proceedings of the 1999 IEEE Signal Processing Society Workshop, 41–48.
MIT Vision and Modelling Group, 1998. http://www.media.mit.edu/vismod/.
Muneeswarana, K., Ganesanb, L., Arumugamc, S., Soundara, K.R., 2005. Texture classification with combined rotation and scale invariant wavelet features. Pattern Recognit. 38, 1495–1506.
Randen, T., Husoy, J., 1999. Filtering for texture classification: A comparative study. IEEE Trans. Pattern Anal. Mach. Intell. 21 (4), 291–310.
Sch¨olkopf, B., Smola, A.J., 2002. Learning with Kernels: Support Vector Machines, Regularization, Op-timization and Beyond. Cambridge, MA: MIT Press.
Tuceryan, M., Jain, A., 1993. Texture analysis. In: Handbook of Pattern Recognition and Computer Vision, Chen, C., Pau, L., Wang, P. (Eds.). Singapore: World Scientific, 235–276.