ISSN Online: 2327-4344 ISSN Print: 2327-4336
DOI: 10.4236/gep.2019.76010 Jun. 27, 2019 115 Journal of Geoscience and Environment Protection
Human Comfort Instrument Design
Based on Embedded
Shucheng Chen, Jing Shi
*, Xiaobo Li, Ming Cui, Lianwei Su
Tianjin Meteorological Observation Centre, Tianjin, China
Abstract
The traditional human comfort meter has the following defects: the interface is not uniform; the operation is cumbersome and complicated; the interface is unfriendly, and the stability and adaptability are poor. This paper presents a design scheme for human comfort instrument based on embedded system, using S3C2440 embedded development board and the sensors to collect the real-time temperature, relative humidity and wind speed data and to process the collecting data; then obtaining the human body comfort value according to the basic algorithm of human body comfort instrument; giving the human comfort conclusion according to the diastolic index range of human comfort, and showing the temperature and humidity, wind speed, comfort value and conclusion through writing the Qt graphical user interface program. At the same time, the human comfort instrument has the data storage function. The human comfort instrument is high in integration, strong in real time, high in sensitivity, stable and reliable, and it meets the development goals of the in-telligent meteorological service, and meets the demand of the meteorological service that is closer to life, and it has broad development prospect.
Keywords
Human Comfort Instrument, Embedded, S3C2440, Qt
1. Introduction
Human comfort is a comprehensive reflection of the human body’s meteorolog-ical elements such as temperature, relative humidity and wind speed, and is a requirement for higher quality meteorological services. The human comfort in-dex is a meteorological indicator defined by the heat exchange between the hu-man and the meteorological environment from the meteorological point of view to evaluate the comfort of the human body in different meteorological
environ-How to cite this paper: Chen, S. C., Shi, J., Li, X. B., Cui, M., & Su, L. W. (2019). Hu-man Comfort Instrument Design Based on Embedded. Journal of Geoscience and Environment Protection, 7, 115-124. https://doi.org/10.4236/gep.2019.76010
Received: November 26, 2018 Accepted: June 24, 2019 Published: June 27, 2019
Copyright © 2019 by author(s) and Scientific Research Publishing Inc. This work is licensed under the Creative Commons Attribution International License (CC BY 4.0).
DOI: 10.4236/gep.2019.76010 116 Journal of Geoscience and Environment Protection
ments (Moustris et al., 2018). Foreign experts and scholars have laid a good foundation for the study of human comfort. Takaya et al. (2017) proposed rea-listic temperature based on the cold and hot feelings of the human body under different meteorological conditions; Wallace et al. (2017) studied and proposed the concept of discomfort index, according to the study by the National Weather Service. Regarding forecast summer comfort and working hours; Mostafavi
Te-hrani et al. (2017) proposed the sensible temperature theory, he considered the
heat exchange in the meteorological environment, and calculated the somato-sensory temperature model. Domestic experts and scholars started late on the study of human comfort. Slater et al. (2017) proposed the “Climate comfort evaluation model”; Zhu et al. (2014) analyzed the spatial and temporal distribu-tion trend of Hulunbeier human comfort index.
The physiological functions of the human body are affected by various me-teorological factors (Li et al., 2016), such as temperature, relative humidity, air pressure, duration of illumination, wind speed and wind direction. Relevant re-search shows that the three meteorological elements of temperature, relative humidity and wind speed have the greatest impact on human comfort. The hu-man comfort index is a nonlinear equation composed of these three meteoro-logical elements. The equation is derived from the Beijing Meteorometeoro-logical Bu-reau since 1997. In 2013, the Meteorological Department of Guangdong Prov-ince of China developed a “Bio Comfort Measuring Instrument” that reflects the human comfort index (Kai et al., 2014). The comfort measuring instrument con-sists of sensors, digital collectors, fully automatic water supply systems, and power supply systems. Guangdong Province has begun pilot deployment, and plans to cover 80 to 90 bio-comfort measuring instruments covering the whole province. This “bio-comfort measuring instrument”, which reflects the human comfort index, is the first in the country of the scientific research team of the Guangdong Provincial Meteorological Bureau. It has been piloted in Guangzhou and Shenzhen in 2013. As a highlight of Guangdong’s pilot project for the con-struction of meteorological modernization pilots and people’s livelihood servic-es, the provincial meteorological department plans to deploy such measuring in-struments in the observation fields of cities and counties throughout the ince in 2014, initially forming 80 to 90 sites, covering the comfort of the prov-ince. The monitoring network will further refine the layout to more hot spots of public concern. Regarding the human comfort index prediction model used
(Peng et al., 2011), the human comfort meter designed in this paper is to use the
model as the basic algorithm.
The IEEE defines an embedded system as a device for controlling, monitoring, or assisting in the operation of machines and equipment (Wang et al., 2015;
Chen et al., 2013). Embedded systems consist of embedded processors, operating
DOI: 10.4236/gep.2019.76010 117 Journal of Geoscience and Environment Protection
The traditional human comfort meter has the following defects: the interface is not uniform, the operation is cumbersome and complicated, the interface is unfriendly, and the stability and adaptability are poor. In order to effectively make up for the above defects, this paper newly designs a human comfort meter based on embedded technology. It uses the embedded development board to connect the temperature and humidity and wind speed sensors. The data is col-lected in real time through the LCD screen and gives the conclusion of comfort.
2. Overall Design of Human Comfort Meter
2.1. Functional Requirements Analysis
Preliminary design of a human comfort meter based on real-time operating sys-tem, using embedded development board and sensor to collect the temperature, relative humidity and wind speed data of the location in real time, and process the acquired data, and obtain the human body according to the basic algorithm model of human comfort. The comfort value is finally given according to the range of human comfort indicators. The temperature, humidity, wind speed, comfort value and conclusion result are displayed on the LCD screen. At the same time, the human comfort meter has data storage function and can expand the alarm function.
2.2. System Design
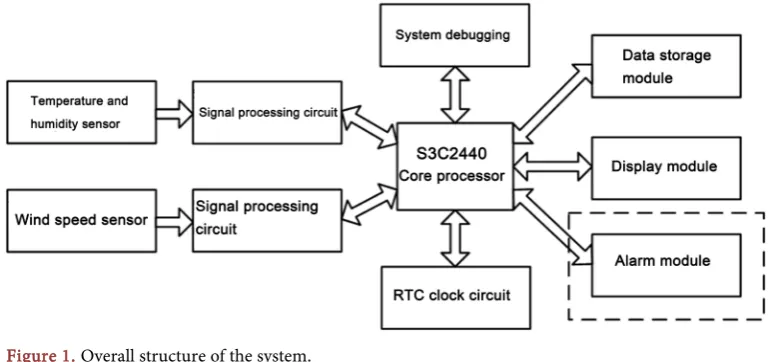
According to the functions that the human comfort meter needs to implement, the overall structural block diagram of the system is shown in Figure 1. The sys-tem is mainly composed of a core processor module, a sensor module, a signal acquisition and processing module, an RTC clock circuit, a debugging module, a data storage module and a display module, and can expand the alarm module.
[image:3.595.155.540.540.721.2]The temperature and humidity sensor and the wind speed sensor collect tem-perature, relative humidity and wind speed data, and after processing by the signal processing circuit, finally enter the S3C2440 core processor module, and the processor applies the basic algorithm of the human comfort meter to process
DOI: 10.4236/gep.2019.76010 118 Journal of Geoscience and Environment Protection
the obtained data, and finally outputs the processing. After the temperature, rel-ative humidity, wind speed, human comfort value and conclusion, the display program of the system is called to display. The RTC clock circuit is designed to provide accurate and reliable system time for the system to ensure the system has good real-time performance; the data storage module is used to save the data collected and processed by the system; the system debugging module is used for downloading and debugging the system program; the alarm module as an ex-tended function, it can expand the sound and light alarm or increase the GSM module to send SMS alarms.
The main features of the human comfort meter designed in this paper are low power consumption, miniaturization, high precision measurement and rich ex-pandability. In order to achieve the above features, the system uses Samsung’s 32-bit RISC microprocessor S3C2440, which uses ARM920t core, has 0.13 mi-cron COMS standard macro unit and memory unit and new bus architecture
(Xia & Niu, 2011); provides 1 channel LCD dedicated DMA, 4-channel PWM
timer and 1-channel internal timer/watchdog timer, 8-channel 10-bit ADC and touch screen interface, 130 general purpose I/O ports and 24-channel external interrupt source, powered by 1.2 V core and 3.3 V external I/O supply, ideal for processing embedded applications that require high integration and low power consumption.
Embedded software is an integral part of embedded systems, including em-bedded operating systems and development tools. The emem-bedded software sys-tem design mainly includes the following parts:
1) Initialization of the human comfort meter, preparation of the system star-tup code;
2) The migration of the embedded operating system, the kernel is tailored and configured according to the design requirements of the system;
3) The realization of the basic functions of the system, processing the data collected by the sensor and outputting;
4) Develop a graphical user interface using Qt Embedded and cross-compilation to display real-time data and human comfort conclusions.
3. System Hardware Design
3.1. Human Comfort Meter Temperature and
Humidity Acquisition Circuit Design
DOI: 10.4236/gep.2019.76010 119 Journal of Geoscience and Environment Protection
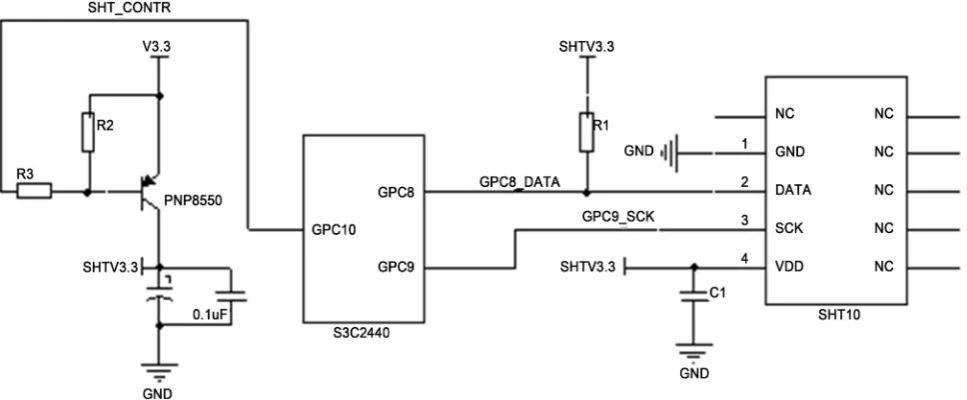
Figure 2. Human comfort meter temperature and humidity acquisition circuit.
The SHT10 is a temperature and humidity composite sensor with a calibrated digital signal output (Li & Shi, 2011). It uses industrial CMOS process micro-machining technology to make the sensor highly reliable and stable. The sensor consists of a bandgap temperature measuring element, a capacitive tempera-ture measuring element, a 14-bit A/D converter and a serial interface circuit. The SHT10 sensor is accurately calibrated at the factory, and the calibration coefficient is stored in the OTP memory. In the process, the sensor needs to call the calibration coefficient (Ma et al., 2013) during the signal detection process. The sensor has excellent quality, ultra-fast response, strong an-ti-interference ability and high cost performance, which is very suitable for this design.
The SHT10 temperature and humidity sensor has a temperature resolution of 0.01˚C, a repeatability of ±0.1˚C, a relative humidity resolution of 0.03%
DOI: 10.4236/gep.2019.76010 120 Journal of Geoscience and Environment Protection
3.2. Human Comfort Meter Wind Speed Acquisition Circuit Design
At present, there are roughly three types of sensors for measuring wind speed, namely a propeller type wind speed sensor, a three-cup type wind speed sensor, and an ultrasonic wind speed sensor. The measurement accuracy and measure-ment stability of the three-cup wind speed sensor are superior to the other two wind speed sensors. The design uses the three-cup wind speed sensor WM30 of Vaisala, Finland to measure the wind speed of the human comfort meter. The Vaisala Wind Sensor WM30 is a compact and economical wind speed and direc-tion sensor (only wind speed measurement is used in this design). The rotating three-cup anemometer is located at the top of the entire sensor unit and pro-vides a linear response to wind speed. The material of the cup the shape and size guarantee the accurate measurement of the wind speed, while the cup is rigo-rously tested to ensure a linear response between the wind speed and the angular speed of the cup wheel. Features and benefits of the WM30 include: lower cost, lighter and lighter design, the best choice for mobile applications, low power consumption, fast and linear response to wind.
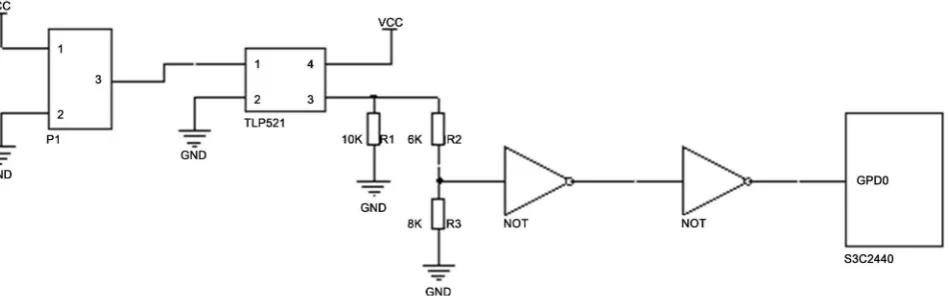
[image:6.595.67.542.559.709.2]The wind speed is output as a relay. The number of pulses in a fixed time can be recorded to calculate the wind speed. The wind speed can also be calcu-lated by measuring the time interval between successive pulses. In this paper, the number of pulses in a fixed time is recorded to calculate the wind speed. The human body comfort meter wind speed acquisition circuit is shown in
Figure 3.
In Figure 3, P1 is a transfer port for connecting the wind speed sensor WM30,
wherein the pin 3 is a signal output port; the TLP521 is an optocoupler element for isolating the wind speed sensor from the S3C2440 to reduce signal crosstalk, the TLP521 pin 1 is the signal input terminal, connected to pin 3 of P1, pin 3 of TLP521 is the signal output port, and two non-gate devices are connected in se-ries and connected to the GPD0 port of S3C2440. The wind speed sensor signal output calculation formula is shown in Formula (1).
0.24 0.699 *
V = − + F (1)
where V is the wind speed (in m/s) and F is the pulse frequency (in Hz) of the
DOI: 10.4236/gep.2019.76010 121 Journal of Geoscience and Environment Protection
wind speed sensor output.
4. System Software Design
4.1. Software Design Environment
In an embedded system, the source file code must be compiled to be converted into an executable binary object file (Zhang et al., 2012). A complete embedded system requires a lot of object files, which requires a link tool to link all the tar-get files into a total binary object file. The tools involved include compilers, linkers, relocatable programs, and locators.
In this design, the host environment needs to be built. The solution is to in-stall the virtual machine on the PC, and then inin-stall the Linux operating system in the virtual machine environment. The host and the target communicate with each other through the network. The IP address of the Linux operating system of the virtual machine needs to be in the same network segment as the IP of the Windows operating system. In order to generate executable code on another platform on one platform, you need to build a cross-compilation environment and install cross-compilation tools.
The transplantation of embedded operating system is an important step in the process of building software development environment. The operating system ported in this design is Linux, which mainly includes the transplantation of sys-tem bootloader, kernel porting, and root file syssys-tem porting.
4.2. System Software Design
The system software design includes system driver design, Qt/Embedded graph-ical user interface programming and human comfort instrument algorithm pro-gram.
System drivers include device drivers, temperature and humidity sensor driv-ers, and wind speed sensor drivers. The application communicates with the ker-nel via a Linux system call. Both the temperature and humidity sensors and the wind speed sensor are connected to the I/O port of the S3C2440, while the I/O device is used through a fixed entry point defined by the device driver. The driv-er of the tempdriv-erature and humidity sensor SHT10 is calculated by changing the output value of the GPC9 port of the S3C2440 and reading the input value of the GPC8 port according to the working principle of the SHT10. The working prin-ciple of the specific code has been described in detail above. Let me repeat. The driver of the wind speed sensor is relatively simple, mainly to enable a timer to record the number of pulses of the GPDO port in a fixed time, and calculate by the Formula (1).
DOI: 10.4236/gep.2019.76010 122 Journal of Geoscience and Environment Protection
properties, that is, to write programs and debug on the Windows platform, and finally Run on an embedded platform. In this design, Qt/Embedded interacts with the S3C2440’s I/O facilities through the Qt API. The construction of the Qt environment includes the installation of the Qt Creator software and the con-struction of the cross-compilation environment under the Linux platform. Using Qt to develop the application program of human comfort meter, the program interface has temperature, relative humidity, wind speed, comfort value and comfort conclusion display function. After the program is compiled, the execut-able file is generated, and the executexecut-able file is downloaded to the S3C2440 de-velopment board. The design of the Qt/Embedded graphical user interface pro-gram is completed.
The human comfort tester algorithm uses the human comfort index predic-tion model used by the Beijing Meteorological Administrapredic-tion since 1997. The nonlinear equation of the model is shown in Equation (2).
(
)
1.8 0.55 1 32 3.2
DI= T+ −RH + − V (2)
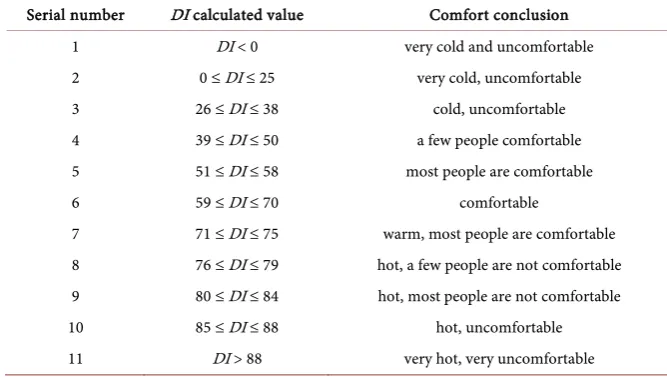
In the formula, DI is the calculated comfort value, T is the temperature, RH is the relative humidity, and V is the wind speed. The higher the DI value, the hot-ter the human body feels, and the lower the DI value, the colder the human body feels. The correspondence between the DI value and the conclusion of human comfort is shown in Table 1. The rank of DI calculated values is determine by the Beijing Meteorological Administration of China.
It can be seen from Table 1 that when the calculated value of DI is too large or too small, the human body feels uncomfortable. Only when the DI value is moderate, that is, the temperature, relative humidity, and wind speed are con-trolled within a certain range. The feeling is more comfortable.
5. Conclusion
[image:8.595.204.538.534.728.2]This paper designs a human comfort meter based on embedded processor and
Table 1. Correspondence between DI calculated values and human comfort conclusions.
Serial number DI calculated value Comfort conclusion
1 DI < 0 very cold and uncomfortable
2 0 ≤ DI ≤ 25 very cold, uncomfortable
3 26 ≤ DI ≤ 38 cold, uncomfortable
4 39 ≤ DI ≤ 50 a few people comfortable
5 51 ≤ DI ≤ 58 most people are comfortable
6 59 ≤ DI ≤ 70 comfortable
7 71 ≤ DI ≤ 75 warm, most people are comfortable 8 76 ≤ DI ≤ 79 hot, a few people are not comfortable 9 80 ≤ DI ≤ 84 hot, most people are not comfortable
10 85 ≤ DI ≤ 88 hot, uncomfortable
DOI: 10.4236/gep.2019.76010 123 Journal of Geoscience and Environment Protection
operating system. By collecting the temperature, relative humidity and wind speed data in the environment, combined with the human comfort algorithm model, the conclusion of human comfort is obtained. The software development environment, through Qt to write a graphical user interface to display the mea-surement values, comfort values and comfort conclusions of each element. After testing, the human comfort meter can accurately collect the values of various elements in the environment, and the real-time performance is good. The system software and hardware design are reasonable; the function is perfect; the reliabil-ity is high, meets the expected design goals, and has a good application prospect. The human comfort index is a bio-meteorological indicator based on the me-teorological point of view to evaluate the comfort of people in different climatic conditions and based on the heat exchange between the human body and the atmospheric environment. In general, the three meteorological elements of temperature, relative humidity and wind speed have the greatest impact on hu-man body perception. The application of this product can help people under-stand the atmospheric environment, take timely measures to prevent people from happening, and reduce the mistakes in work and life decisions caused by emotions.
Acknowledgements
None.
Conflicts of Interest
The authors declare no conflicts of interest regarding the publication of this pa-per.
References
Chen, L., Wu, Z., & Liu, Y. (2013). Porting of Embedded Operating System on TMS320F28335 Platform. Computer Technology and Development, 23, 7-11.
Guo, S., Feng, H., & Zhou, S. (2016). Design of Portable Instrument Using Microcontrol-ler Operating System. Automation Instrumentation, 37, 93-95.
Jin, F., & Cui, P. (2014). Research on Signal and Slot Mechanism in Embedded Qt. Elec-tronic Design Engineering, 22, 168-170.
Kai, Z., Kan, Z., & Zhang, F. (2014). Evaluating Bus Transit Performance of Chinese Ci-ties: Developing an Overall Bus Comfort Model. Transportation Research Part A: Poli-cy & Practice, 69, 105-112.https://doi.org/10.1016/j.tra.2014.08.020
Li, J., Wang, Y., Peng, N. et al. (2016). Analysis of Tourism Meteorological Conditions in Shilin County. Anhui Agricultural Sciences, 44, 200-201.
Li, L., & Shi, W. (2011). Design and Implementation of Intelligent Temperature and Hu-midity Control System in Greenhouses. Hunan Agricultural Sciences, 21, 135-138. Ma, D., Wang, W., Jiang, Q. et al. (2013). On-Line Temperature and Humidity
Monitor-ing System Based on RS485 Bus. Chinese Journal of Agricultural Mechanization, 34,
121-126.
DOI: 10.4236/gep.2019.76010 124 Journal of Geoscience and Environment Protection Annual Comparative Performance and Cost Analysis of High Temperature, Sensible Thermal Energy Storage Systems Integrated with a Concentrated Solar Power Plant.
Solar Energy, 153, 153-172.https://doi.org/10.1016/j.solener.2017.05.044
Moustris, K., Tsiros, I. X., Tseliou, A., & Nastos, P. (2018). Development and Application of Artificial Neural Network Models to Estimate Values of a Complex Human Thermal Comfort Index Associated with Urban Heat and Cool Island Patterns Using Air Tem-perature Data from a Standard Meteorological Station. International Journal of Bio-meteorology, 4, 1-10.https://doi.org/10.1007/s00484-018-1531-5
Peng, J., Zong, Z., Huang, X. et al. (2011). Evaluation of Climate Comfort and Prediction Equation for Rafting in Mengdong River, Hunan Province. Meteorology, 37, 771-776. Slater, L. J., Villarini, G., & Bradley, A. A. (2017). Evaluation of the Skill of North-American
Multi-Model Ensemble (NMME) Global Climate Models in Predicting Average and Extreme Precipitation and Temperature over the Continental USA. Climate Dynamics, 46, 1-16.https://doi.org/10.1007/s00382-016-3286-1
Takaya, Y., Yasuda, T., Fujii, Y., Matsumoto, S., Soga, T., Mori, H. et al. (2017). Japan Meteorological Agency/Meteorological Research Institute-Coupled Prediction System Version 1 (jma/mri-cps1) for Operational Seasonal Forecasting. Climate Dynamics, 48,
313-333.https://doi.org/10.1007/s00382-016-3076-9
Wallace, Z. C., & Hill, A. A. (2017). Forecaster and Emergency Manager Perspectives on Coordination and Communication with the Weather-Warned Public. Papers in Ap-plied Geography, 3, 157-170.https://doi.org/10.1080/23754931.2017.1299036
Wang, B., Bai, X., Zhang, C. et al. (2015). Embedded Software Test Case Generation Based on Interface Automata and Symbolic Execution. Chinese Journal of Computers, 38, 2125-2144.
Xia, J., & Niu, C. (2011). Research and Implementation of Linux Porting Based on S3C2440A Processor. Computer and Digital Engineering, 39, 77-80.
Zhang, H., Gao, L., & Song, C. (2012). Research and Implementation of Embedded Linux Cross-Compilation Environment Based on ARM. Computer and Digital Engineering, 40, 151-153.