Assessment of a novel solid oxide fuel cell tri-generation
1system for building applications
23
Theo Elmera*, Mark Woralla, Shenyi Wuaand Saffa Riffata 4
aArchitecture, Energy and Environment Research Group, The University of Nottingham, UK 5
*corresponding author email:[email protected]
6
*corresponding author telephone: + 44 (0)115 748 4839 7
8
Abstract
9The paper provides a performance analysis assessment of a novel solid oxide fuel cell 10
(SOFC) liquid desiccant tri-generation system for building applications. The work 11
presented serves to build upon the current literature related to experimental evaluations 12
of SOFC tri-generation systems, particularly in domestic built environment applications. 13
The proposed SOFC liquid desiccant tri-generation system will be the first-of-its-kind. No 14
research activity is reported on the integration of SOFC, or any fuel cell, with liquid 15
desiccant air conditioning in a generation system configuration. The novel tri-16
generation system is suited to applications that require simultaneous electrical power, 17
heating and dehumidification/cooling. There are several specific benefits to the integration 18
of SOFC and liquid desiccant air conditioning technology, including; very high operational 19
electrical efficiencies even at low system capacities and the ability to utilise low-grade 20
thermal energy in a (useful) cooling process. Furthermore, the novel tri-generation system 21
has the potential to increase thermal energy utilisation and thus the access to the benefits 22
achievable from on-site electrical generation, primarily; reduced emissions and operating 23
costs. 24
25
Using empirical SOFC and liquid desiccant component data, an energetic, economic and 26
Significant conclusions from the work include: (1) SOFC and liquid desiccant are a viable 28
technological pairing in the development of an efficient and effective tri-generation 29
system. High tri-generation efficiencies in the range of 68-71% are attainable. (2) The 30
inclusion of liquid desiccant provides an efficiency increase of 9-15% compared to SOFC 31
electrical operation only, demonstrating the potential of the system in building applications 32
that require simultaneous electrical power, heating and/or dehumidification/cooling. (3) 33
Compared to an equivalent base case system, the novel tri-generation system is currently 34
only economically viable with a government’s financial support. SOFC capital cost and 35
stack replacement are the largest inhibitors to economic viability. Environmental 36
performance is closely linked to electrical emission factor, and thus performance is heavily 37
country dependent. (4) The economic and environmental feasibility of the novel tri-38
generation system will improve with predicted SOFC capital cost reductions and the 39
transition to clean hydrogen production. 40
41
Keywords:Tri-generation, solid oxide fuel cell, liquid desiccant air conditioning, emission
42
1 Introduction
44In recent years the dramatic increase in concerns regarding the environmental impact of 45
using fossil fuels, and their accompanying cost, have driven governments, business and 46
consumers towards cleaner energy resources and the use of alternative methods for more 47
efficient energy utilisation. Currently, buildings consume around 40% of the world’s 48
primary energy for cooling, heat and power [1]. Most of this energy is from electricity 49
generated at centralised power stations; where at present up to 70% of available energy 50
is wasted. The overall system efficiency is low at 30-40%, leading to a high waste of 51
energy resources, resulting in considerable CO2 emissions and unnecessarily high running 52
costs. Reducing the energy consumption of buildings can make a substantial contribution 53
towards attaining the EU’s 2020, the UK’s 2050 and other international carbon emission 54
targets. But this will only be achieved by moving from conventional centralised power 55
generation systems to onsite highly-efficient clean micro-generation technology [2-4]. 56
57
One of the most promising possibilities for clean micro-generation is solid oxide fuel cell 58
(SOFC) technology, which can generate electricity directly through an electrochemical 59
reaction which brings together hydrogen and oxygen. The only by-products are waste 60
heat, water vapour, and depending on the fuel used a modest amount of CO2. Chemical 61
to electrical energy conversion efficiencies can be over 50% compared to 30-40% in 62
combustion processes, such as internal combustion engines (ICE) and gas turbines. 63
Technical assessments have demonstrated that if combined heat and power (CHP) 64
technology is used with SOFC, the total system efficiency can be as high as 90% [5, 6]. 65
Liquid desiccant systems are used in heating, ventilation, and air conditioning applications 66
where simultaneous maintenance of temperature and humidity control is an important 67
benefit to the user. This technology is often used in tri-generation system applications 68
where the desiccant system is driven by the heat by-product. If the waste heat from the 69
SOFC is used to drive the liquid desiccant unit, then a tri-generation system will result, 70
but also cooling and humidity control. It has been demonstrated in the literature that the 72
inclusion of liquid desiccant in a tri-generation system configuration can provide significant 73
improvement to total system efficiency [7, 8] and thus greater energy utilisation, providing 74
a range of technical, environmental and economic benefits [3, 4]. 75
76
The majority of tri-generation systems for building applications reviewed in the literature 77
use the thermal energy rejected by the electrical generator to produce a useful cooling 78
output. The most common technological pairing has been found to be an ICE with a vapour 79
absorption cooling system (VAS) [9-11]. No research publications have been found 80
describing a SOFC or even fuel cell based liquid desiccant tri-generation system. Fuel cells 81
are well suited to tri-generation built environment applications because they produce heat 82
when generating electricity, have high electrical efficiency and excellent load-following 83
characteristics [12]. Moreover, continued technological improvements to fuel cells have, 84
in recent years, increased interest in fuel cell based tri-generation systems [13]. 85
86
Yu, Han et al. [14] have numerically investigated a tri-generation system incorporating a 87
SOFC and a double-effect water/lithium bromide VAS, high total system efficiencies of 88
84% or more were reported by the authors, illustrating the benefits of tri-generation 89
systems in applications where heating, cooling and power are required. Margalef and 90
Samuelsen [15] numerically examined a 300kW molten carbonate fuel cell (MCFC) VAS 91
tri-generation system, achieving an overall system efficiency of 72%. The pairing of two 92
off the shelf technologies for tri-generation system construction was shown to be 93
problematic. Margalef and Samuelsen [15] state that the MCFC and VAS chosen for the 94
tri-generation system were close, but not an ideal match. Al-Sulaiman, Dincer et al. [16] 95
presents an energy analysis of a tri-generation plant incorporating a 520kW SOFC, organic 96
Rankine cycle, heat exchanger and single effect VAS. The investigation showed that by 97
efficiency of 74% has been achieved. Fong and Lee [17] have investigated a SOFC tri-100
generation system for high-rise buildings in a hot and humid climate. The study focussed 101
on two sizing options. (1) Full SOFC, where the system was sized to peak loads, and (2) 102
partial SOFC, where the system was sized such that peak loads were met by the SOFC and 103
grid, however over the course of one year the system maintains a net zero grid import. 104
The full and the partial SOFC systems generate a 51.4% and 23.9% carbon emission 105
saving respectively, and a 7.1% and 2.8% electricity saving respectively. The full SOFC 106
tri-generation system showed the best environmental and energetic performance due to 107
the partial SOFC systems requirement of grid electricity. However the economics of sizing 108
the tri-generation system to meet peak load capacity was not investigated. Zink, Lu et al. 109
[18] have examined a 110kW SOFC based tri-generation system employing a VAS. Results 110
show that total system efficiency can reach 87% or more and that the combined system 111
shows great advantages both technically and environmentally over other current CHP and 112
tri-generation systems. Darwish [19] has investigated a phosphoric acid fuel cell (PAFC) 113
tri-generation system to meet high air conditioning loads in a large building in Kuwait. The 114
PAFCs thermal (105kW) and electrical outputs (200kW) are used in a VAS and VCS 115
respectively. The system only becomes economically feasible once the fuel cell capital cost 116
drops below 2000$.kWe-1. 117
118
As demonstrated in the literature presented above, tri-generation is a well-known 119
technology for energy conservation in commercial and industrial applications. However, 120
limited work has been completed for tri-generation systems in domestic building 121
applications [20, 21]. Kong, Wang et al. [22] state that the concept of tri-generation 122
systems for individual domestic buildings has only been thought reasonable with the more 123
recent development of heat driven cooling technologies with capacities of <10kW that can 124
operate on low-grade thermal energy (60-90°C). Huangfu, Wu et al. [20] believe the main 125
obstacles to any type of domestic scale tri-generation systems is the high initial cost and 126
heat driven cooling. Other commonly referenced obstacles include; system size and 128
complexity. However, with recent advances in liquid desiccant based air conditioners for 129
small scale residential applications the development of a fuel cell tri-generation system in 130
domestic homes is possible [23]. Mı́guez [21] and Porteiro [24] state that the introduction 131
of tri-generation systems to the domestic built environment requires the core of the 132
system, the CHP unit, to be compact, cost efficient and easily installed. Pilatowsky, Romero 133
et al. [25] have carried out simulations for a 1kWePEMFC coupled to a VAS. Results show 134
that the co-generation process increases total efficiency of the PEMFC system, illustrating 135
the feasibility of using fuel cells in small scale tri-generation system applications. Najafi, 136
Antonellis et al. [26, 27] report on a medium scale (10-20kWe) PEMFC desiccant wheel tri-137
generation system. The work uses simulations to optimise the system components for 138
building applications. A significant conclusion indicates that positive energy savings can 139
only be achieved if the PEMFC system and it’s auxiliary devices performance are 140
appropriately improved. Gigliucci, Petruzzi et al. [28] have conducted extensive work on 141
fuel cell CHP systems in domestic built environment applications, in particular their thermal 142
management. The authors conclude that for the full potential of fuel cell devices operating 143
in built environment applications to be realised, the following aspects need to be 144
considered / resolved: (1) ability of delivering waste heat to a useful heat sink - tri-145
generation system applications will increase this, and (2) capacity to vary the heat to 146
power ratio / electrical output during operation. Fuel cells with their low heat to power 147
ratios show great promise in terms of total thermal energy utilisation, illustrating why fuel 148
cell technology has been highlighted as a strong candidate for tri-generation domestic built 149
environment applications [12, 23]. 150
151
To summarise, the literature searches have highlighted a small number of research 152
publications and patents that focus on SOFC tri-generation systems [16, 25, 29-33]. The 153
aimed at large industrial scale applications. The fuel cell tri-generation systems presented 156
demonstrate good performance in terms of system efficiency, primary energy demand 157
reduction and associated CO2emissions / operational costs. However, issues regarding the 158
accurate pairing of prime mover and cooling technologies needs careful consideration to 159
ensure effective system operation. Furthermore, it has been established that the technical 160
and economic viability of any tri-generation system, but particularly fuel cell, presides with 161
the prime mover (fuel cell), not the cooling technology, which is already at a level 162
commensurate with technical and economic practicality. 163
164
The work presented in this paper serves to build upon the current literature related to 165
experimental evaluations of SOFC tri-generation systems, particularly in domestic built 166
environment applications. The proposed SOFC liquid desiccant tri-generation system will 167
be the first-of-its-kind. No research activity is reported on the integration of SOFC, or any 168
fuel cell, with liquid desiccant air conditioning in a tri-generation system configuration. The 169
novel tri-generation system is suited to applications that require simultaneous electrical 170
power, heating and dehumidification/cooling. There are several specific benefits to the 171
integration of SOFC and liquid desiccant air conditioning technology, including; very high 172
operational electrical efficiencies even at low system capacities and the ability to utilise 173
low-grade thermal energy in a (useful) cooling process. Furthermore, in many building 174
applications the demand for cooling coincides with a reduction in heating demand. If this 175
heat cannot be fully utilised system efficiency will suffer. The novel tri-generation system 176
has the potential to increase thermal energy utilisation and thus the access to the benefits 177
achievable from on-site electrical generation, primarily; reduced emissions and operating 178
costs. Although no work has been found directly relating to the proposed novel tri-179
generation system concept, the author’s rationale behind the success of the system is that 180
liquid desiccant air conditioning technology makes better use of low grade thermal energy 181
compared to VAS [34]. Furthermore, liquid desiccant air conditioning regeneration 182
system at the micro to small scale (i.e. <10kWe) with a recovered waste water 184
temperature output of 50-80°C [3, 36] is deemed a well suited technological partnership 185
with liquid desiccant air conditioning technology. 186
187
This paper provides a performance analysis assessment of a novel SOFC liquid desiccant 188
tri-generation system for building applications. Using empirical SOFC and liquid desiccant 189
component data, an energetic, economic and environmental performance analysis 190
assessment of a first-of-its-kind system is presented. Specifically, the aim of the paper’s 191
performance analysis assessment is to: 192
193
1. Validate, empirically, the integration of SOFC and liquid desiccant technology into 194
an efficient and effective tri-generation system. 195
2. Determine tri-generation system efficiency in a building application. 196
3. Ascertain whether the proposed tri-generation system is economically and 197
environmentally viable under current conditions compared to an equivalent base 198
case system. 199
4. Establish the conditions and geographical locations in which the novel tri-200
generation system is economically and environmentally viable compared to an 201
equivalent base case system. 202
5. Suggest the future feasibility of the novel tri-generation system with respect to 203
projected changes in global energy resources, conversion techniques and cost. 204
2 Tri-generation system development
207The tri-generation system is comprised of two main components: SOFC and liquid 208
desiccant. The performance of these two system components is documented in sections 209
2.1 and 2.2 respectively. Following this, section 2.3 presents an energetic performance 210
analysis assessment of the novel tri-generation system. 211
212
2.1 Solid oxide fuel cell component
213
The SOFC used for tri-generation system development and field trial testing in a building 214
application is the BlueGEN CHP unit manufactured by Ceramic Fuel Cells Ltd (CFCL). 215
BlueGEN is a commercially available SOFC CHP system designed for small to medium scale 216
building applications. Operating on natural gas, the unit can be power modulated from 217
500We (25%) to 2kWe(100%), however it achieves its highest net electrical efficiency of 218
60% at a 1.5kWe output. As a result, CFCL have optimised the default operation of the 219
unit at 1.5kWe to provide the highest electrical efficiency and thus greatest economic 220
benefit to the user. The BlueGEN SOFC unit consists of 51 planar type YSZ (Yttria-221
stabalised Zirconia) electrolyte layer sets (each layer consist of 4 cells), and operates at 222
750°C. Hydrogen is produced from natural gas by internal steam reforming (endothermic) 223
on the fuel cell anode, utilising the heat of the electrochemical reaction (exothermic) to 224
create a chemical combined cycle. The BlueGEN SOFC unit is certified for domestic building 225
installations and qualifies for the UK FiT (feed-in-tariff); a tariff paid to the consumer per 226
kWh of generated electricity. The BlueGEN SOFC unit is installed at The University of 227
Nottingham’s Creative Energy Homes as shown in Figure 1. 228
230
Figure 1 BlueGEN SOFC CHP system installed at The University of Nottingham
231 232
The SOFC unit is connected electrically, in parallel, to the national grid in order to export 233
or import power as required. The SOFC unit is connected to the natural gas grid. A waste 234
heat recovery (WHR) circuit delivers the generated heat from the SOFC unit directly to the 235
homes 300L hot water cylinder, which is supplemented by an auxiliary gas boiler. 236
Currently, the BlueGEN’s estimate operational lifetime is 15 years; however the unit 237
requires stack replacement every five years. For tri-generation system integration, the 238
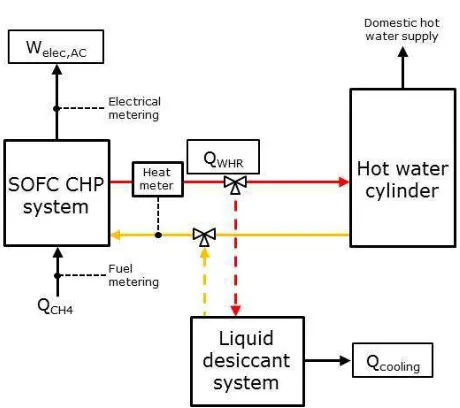
liquid desiccant system is installed in-line between the SOFC unit and hot water cylinder, 239
as shown in Figure 2. 240
241
242
Figure 2 SOFC liquid desiccant tri-generation system schematic
243
Auxiliary boiler
WHR circuit
SOFC unit WHR circuit
[image:10.595.183.413.501.705.2]The net AC electrical power output(ܹ̇,)from the SOFC unit is collected using the CFCL 245
online interface. The CFCL interface also records the natural gas fuel input to the SOFC 246
(ܳ̇ுర). A Diehl Sharky 775 heat meter is used to collect thermal output data from the 247
SOFC. The heat meter measures the water flow rate and supply and return water 248
temperatures in the WHR circuit. Equation 1 is then used to determine the thermal 249
output(ܳ̇ௐ ுோ). 250
251
ܳ̇ௐ ுோ =݉ሶௐ ுோܿ,ௐ ுோ൫ܶௐ ுோ,௪ − ܶௐ ுோ,௧௨൯
252
1
253 254
The CHP efficiency (ߟு) is then calculated using Equation 2. 255
256
ߟு=ܹ̇,ܳ̇ +ܳ̇ௐ ுோ ுర 257
2
258 259
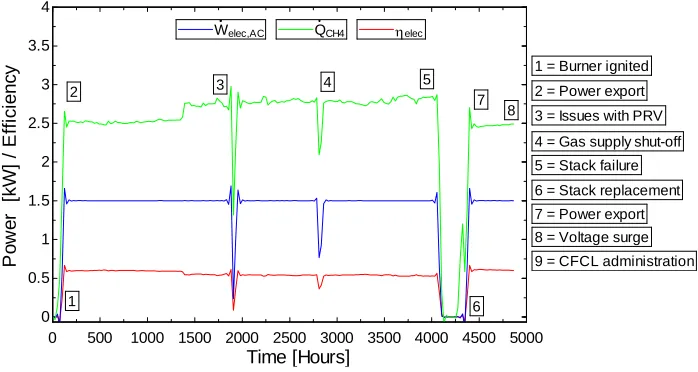
Figure 3 shows field trial electrical performance data collected from the SOFC unit from 24 260
March 2014 (point 1) to 12 December 2014 (point 8). This is equivalent to 4865 hours of 261
operation (8 months 18 days). During this period the SOFC unit shows stable operation 262
with an electrical efficiency of 55-60% and availability for power generation of 91.7%. Due 263
to the time taken to heat the stack to 750°C and to avoid thermal cycling, the SOFC unit 264
operates continuously, always aiming to maintain a 1.5kWeoutput. As seen in Figure 3 as 265
the stack efficiency degrades over time the fuel input is increased to compensate for this. 266
At an electrical efficiency of 60% the fuel input is 2.5kW. After 4000 hours of operation 267
(point 2 to 5), the stack displayed an electrical efficiency degradation of approximately 268
6%. 269
271
Figure 3 SOFC field trial electrical performance data
272 273
Figure 4 presents electrical and thermal performance characterisation of the SOFC CHP 274
system in a building application using data from [37] and [38]. During the performance 275
characterisation, a 2L.min-1water volumetric flow in the WHR circuit has been used. This 276
is equal to the value used in the liquid desiccant performance assessment in [39] and thus 277
tri-generation system integration is a rational concept. From Figure 4a it is evident that 278
the net electrical efficiency increases as the electrical capacity increases, from 14% at 279
200We up to a maximum of 60% at 1500We, it then decreases to approximately 56% at 280
a 2000Wecapacity. The thermal output from the SOFC increases fairly linearly from 320Wth 281
at 200We up to 540Wth at 1500kWe. The thermal output increase is then much steeper, 282
up to a maximum of 1000Wthat 2000We. At the optimised 1500We output a CHP efficiency 283
of 81.6% is achieved. 284
285
0 500 1000 1500 2000 2500 3000 3500 4000 4500 5000 0
0.5 1 1.5 2 2.5 3 3.5 4
helec
Time [Hours]
P
o
w
e
r
[k
W
]
/
E
ff
ic
ie
n
c
y
2 3 4 5
1 6
7 8 Welec,AC QCH4
1 = Burner ignited
2 = Power export
4 = Gas supply shut-off
6 = Stack replacement 5 = Stack failure 3 = Issues with PRV
7 = Power export 8 = Voltage surge
286
Figure 4 (a) SOFC electrical efficiency and thermal output [38], and (b) WHR flow water
287
temperature as a function of electrical output
288 289
Figure 4b shows the flow water temperature in the SOFC WHR loop as a function of 290
electrical power output. The flow water temperature is calculated based on the thermal 291
output data presented in Figure 4a, a 2L.min-1 water volumetric flow and a 45°C return 292
water temperature in the WHR circuit. The flow water temperature ranges between 47°C 293
at 100We output up to a maximum of 52°C at a 2000Weoutput. As demonstrated in [39] 294
this is sufficient for effective desiccant solution regeneration. Due to limited variation in 295
the SOFC CHP system’s operation and thus outputs it is primarily the operation of the 296
desiccant system that is optimised to facilitate successful tri-generation system integration 297
[39]. 298
299
With reference to Figure 3, there have been three key events in the lifetime of the SOFC 300
unit, (1) an unforeseen gas shut-off (point 4) causing stack cool down and thermal 301
contraction, leading to an electrical efficiency drop, and eventual stack failure (point 5) 302
and replacement (point 6), (2) A 415 volt voltage surge at The Creative Energy Homes 303
causing irrevocable damage to the power electronics and thus stack cool-down, again 304
leading to the requirement of power electronic and stack replacement (point 8). (3) CFCL 305
going into administration, and thus not being able to carry-out the required repair works 306
post voltage surge. At the time of writing the SOFC unit is not operational. 307
308
0 200 400 600 800 1000 1200 1400 1600 1800 2000
0 10 20 30 40 50 60 70 0 200 400 600 800 1000 1200 1400 helec T h e rm a l o u tp u t [W ] QWHR
Net power output [W]
E ff ic ie n c y [% ]
WHR water flow = 2L.min-1
0 200 400 600 800 1000 1200 1400 1600 1800 2000
45 46 47 48 49 50 51 52 53 54 55 T e m p e ra tu re [° C ]
Tw ater,WHR
Net power output [W]
WHR water flow = 2L.min-1
[image:13.595.88.510.72.209.2]2.2 Liquid desiccant component
309
A liquid desiccant air conditioning system developed by the authors specifically for tri-310
generation/waste heat driven system applications, in particular with SOFC technology, has 311
been previously documented in detail in [39]. The desiccant system uses a semi-312
permeable micro porous membrane based cross flow contactor, operating with a low cost, 313
environmentally friendly, non-corrosive potassium formate (CHKO2) desiccant solution. 314
The merits and operational considerations of employing a potassium formate desiccant 315
solution over other commonly used liquid desiccants such as lithium chloride or calcium 316
chloride are provided in a previous work [36]. Figure 5a provides a schematic diagram of 317
the complete liquid desiccant system with labelled components and Figure 5b shows a 318
photograph. 319
320
[image:14.595.71.518.377.579.2]321
Figure 5 Liquid desiccant system (a) schematic with labelled components, and (b)
322
photograph
323 324
The paper assesses in detail the impact inlet environmental conditions (air temperature 325
and relative humidity) and operational conditions (desiccant solution volumetric, water 326
flow temperature and hot water volumetric flow in the heating circuit) have on liquid 327
desiccant system performance. Refer to [39] for a detailed description of the liquid 328
desiccant system’s experimental set-up, experimental method and full results/analysis. 329
330
The main metric used to evaluate the performance of the liquid desiccant system is thermal 331
COP (COPth) as shown in Equation 3. Where,ܳ̇is the dehumidifier cooling output and 332
ܳ̇ is the regenerator thermal input.
333
334
COP௧=ܳ̇ܳ̇
335
3
336 337
In order for the desiccant air conditioning system to operate continuously, the mass of 338
vapour absorbed by the desiccant solution in the dehumidifier must be removed in the 339
regenerator. Adequate regenerator thermal input is therefore required. 340
341
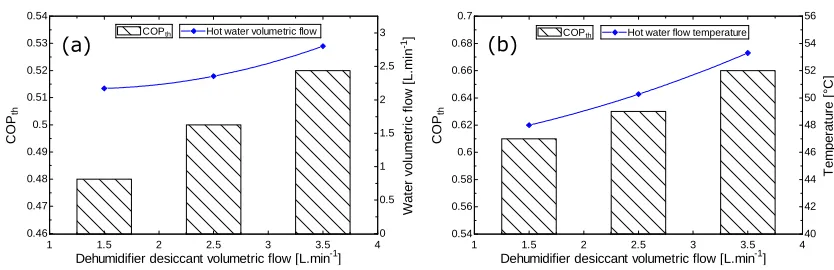
Figure 6 shows the variation in liquid desiccant system performance with dehumidifier 342
desiccant solution volumetric flow. The assessment has been performed at a set desiccant 343
system inlet air condition of 30°C and 70% relative humidity. Figure 6a shows the hot 344
water volumetric flow in the heating circuit needs to be increased as the dehumidifier 345
desiccant solution volumetric flow is increased. At a desiccant flow of 1.5L.min-1 the hot 346
water volumetric flow is 2.17L.min-1. As desiccant volumetric flow increases to 2.5L.min-1 347
the hot water volumetric flow needs to be increased to 2.353L.min-1 and at a desiccant 348
volumetric flow of 3.5L.min-1 the hot water volumetric flow needs to be increased to 349
2.802L.min-1. At a set hot water volumetric flow of 2L.min-1Figure 6b shows that the hot 350
water flow temperature needs to be increased as the dehumidifier desiccant solution 351
volumetric flow is increased, from 48°C at 1.5L.min-1, 50.27°C at 2.5L.min-1and to 53.3°C 352
at 3.5L.min-1. At a set inlet dehumidifier desiccant solution volumetric flow of 3.5L.min-1, 353
dehumidifier desiccant solution volumetric flow range investigated, the electrical COP 355
(COPel) varies between 5.7 and 7.1. 356
357
[image:16.595.88.505.146.281.2]358
Figure 6 Liquid desiccant system performance with dehumidifier desiccant solution
359
volumetric flow
360 361
The experimental evaluation in [39] validates the concept of integrating SOFC and liquid 362
desiccant air conditioning technology into an efficient and effective tri-generation system. 363
This is primarily due to good dehumidification capacity and effective regeneration of the 364
potassium formate solution at a 0.65-0.7 solution mass concentration. Encouraging COPth 365
values in the range of 0.4-0.66 have been demonstrated when operating with a low grade 366
thermal input (45-60°C) typical of a SOFC CHP system of the studied scale. 367
368 369
1 1.5 2 2.5 3 3.5 4
0.46 0.47 0.48 0.49 0.5 0.51 0.52 0.53 0.54 0 0.5 1 1.5 2 2.5 3 C O Pth COPth W a te r v o lu m e tr ic fl o w [L .m in -1]
Hot water volumetric flow
Dehumidifier desiccant volumetric flow [L.min-1]
1 1.5 2 2.5 3 3.5 4
0.54 0.56 0.58 0.6 0.62 0.64 0.66 0.68 0.7 40 42 44 46 48 50 52 54 56 COPth T e m p e ra tu re [° C ]
Hot water flow temperature
C
O
Pth
Dehumidifier desiccant volumetric flow [L.min-1]
2.3 Energetic performance analysis assessment
370
Due to the SOFC’s operational issues it was not available for tri-generation system 371
integration. As a result, the paper uses empirical SOFC component data presented in 372
section 2.1 and liquid desiccant component data presented in section 2.2 and [39] to 373
perform a theoretical integration analysis of the novel system. Although the paper uses 374
empirical SOFC and liquid desiccant component data to perform the theoretical integration 375
analysis, the technical feasibility of tri-generation system integration is practical. This is 376
because both the SOFC thermal output and liquid descant thermal input are both 377
considered low-temperature (40 - 60°C) and operate at atmospheric pressure. 378
Furthermore, in a domestic building context, the SOFC and liquid desiccant components 379
can be connected using standard heating system copper/plastic pipe. Similarly, typical 380
domestic heating system three port solenoid valves control the flow of thermal energy 381
between the SOFC component and domestic hot water / liquid desiccant regeneration 382
requirements. 383
384
Using empirical WHR flow water temperature from the SOFC CHP system, shown in Figure 385
4b, and empirical liquid desiccant component data from [39], the COPth and resulting 386
cooling output of the liquid desiccant system, operating with the SOFC CHP system’s 387
thermal output, is determined. Using these data tri-generation system efficiency (ߟ௧) is 388
calculated. Tri-generation system efficiency is defined in Equation 4 as the ratio of the 389
overall tri-generation system energy conversion (electricity and heating and/or cooling) 390
over the total amount of energy input to the system. 391
392
ߟ௧=ܹ̇,+ܳ̇ௐ ுோܳ̇ ,௧+ܳ̇ ுర
393
4
Table 1 presents the results from the integration of the SOFC and liquid desiccant 396
components into a complete tri-generation system at a net 1.5kWeand 2kWeoutput, with 397
a desiccant system inlet air condition of 30°C and 70% relative humidity. In order to obtain 398
balanced desiccant system operation, the desiccant solution volumetric flow in the 399
dehumidifier and regenerator (shown in Table 1) has been adjusted according to the 400
thermal output available from the SOFC. The parasitic energy consumption (110W) of the 401
liquid desiccant system has been included in the evaluation. 402
Table 1 Tri-generation system energetic performance
405
Variable 1.5kWe 2kWe
ηelec(%) 60 56
ܳ̇େୌర(ܹ) 2500 3571
ܳ̇ ୌୖ(ܹ) 540 1000
ܶ ୌୖ,୪୭୵(°ܥ) 48.87 52.16
ηCHP(%) 81.6 84
Desiccant volume (L.min-1) 1.74 3.16
COPth 0.614 0.649
ܳ̇ୡ୭୭୪୧୬(ܹ) 332 649
DehumidifierMRR(g.s-1) 0.2515 0.2941
ηtri(%) 68.9 71.1
Δ% PED (CHP/TRI) 51.41 / 46.98 50.21 / 46.79
Δ% Cost (CHP/TRI) 62.84 / 60.67 61.53 / 60.53
Δ% Emissions (CHP/TRI) 51.21 / 68.96 50.01 / 68.26
Electrical import cost and emission factor = 0.172£.kWh-1[40]
and 0.555kgCO2.kWh-1[41] / Natural gas import cost and
emission factor = 0.0421 £.kWh-1and 0.184kg CO2.kWh-1[42]
406
The system integration, based on empirical data, demonstrates high tri-generation system 407
efficiency in the range of 68-71% is attainable when combining SOFC and liquid desiccant 408
air conditioning technology. The SOFC unit has a low heat to power ratio, particularly at 409
the 1.5kWe condition, this is because it is an electrically optimised device (fuel utilisation 410
of ~85%). As a result, there is limited thermal output available for desiccant solution 411
regeneration. However, the liquid desiccant system, operating with a potassium formate 412
solution at a 0.65–0.7 solution mass concentration, has a low regeneration temperature 413
generate a meaningful quantity of dehumidification/cooling. At the 2kWe condition, 415
electrical efficiency is lower, but the thermal efficiency is higher. As a result, almost 650W 416
of cooling is produced. The inclusion of liquid desiccant air conditioning technology 417
provides an efficiency increase of 9-15% compared to SOFC electrical operation only, 418
demonstrating the potential of the system in building applications that require 419
simultaneous electrical power, heating and/or dehumidification/cooling. The performance 420
of the novel tri-generation system is competitive with other systems of this capacity 421
reported in the literature [7, 9, 22, 43]. 422
423
Table 1 shows that CHP and tri-generation efficiency is highest for the 2kWecase. However 424
the primary energy demand (PED), cost and emission savings, compared to an equivalent 425
base case system are highest for the 1.5kWe case. The base case system is defined as a 426
conventional separate system, comprising grid electricity, natural gas fired boiler and 427
electrically driven vapour compression system (VCS). The capacities of the base case 428
system components are assumed equal to the respective electrical (1.5kWe / 2.0kWe), 429
heating and cooling capacities of the tri-generation system employed in the comparison. 430
The electrical efficiency of the base case system has been assumed as 33%, a figure 431
considering the efficiency of utility scale electrical generation plus transmission losses [9]. 432
The thermal efficiency of the gas fired boiler has been assumed as 90%. The electrical 433
coefficient of performance (COPel) of the VCS is assumed constant at 2 [44]. Thus, the 434
overall efficiency of the base case system can be calculated for any given electrical, heat 435
and cooling output from the SOFC CHP / tri-generation system. Table 1 lists the associated 436
cost and emission factors of grid electricity and natural gas used in the assessment. These 437
are typical of the UK. Because electricity has a higher associated cost and emission 438
compared to natural gas, greater savings are made for the 1.5kWecase due to the higher 439
electrical efficiency. In tri-generation cooling mode, relative cost and emission reductions 440
70% respectively, demonstrating the potential of a first-of-its-kind SOFC liquid desiccant 442
tri-generation system for building applications. 443
444
Section 2 has validated, empirically, the integration of SOFC and liquid desiccant 445
technology into an efficient and effective tri-generation system. The energetic performance 446
analysis demonstrates high tri-generation system efficiency is attainable at low system 447
capacities. The encouraging performance is primarily due to the high electrical efficiency 448
of the SOFC and the reasonable COPth of the liquid desiccant system when operating on 449
low grade waste heat. The operational issues encountered with the SOFC illustrate the real 450
challenge of fuel cell deployment in the built environment. Reliability, durability and cost 451
currently pose a great barrier to fuel cell’s wider use. Not until these issues are addressed 452
will the operational advantages of fuel cells operating in the built environment be fully 453
3 Emission
and
economic
performance
analysis
455assessment
456The aim of this section is to conduct a detailed economic and emission performance 457
analysis assessment of the novel SOFC liquid desiccant tri-generation system. This is to 458
determine whether it is a viable alternative to other comparable systems. The assessment 459
uses the SOFC tri-generation system performance data presented in Table 1 operating at 460
a 1.5kWe and 2.0kWe capacity, and compares it to an equivalent base case system 461
comprising grid electricity, natural gas fired boiler and electrically driven VCS. As in the 462
energetic analysis, presented in section 2.3, the capacities of the base case system 463
components are assumed equal to the respective electrical (1.5kWe / 2.0kWe), heating 464
and cooling capacities of the tri-generation system employed in the comparison. The 465
electrical efficiency of the base case system has been assumed as 33%, thermal efficiency 466
of the gas fired boiler has been assumed as 90% and the COPel of the VCS is assumed 467
constant at 2. 468
469
3.1 Economic assessment
470
In this section, an economic assessment of the novel SOFC liquid desiccant tri-generation 471
system operating within a UK and worldwide economic climate is presented. The economic 472
assessment compares the 1.5kWe and 2.0kWe capacity tri-generation systems to an 473
equivalent base case system over a 15 year time period. The economic evaluation metrics 474
used are: net present cost (NPC), equivalent uniform annual cost (EUAC) and simple pay-475
back period (SPBP). The unit cost of electricity, unit cost of natural gas and the capital 476
cost of the SOFC are varied, in a reasonable range, to carry out a sensitivity analysis of 477
the NPC and SPBP. Using electrical unit cost data published by the International Energy 478
Agency [45], the economic performance of the tri-generation system in the context of 479
3.1.1 Economic assessment metrics
482
NPC, EUAC and SPBP are used to assess the economic performance of the novel SOFC 483
liquid desiccant tri-generation system compared to a base case system. 484
485
3.1.1.1 Net present cost (NPC) 486
Net present value (NPV) is an economic tool used to equate the total cost of a project over 487
a specified time period to the total cost today, taking in to account the time value of 488
money. NPV is a good indicator of how much value an investment or project brings to an 489
investor, and is widely used in economic engineering to assess feasibility. However, there 490
are many kinds of systems or projects, such as the SOFC tri-generation system, where 491
there are no sales or incomes. In this case it is common to use net present cost (NPC). 492
Equation 5 is used to calculate NPC [23]. 493
494
NPC = (1 +ܣܣ்݅
)+ܫ ே
௧ୀ
495
5
496 497
AATCis the adjusted annual total costs (£),iris the interest rate,n is the year number and 498
Iccis the initial capital cost (£). Selection of a suitable interest/discount rate is based upon 499
risk, opportunity cost or an alternative investment. In engineering based analysis 7% is a 500
widely used value [23]. If inflation is being considered, the adjusted annual total cost 501
(AATC) is calculated using Equation 6. 502
503
ܣܣ்=ܣ்൫1 +݅൯
504
6
ATC is the non-adjusted annual total costs (£), if is the inflation rate and n is the year 507
number. The scrap value (SV) of the system at the end of the project’s life should be 508
considered, and subtracted from the final expenditure. In NPC analysis the annual total 509
expenditure or costs (AATC) are given as positive figures, and thus the NPC at the end of 510
a system lifetime will be positive. When two or more systems are being evaluated over 511
the same time period, the system with the lowest NPC should be selected. 512
513
3.1.1.2 Equivalent uniform annual cost (EUAC) 514
The equivalent uniform annual cost (EUAC) is the annual cost of the project or system 515
equivalent to the discounted total cost or NPC. EUAC is calculated by multiplying the NPC 516
by the capital recovery factor (CRF) as shown in Equation 7. 517
518
EUAC = NPCቈ(1 +݅(1 +݅ ݅)
)− 1
519
7
520 521
3.1.1.3 Simple pay-back period (SPBP) 522
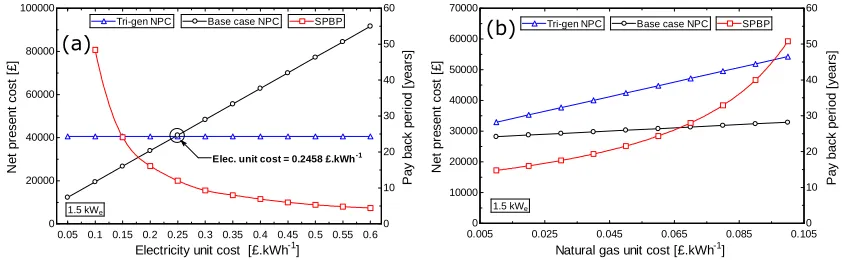
The simple pay-back period (SPBP), shown in Equation 8, is used to determine the time 523
required to recoup the funds expended in an investment, or to reach the break-even point. 524
Generally, in engineering projects investors consider a SPBP of five years as acceptable. 525
The SPBP does not account for the time value of money; however it is a useful tool for the 526
quick assessment of whether a project or system is a viable option. 527
528
SPBP = ܫ
Annual savings
529
8
Icc is the is the initial capital cost of the system (£). Annual savings are calculated by 532
subtracting the annual total cost (ATC) of the base case system from the annual total cost 533
of the proposed system. 534
535
Table 2 lists the constants used for the economic assessment of the novel tri-generation 536
and equivalent base case system. Where relevant, these constants are adopted in the 537
environmental assessment in section 3.2. 538
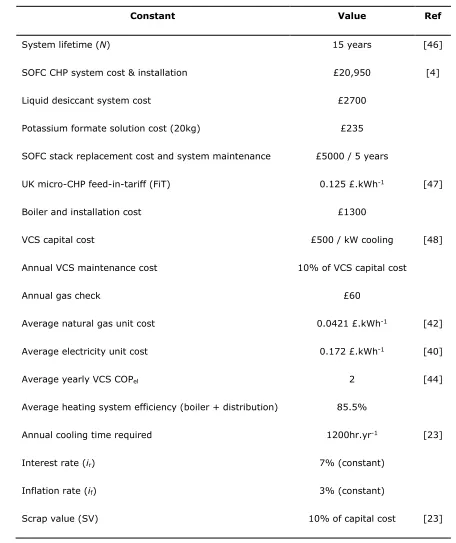
Table 2 Economic and environmental assessment constants
541
Constant Value Ref
System lifetime (N) 15 years [46]
SOFC CHP system cost & installation £20,950 [4]
Liquid desiccant system cost £2700
Potassium formate solution cost (20kg) £235
SOFC stack replacement cost and system maintenance £5000 / 5 years
UK micro-CHP feed-in-tariff (FiT) 0.125 £.kWh-1 [47]
Boiler and installation cost £1300
VCS capital cost £500 / kW cooling [48]
Annual VCS maintenance cost 10% of VCS capital cost
Annual gas check £60
Average natural gas unit cost 0.0421 £.kWh-1 [42]
Average electricity unit cost 0.172 £.kWh-1 [40]
Average yearly VCS COPel 2 [44]
Average heating system efficiency (boiler + distribution) 85.5%
Annual cooling time required 1200hr.yr-1 [23]
Interest rate (ir) 7% (constant)
Inflation rate (if) 3% (constant)
Scrap value (SV) 10% of capital cost [23]
542
In the UK, fuel cell CHP of 2.0kWeor less qualifies for the micro-generation FiT [47]. Under 543
this scheme, the UK government pays 0.125£.kWh-1 of electricity generated, regardless 544
of whether it is consumed or exported. Where relevant, the economic assessment 545
3.1.2 Economic assessment results
547
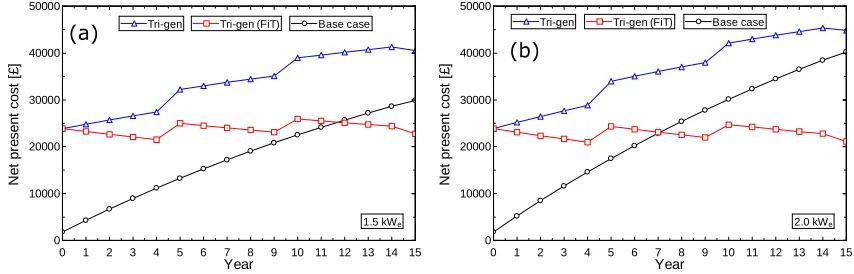
Figure 7a and Figure 7b show the respective NPC of the 1.5kWeand 2.0kWetri-generation 548
systems and equivalent base case systems over a 15 year period. The assessment 549
considers the performance of the tri-generation system with and without FiT support. The 550
initial NPC in year 0 is the system investment cost, which is much higher for the tri-551
generation system compared to the base case. The NPC of the systems increases over 552
time due to the annual operating costs. The tri-generation system with FiT support displays 553
only a marginal increase in the NPC over the 15 year period because the FiT almost pays 554
for the annual operating cost of the system. For the tri-generation systems, an NPC spike 555
is seen at year five and ten; this is due to the stack replacement requirement. The small 556
dip in NPC at year 15 is due to the scrap value of the systems. 557
558
[image:27.595.83.510.373.510.2]559
Figure 7 NPC comparison at a 1.5kWein (a) and 2.0kWein (b) capacity between the tri-560
generation system with and without the FiT and the base case system
561 562
Table 3 presents the NPC, EUAC and SPBP results for the tri-generation and base case 563
systems. 564
565 566
0 1 2 3 4 5 6 7 8 9 10 11 12 13 14 15
0 10000 20000 30000 40000 50000 Year
Tri-gen Tri-gen (FiT) Base case
1.5 kWe
N e t p re s e n t c o s t [£ ]
0 1 2 3 4 5 6 7 8 9 10 11 12 13 14 15
0 10000 20000 30000 40000 50000 Year
Tri-gen Tri-gen (FiT) Base case
2.0 kWe
Table 3 Economic assessment results
567
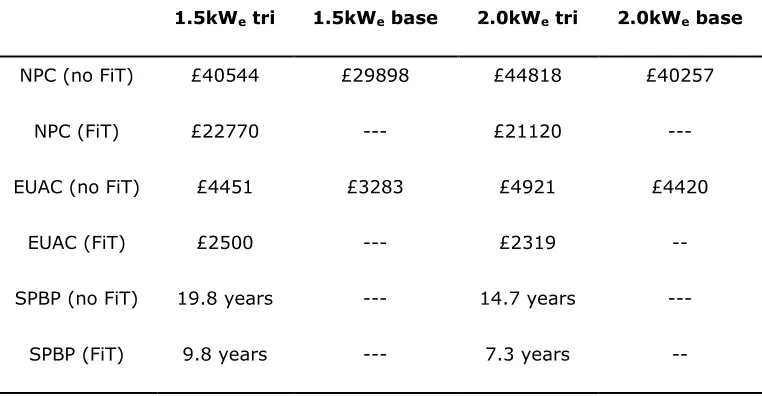
1.5kWetri 1.5kWebase 2.0kWetri 2.0kWebase
NPC (no FiT) £40544 £29898 £44818 £40257
NPC (FiT) £22770 --- £21120
---EUAC (no FiT) £4451 £3283 £4921 £4420
EUAC (FiT) £2500 --- £2319
--SPBP (no FiT) 19.8 years --- 14.7 years
---SPBP (FiT) 9.8 years --- 7.3 years
--568
Without FiT support, the NPC of both the 1.5kWe and 2.0kWetri-generation systems are 569
26% and 10% higher than the equivalent base case systems respectively. However, with 570
FiT support there is a 31% and 90% reduction in the NPC of the 1.5kWe and 2.0kWe tri-571
generation systems compared to the equivalent base case systems respectively. When the 572
FiT is considered the annual revenue means the tri-generation systems have a favourable 573
NPC compared to the base case in year 11.5 for the 1.5kWe tri-generation system and 574
year 7 for the 2.0kWetri-generation system. The NPC of the 1.5kWetri-generation system 575
is lower than the 2.0kWetri-generation system when no FiT is considered, but higher when 576
the FiT is considered. The higher NPC seen in the 2.0kWe tri-generation system without 577
FiT is due to the higher fuel input requirement, and thus higher annual operating costs. 578
However, when FiT is considered the 2.0kWetri-generation system provides greater annual 579
revenues and thus a lower NPC. Both with and without FiT support, the 2.0kWe tri-580
generation system has a lower SPBP compared to the 1.5kWe tri-generation system. 581
Although the 2.0kWe tri-generation system suffers an electrical efficiency reduction and 582
thus a greater fuel input, the higher electrical capacity means it is offsetting more grid 583
derived electricity. Per kWh, grid derived electricity has a higher associated cost compared 584
equivalent base case system requires more grid derived electricity for the VCS. In all cases 587
the tri-generation systems generate annual operating cost savings compared to the base 588
case systems. The high NPC and SPBP of the tri-generation systems are therefore due to 589
the capital cost of the SOFC. 590
591
Figure 8a compares the economic performance of the 1.5kWe tri-generation system and 592
equivalent base case system with respect to the unit cost of electricity. No FiT is 593
considered. The unit cost of electricity does not affect the NPC of the tri-generation system, 594
only the base case system. As the unit cost of electricity increases from 0.05 to 0.6£.kWh -595
1 the NPC of the base case system increases, and thus the economic feasibility of the tri-596
generation system improves. At an electrical unit cost of 0.2458£.kWh-1 there is a NPC 597
break-even point between the tri-generation and base case system. Above 0.2458£.kWh -598
1 the 1.5kWe tri-generation system has a better (lower) NPC and should be considered 599
over the base case system. At an electrical unit cost of 0.2458£.kWh-1 the tri-generation 600
system has a SPBP of 12 years. For the SPBP to fall below five years, an electrical unit 601
cost of 0.55£.kWh-1 is required. In comparison, the 2.0kWe tri-generation system has a 602
NPC break-even electrical unit cost of 0.1955£.kWh-1. Due to the continual rise in utility 603
electricity prices, the break-even electrical unit cost which produces tri-generation system 604
economic feasibility are realistic and not far off current prices as demonstrated in Figure 605
608
Figure 8 NPC and SPBP comparison between the 1.5kWetri-generation system and base
609
case system with (a) electricity unit cost, and (b) natural gas unit cost
610 611
Figure 8b compares the economic performance of the 1.5kWe tri-generation system and 612
equivalent base case system with respect to the unit cost of natural gas. No FiT is 613
considered. Natural gas unit cost affects both the tri-generation and base case system’s 614
NPC. As the unit cost of natural gas increases from 0.01 to 0.1£.kWh-1 the NPC of both 615
the tri-generation and base case systems increase. The tri-generation system is more 616
sensitive to changes in the unit cost of natural gas compared to the base case system due 617
to a greater proportionate demand. For the 1.5kWe tri-generation system there is not a 618
natural gas unit cost that makes the tri-generation system favourable i.e. a NPC break-619
even point. As the natural gas unit price is increased the reduction in NPC between the 620
base case and tri-generation system increases, and as a result the SPBP increases. As the 621
natural gas unit cost is increased from 0.01£.kWh-1 to 0.1£.kWh-1 the tri-generation 622
system SPBP increases from 14 years to 51 years. The 2.0kWetri-generation system does 623
have a NPC break-even natural gas unit cost of 0.0233£.kWh-1. However this is very low 624
and not realistic in the current economic climate where fossil fuels have such value. 625
626
Figure 9 shows the NPC of a 1.5kWe and 2.0kWeequivalent base case system in a range 627
of different counties with respect to electrical unit cost data published by the International 628
Energy Agency [45]. The NPC of the respective tri-generation systems (horizontal lines) 629
are plotted to indicate which countries the novel system is currently economically viable 630
0.05 0.1 0.15 0.2 0.25 0.3 0.35 0.4 0.45 0.5 0.55 0.6 0 20000 40000 60000 80000 100000 0 10 20 30 40 50 60
Electricity unit cost [£.kWh-1]
N e t p re s e n t c o s t [£ ]
Tri-gen NPC Base case NPC
Elec. unit cost = 0.2458 £.kWh-1
1.5 kWe P a y b a c k p e ri o d [y e a rs ] SPBP
0.005 0.025 0.045 0.065 0.085 0.105 0 10000 20000 30000 40000 50000 60000 70000 0 10 20 30 40 50 60
Natural gas unit cost [£.kWh-1]
N e t p re s e n t c o s t [£ ]
Tri-gen NPC Base case NPC
2.0kWe) is only economically viable in Denmark where the unit cost of electricity is 632
0.262£.kWh-1. The largest different between the NPC of the tri-generation and base case 633
system is in China, where the unit cost of electricity is as low as 0.0512£.kWh-1. Based 634
purely on economic performance, the novel tri-generation system is more suited to 635
European locations, where on average the unit cost of electricity is higher than Asia and 636
the Americas. As discussed in Figure 8a, the 2.0kWe tri-generation system has a lower 637
NPC break-even electrical unit cost. As a result, the 2.0kWe system is almost feasible in 638
the current Australian economic climate. Section 3.2 assesses the environmental 639
performance of the tri-generation system in the same countries. The aim is to highlight 640
any geographical similarities or differences between the economic and environmental 641
feasibility of the novel system. 642
643
[image:31.595.158.439.371.569.2]644
Figure 9 NPC comparison between the 1.5kWeand 2.0kWetri-generation system and
645
base case system with respect to country of operation
646 647
Figure 10a shows the NPC of the 1.5kWetri-generation system and equivalent base case 648
system with respect to the SOFC capital cost. The capital cost of the tri-generation system, 649
operating at a 1.5kWecapacity, needs to be £9715 or less for it to be economically viable 650
compared to the base case system. At a 2.0kWecapacity the required SOFC capital cost is 651
£16135. As the capital cost of the SOFC increases, the SPBP increases. At the 1.5kW NPC 652 0 10000 20000 30000 40000 50000 60000 70000 80000 0 0.05 0.1 0.15 0.2 0.25 0.3 D e n m a rk A u st ra li a U K F ra n c e U S A C a n a d a C h in a (i n c . H K ) N e t p re s e n t c o s t [£ ] E le c tr ic it y u n it c o s t [£ .k W h -1]
2.0kWebase
1.5kWebase
2.0kWetri
break-even point of £9715 the SPBP is 12.8 years. Although not shown in Figure 10a, 653
variation in the liquid desiccant system capital cost has a negligible impact on NPC and 654
SPBP. Reducing the liquid desiccant system capital cost by 50% results in a 4.5% reduction 655
in the SPBP. Reducing the SOFC capital cost by 50% results in a 32% reduction in the 656
SPBP, demonstrating that tri-generation system economic viability presides with reducing 657
the capital cost of the SOFC. 658
659
[image:32.595.84.507.250.394.2]660
Figure 10 NPC and SPBP comparison between the 1.5kWetri-generation system and
661
base case system with (a) SOFC capital cost, and (b) electricity unit cost and SOFC
662
capital cost
663 664
Figure 10b shows the NPC for the 1.5kWetri-generation and equivalent base case system 665
with respect to SOFC capital cost and unit cost of electricity respectively. Up to an 666
electricity unit cost of 0.11£.kWh-1 the base case system is always better than the tri-667
generation system. However at the electrical unit cost reference value of 0.172£.kWh-1, 668
the 1.5kWe tri-generation system is competitive when the SOFC capital cost is less than 669
£9500. At the intersection point, the tri-generation system is economically favourable if 670
the SOFC capital cost is less than £4750 with an electrical unit cost of greater than 671
0.14£.kWh-1(i.e. UK, Australia). 672
673
0 5000 10000 15000 20000 25000
0 10000 20000 30000 40000 50000 0 10 20 30 40 50 60
SOFC capital cost [£]
N e t p re s e n t c o s t [£ ]
Base case NPC Tri-gen NPC
1.5 kWe
SOFC cost = £9715 SPBP P a y b a c k p e ri o d [y e a rs ]
0.05 0.1 0.15 0.2 0.25 0.3 0.35 0.4 0.45 0.5 0.55 0.6 0
20000 40000 60000 80000
1000000 5000 10000 15000 20000 25000
Base case NPC Tri-gen NPC
Electricity unit cost [£.kWh-1]
SOFC capital cost [£]
3.1.3 Economic assessment conclusions
674
Within a UK economic climate it has been demonstrated that the NPC of the novel tri-675
generation system is only favourable when FiT is considered, in which case the 2.0kWe 676
output is best. The tri-generation system has a lower annual operating cost than the base 677
case; however, NPC and SPBP analysis demonstrates that the novel system is currently 678
uneconomical. This is primarily due to the SOFC capital cost and the requirement of stack 679
replacement, not the liquid desiccant unit capital cost. In the current UK economic climate 680
the SOFC capital cost needs to be less than £9000 for the tri-generation system to be 681
competitive. This is a cost estimate supported by Staffell and Green [49] in their economic 682
evaluations of SOFC CHP systems. PEMFC technology has demonstrated considerable price 683
reduction over the last six years. The 1kWe Panasonic unit had a unit cost of £27,300 in 684
2009, but as of 2015 it is being supplied to energy companies for £3600. CFCL forecast 685
that they can supply the BlueGEN SOFC unit for £5200 once in mass production. Currently, 686
the much lower PEMFC unit costs are due to the technology being around five years ahead 687
of SOFC [4]. Many commercial developers believe the future of cheaper fuel cell technology 688
lies with SOFC systems as they do not need to use expensive platinum catalysts like 689
PEMFC. Based on the example of PEMFC cost reductions, significant SOFC cost reductions 690
can be anticipated. The SOFC cost target figures presented are therefore sensible and 691
could be realistically achieved in the next five to ten years, making the tri-generation 692
system economically viable in almost all cases. 693
694
Currently, the tri-generation system becomes competitive, and even demonstrates good 695
profitability, compared to the base case system when a government’s financial support, 696
such as the FiT, is considered. However, with continued instability in governmental support 697
for low carbon sustainable energy, the novel tri-generation system needs to become 698
economically viable in its own right for it to be considered a viable alternative to 699
conventional energy supply. Furthermore, a 2.0kWe base load capacity is large, and 700
context. With the possibility of future withdrawal of the UK government’s financial support 702
for fuel cell CHP technology, maximising in-house electrical consumption will be essential 703
to maintain economic viability. A lower electrical capacity fuel cell would therefore be 704
required. The Japanese domestic market, which is estimated to be ten years ahead of the 705
European market, is now focussing domestic fuel cell CHP development at capacities of 706
750We [2], a possible insight into the future of where European domestic fuel cell 707
development needs to go. 708
709
Like other small scale tri-generation systems presented in the literature, the economic 710
performance of the SOFC liquid desiccant tri-generation system is most sensitive to the 711
unit cost of natural gas [20]. The tri-generation system is economically superior compared 712
to the base case system when the unit cost of electricity is greater than 0.24£.kWh-1and 713
as a result Denmark is currently the only country investigated where the tri-generation is 714
economically viable. However, with the extraction of easily accessible fossil fuels 715
diminishing, the unit cost of electricity in many countries is set to continue to rise thus 716
strengthening the economic case of the novel tri-generation system [50]. 717
718
3.2 Environmental assessment
719
In this section, an environmental assessment of the novel tri-generation system operating 720
within a UK energy system context is presented. The environmental assessment compares 721
the 1.5kWe and 2.0kWe tri-generation system to an equivalent base case system. The 722
evaluation metric used in the environmental assessment is the annual CO2 emission. This 723
is determined through the multiplication of the annual natural gas and electrical demand 724
by their respective emission factors and summing the result. The emission factors of 725
natural gas and electricity are varied, in a reasonable range, to carry out a sensitivity 726
analysis of the environmental performance. Using electrical emission factor data published 727
used for the environmental assessment of the novel tri-generation and equivalent base 730
case system are listed in Table 2. The emission factors used are based on a UK energy 731
system context, and are as follows: 732
733
Average natural gas emission factor: 0.184 kg CO2.kWh-1[42] 734
Average electricity emission factor: 0.555 kg CO2.kWh-1[41] 735
736
Table 4 presents the environmental assessment results. The 1.5kWe and 2.0kWe tri-737
generation systems produce a respective 51.3% and 50.2% reduction in annual CO2 738
emissions compared to the equivalent base case systems. 739
740
Table 4 Environmental assessment results
741
Annual emissions (kg CO2)
1.5kWetri 4030
1.5kWebase 8282
2.0kWetri 5756
2.0kWebase 11567
742
Figure 11a shows the annual CO2 emissions of the 1.5kWe and 2.0kWe tri-generation 743
systems and equivalent base case systems with respect to natural gas emission factor. 744
Over the investigated natural gas emission factor range of 0.05 to 0.3kgCO2.kWh-1, the 745
tri-generation system always has a lower annual CO2 emission. Both the tri-generation 746
and base case systems have a natural gas requirement. However, the greater 747
proportionate natural gas demand in the tri-generation system means its annual CO2 748
emission reductions are more sensitive to changes in the natural gas emission factor. 749
Consequently, as the natural gas emission factor is increased, the relative reduction in 750
2.0kWe tri-generation system is more sensitive to changes in the natural gas emission 752
factor than the 1.5kWetri-generation system due to a lower electrical efficiency. 753
754
[image:36.595.88.504.151.287.2]755
Figure 11 Annual CO2emission comparison between the 1.5kWeand 2.0kWe tri-756
generation systems and equivalent base case system with (a) natural gas emission
757
factor, and (b) electricity emission factor
758 759
Figure 11b shows the annual CO2 emissions of the 1.5kWe and 2.0kWe tri-generation 760
systems and equivalent base case systems with respect to electrical emission factor. The 761
tri-generation system has no electrical demand, and thus only the base case system is 762
affected by the electrical emission factor. The tri-generation systems have a lower annual 763
CO2 emission compared to the equivalent base case systems when the electrical emission 764
factor is greater than 0.2363kgCO2.kWh-1for the 1.5kWecase and 0.2305kgCO2.kWh-1for 765
the 2.0kWecase. 766
767
Figure 12 shows the annual CO2emissions of the 1.5kWeand 2.0kWeequivalent base case 768
systems in a range of different counties using electrical emission factor data published by 769
Brander et al. [51]. The annual CO2 emissions of the respective tri-generation systems 770
(horizontal lines) are plotted to indicate the countries in which the novel system is 771
currently environmentally viable. The 1.5kWe and 2.0kWe tri-generation systems are 772
feasible in all the countries investigated except France and Norway as these countries have 773
0.05 0.1 0.15 0.2 0.25 0.3
0 2000 4000 6000 8000 10000 12000 14000
Natural gas emission factor [kg CO2.kWh-1]
A n n u a l C O2 e m is s io n s [k g ]
1.5kWetri 2.0kWebase
1.5kWebase 2.0kWetri
0 0.2 0.4 0.6 0.8 1 1.2
0 5000 10000 15000 20000 25000
1.5kWetri 2.0kWebase
1.5kWebase
2.0kWetri
Electricity emission factor [kg CO2.kWh-1]
have an energy system that is largely characterised by the use of nuclear and renewables. 775
As a result, the average electrical emission factor is low. Figure 12 shows that the 1.5kWe 776
and 2.0kWe tri-generation system is most environmentally viable in Australia and China. 777
Australia and China generate a large proportion of their electricity from coal, which has a 778
high emission factor per kWh of electricity generated, and thus strengthens the 779
environmental benefit of adopting the novel tri-generation system. Based on the data 780
presented in Figure 9 and Figure 12, Denmark is currently the only country investigated 781
where the novel tri-generation system is both economically and environmentally viable. 782
Interestingly, the countries where the tri-generation system is not economically feasible 783
due to a low electrical unit cost are in general the countries in which the system is most 784
environmentally feasible i.e. Australia and China. This is primarily due to cheap electrical 785
generation from easily accessible, more polluting fuels such as low grade coal. 786
787
[image:37.595.160.434.393.592.2]788
Figure 12 Annual CO2emission comparison between the 1.5kWeand 2.0kWe tri-789
generation systems and equivalent base case system with respect to country of
790
operation
791 792
3.2.1 Environmental assessment conclusions
793
The environmental assessment has demonstrated that the tri-generation system is 794
environmentally viable in almost all scenarios. In a UK energy system context the tri-795 0 5000 10000 15000 20000 25000 0 0.1 0.2 0.3 0.4 0.5 0.6 0.7 0.8 0.9 1 1.1
1.5kWebase
A u s tr a li a C h in a (i n c . H K ) U K U S A P o rt u g a l D e n m a rk C a n a d a F ra n c e N o rw a y
2.0kWebase
A n n u a l C O2 e m is s io n s [k g ]
2.0kWetri
1.5kWetri
generation system generates up to 51% annual CO2emission reductions compared to the 796
base case. Over the investigated natural gas emission factor range, the tri-generation 797
system is always superior. The tri-generation system’s environmental performance is not 798
directly influenced by changes in the electrical emission factor, however the base case is. 799
As a result, changes in the electrical emission factor have a marked impact on the relative 800
performance of the generation system with respect to the base case system. The tri-801
generation system is environmentally viable when the electricity emission factor is greater 802
than 0.23kg CO2.kWh-1. France and Norway have a large nuclear and renewable (hydro-803
electric) energy capacity. As a result, their electricity emission factor is low, and thus the 804
tri-generation system does not provide an environmental benefit in such a setting. 805
Countries such as Australia and China demonstrate the greatest environmental benefit 806
from adopting the novel tri-generation system. As Berger [5] states, the move to a 807
hydrogen economy and with it the transition from the use of hydrocarbon to pure 808
hydrogen-fed fuel cells in the next 30 years provides the potential for highly efficient, zero 809
carbon energy conversion. With such a transition the novel tri-generation system would 810
4 Conclusions
812This paper has served to provide a performance analysis assessment of a novel SOFC 813
liquid desiccant tri-generation system for building applications. Using empirical SOFC and 814
liquid desiccant component data, an energetic, economic and environmental performance 815
analysis assessment of a first-of-its-kind system has been completed. No previous work 816
on such a system has been identified in the literature. With reference to the paper’s specific 817
aims set out in the introduction, conclusions of the paper’s performance analysis 818
assessment are as follows: 819
820
(1) SOFC and liquid desiccant are a viable technological pairing in the development of 821
an efficient and effective tri-generation system. High tri-generation efficiencies in 822
the range of 68-71% are attainable. This is primarily due to the high electrical 823
efficiency of the SOFC and the reasonable COPthof the liquid desiccant system when 824
operating on low grade waste heat. 825
(2) The inclusion of liquid desiccant air conditioning technology provides an efficiency 826
increase of 9-15% compared to SOFC electrical operation only, demonstrating the 827
potential of the system in building applications that require simultaneous electrical 828
power, heating and/or dehumidification/cooling. 829
(3) Compared to an equivalent base case system, the tri-generation system is currently 830
only economically viable with a government’s financial support. SOFC capital cost 831
and stack replacement are the largest inhibitors to economic viability. 832
Environmental performance is closely linked to electrical emission factor, and thus 833
performance is heavily country dependent. 834
(4) The countries, in which the system is environmentally viable, are in general the 835
counties in which the system is not economically feasible. This is primarily due to 836
the play off between cheap electrical generation from fossil fuels and more 837
(5) The economic and environmental feasibility of the novel tri-generation system will 839
improve with predicted SOFC capital cost reductions and the transition to clean 840
hydrogen production. 841
842
Although the novel tri-generation system concept has been demonstrated, future work 843
needs to focus on improving the current unreliability and durability of fuel cell technology, 844
along with reducing its capital cost. 845
![Figure 4 (a) SOFC electrical efficiency and thermal output [38], and (b) WHR flow water](https://thumb-us.123doks.com/thumbv2/123dok_us/8600195.372413/13.595.88.510.72.209/figure-sofc-electrical-efficiency-thermal-output-whr-water.webp)