1
On void structure and strength of foamed concrete made without/with
1additives
2Ameer A. Hilal*ab, Nicholas Howard Thoma, Andrew Robert Dawsona 3
a
Department of Civil Engineering, Faculty of Engineering, University of Nottingham, University
4
Park, Nottingham NG7 2RD, UK Tel: +44 (0) 115 846 8427, Fax: +44 (0) 115 951 3909.
5
bCivil Engineering Department, Faculty of Engineering, University of Anbar, Iraq. 6
*Corresponding author, E-mail: [email protected], [email protected] 7
8
Abstract 9
A study has been undertaken to investigate the effect of different additives on the strength of
10
foamed concrete by characterising air-void size parameters and identifying the influence of
11
these parameters and changes to cement paste microstructure on strength. Nine different
12
mixes, made using a pre-formed foam, were investigated with varying density (nominally
13
1300, 1600 and 1900 kg/m3) without/with additives (silica fume, fly ash and
14
superplasticizer), used either individually or together. Optical microscopy and scanning
15
electron microscopy were used in this investigation. Compared to the conventional mixes,
16
inclusion of additives (individually or in combination) helped to improve both the cement
17
paste microstructure and air-void structure of foamed concrete. For a given density, although
18
the additives in combination led to increased void numbers, higher strength was achieved due
19
to reduced void size and connectivity, by preventing their merging and producing a narrow
20
void size distribution. Furthermore, adding a superplasticizer on its own resulted in a void
21
structure fairly similar to that from all additives in combination, implying that it is the
22
superplasticizer that has the greatest influence on voids. Not only enhancement of void
23
structure but also improved cement paste microstructure both contribute to the strength of the
24
foamed concrete.
25
26
Keywords: Foamed concrete, Mineral additives, Superplasticizer, Pore structure, Strength. 27
28
1. Introduction 29
In aerated concrete, the structure is affected by the method of pore-formation (gas or
30
foaming) and is characterised into a micro-porous matrix and macropores [1]. Foamed
31
concrete is a particular example of aerated concrete in which addition pores have been
2
introduced by the introduction of either preformed foam or by chemical action after mixing.
33
In the study reported here, preformed foam was applied.
34
Ramamurthy et al. [2] and Nambiar and Ramamurthy [3], mentioned that air-void distribution
35
is one of the most significant micro-properties influencing strength of foamed concrete and
36
Ramamurthy et al. [2] found that foamed concrete with narrower air-void size distribution
37
shows higher strength.
38
The pore structure of foamed concrete is classified as gel pores, capillary pores and air-voids
39
(air entrained and entrapped pores) [2, 4]. In addition, the air-voids in the foamed concrete
40
may be characterized by parameters such as volume, size, shape, size distribution and spacing
41
between air-voids [3]. To investigate this, image analysis software was used on images of
42
specimens captured by using an optical microscope.
43
Although the compressive strength of porous materials has been expressed as a function of
44
porosity by many researchers, some have mentioned that determination of total air void
45
content (porosity) is not sufficient as shape, size and distribution of voids may affect the
46
strength and durability of foamed concrete [5].
47
Kearsley [5] investigated the microstructure of foamed concrete produced with the inclusion
48
of either classified (pfa) or unclassified (Pozz-fill) fly ash with nominal densities 1000, 1250
49
and 1500 kg/m3. It was found that, at any given density, there was no obvious effect of
50
median void diameter on the compressive strength. 51
Nambiar and Ramamurthy [3] determined the air void size distribution of foamed concrete
52
mixes with different added foam volumes (10%, 30% and 50%) and found that the size of the
53
larger voids increased sharply with an increase in foam volume, while for the same foam
54
volume they were smaller for a cement-fly ash mix compared to a cement-sand mix. In
55
addition, D90 (90th percentile) correlated better with strength than D50 (median pore size)
56
indicating that it was the larger pores that influenced the strength more than the smaller pores.
57
Thus, it is well known that with the same matrix and void volume (porosity), the strength of
58
material containing more large-size voids is lower. This paper aims to investigate, from pore
59
structural and cement paste microstructural points of view, the strength of foamed concretes
60
having the same air void contents, for a given density, but different matrices produced by
61
using different additives (individually and in combination). This will be achieved by:
62
Determining and comparing the size distributions of air voids of the foamed concrete
63
mixes without/with different additives.
64
Identifying the influence of size parameters on strength.
65
Investigating the effect of cement paste improvement on foamed concrete strength.
3 2. Materials, mix proportions and production 67
Full details of the materials used, mix proportions and production process can be found in a
68
previous publication [6], but essential information can be summarized as follows:
69
2.1 Materials 70
To produce conventional foamed concrete, the following constituent materials were used in
71
this study.
72
Portland cement, CEM I-52,5 N (3.15 S.G.) conforming to BS EN 197-1:2011 [7].
73
Natural sand (2.65 S.G.) conforming to BS 882:1992 [8] with additional sieving to remove
74
particles greater than 2.36 mm.
75
Fresh, clean and drinkable water.
76
Foam (45 kg/m3) was produced by blending the foaming agent, EABASSOC (1.05 S.G.),
77
water and compressed air in predetermined proportions (45 g water to 0.8 ml foaming
78
agent) in a foam generator, STONEFOAM-4.
79
Then, to improve the cement paste microstructure and the air-void structure, the following
80
additives were used individually or together depending on the desired mixes (see Table 1):
81
Silica fume: Elkem Microsilica (2.2 S.G., 92% SiO2, mean particle size 0.15 μm and
82
specific surface 20 m2/g).
83
Fly Ash: CEMEX fly ash-class S (2.09 S.G.) conforming to BS EN 405-1:2005 [9].
84
Superplasticizer : MIGHTY 21 EG made by Kao Chemical GmbH of density 1.1 g/cm3,
85
compatible with the EABASSOC foaming agent.
86
2.2 Mix proportions 87
In this study, nine differently proportioned mixes were designed as follows: conventional
88
mixes FC and modified mixes using all additives together FCa at three nominal densities,
89
1300 (FC3 and FCa3), 1600 (FC6 and FCa6) and 1900 (FC9 and FCa9) kg/m3; three further
90
mixes at 1600 kg/m3 with individual additives, silica fume (FCs6), fly ash (FCf6) and
91
superplasticizer (FCp6), see Table (1).
92
Mix proportioning began with the selection of the target density (1300-1900 kg/m3), the
93
cement content and the water to cement ratio. The mix was then proportioned by the method
94
of absolute volumes. For each mix the water/binder ratio required to produce a stable mix
95
(fresh density to target density ratio close to unity) was determined by trials while the
96
required foam volume was determined from the mix design. A dosage of superplasticizer
97
(1.5% of binder weight) was adopted for all relevant mixes. Silica fume was added to four of
4
the mixes at 10% of the cement weight (see Table 1). Fly ash replacement was limited to
99
20% by weight of sand.
100
2.3 Production 101
Component materials were added into the mixer in the following sequence: dry materials
102
(including additives, if any), water with dissolved admixture to produce the base mix (mortar)
103
and then foam to produce the foamed concrete. The foamed concrete mix was placed in cube
104
moulds in two approximately equal layers. The sides of the moulds were lightly tapped after
105
placing each layer until the surface of the layer had subsided approximately to level [10].
106
After levelling the specimens’ surfaces, all specimens were covered with thick nylon to
107
prevent evaporation and then removed from moulds within 24 hours. Because sealed-curing
108
reflects typical industry practice for foamed concrete [11], all specimens were sealed-cured
109
(wrapped in cling film) and stored at about 20˚C until testing.
110
111
3. Experimental details 112
3.1 Strength test 113
For both foamed concrete and unfoamed (mortar) mixes, compressive strength testing was
114
carried out on 100 mm cubes in accordance with BS EN 12390-3:2002 [12] and in each case
115
the results quoted are the average of three specimens.
116
3.2 Entrained air-void structure investigation 117
For the void size investigation, three slices (50 × 50 × 15mm) were cut, perpendicular to the
118
cast face, from the centres of three cured foamed concrete specimens. To enhance the contrast
119
between the air voids and the matrix, the specimens were first polished and cleaned to
120
remove any residues and then treated by applying two coats of permanent marker ink to them.
121
Finally, after drying, a white powder (Sodium bicarbonate) with a minimum particle size of 5
122
μm was pressed into the surfaces of the specimens and forced into the voids leaving the
123
concrete surface with excellent properties for image analysis, namely a black surface and
124
white voids. This technique is described in details in BS EN 480-11 [13] and by Nambiar and
125
Ramamurthy [3].
126
A camera connected to an optical microscope and a computer was used to capture the images
127
of the foamed concrete mixes. From SEM images of both unfoamed and foamed concrete
128
mixes, it was shown that the smallest entrained air void diameter identified was about 20 μm
129
[14], also see Figure (1). Therefore, a microscope magnification of (23×) was chosen in order
130
that air voids with diameters in excess of 20 μm could be easily identified. With this
131
magnification, a pixel represents 6 μm and the image area is 178.52 mm2 (15.43mm ×
5
11.57mm). Ten images were captured for each mix and then digitized, converted into binary
133
form and analysed using the ImageJ software. For this study, only two phases, air voids and
134
solid, were of interest, Figure (2).
135
To create the final binary image required for analysis, the threshold value, below which all
136
pixels were considered voids and above which they were considered as solid, was selected
137
from a histogram of grey levels. Although the grey-scale histograms did not have a sharp
138
boundary between the two phases (voids and matrix), there was always a minimum in the
139
boundary region and this was set as the threshold for analysis of the images in this study.
140
Since there is a sharp contrast between the white air voids and the surrounding black matrix,
141
for this study, it was found that the simple digital operation of hole filling was sufficient,
142
although software operations such as dilation, erosion, opening, closing as well as hole filling
143
have all been suggested by others as being useful in application to concrete microscopy [3].
144
3.3 Microstructure investigation 145
For microstructure investigation, the specimens were studied through secondary electron SE
146
and backscattered electron BSE images which were captured using a Scanning Electron
147
Microscope (SEM) in the form of 2D-images. For this technique, samples of about 20×20
148
mm size with a minimum thickness of about 12 mm were cut from the cubic specimens using
149
a diamond cutter. The faces of the specimens were cut perpendicular to the cast face (parallel
150
to the casting direction) [15]. After drying for 2 days at 105˚C and to ensure the stability of
151
the air void walls during polishing, the cooled specimens were vacuum impregnated with a
152
slow setting epoxy. Then, the impregnated specimens were polished with 240#, 400#, 800#
153
and 1200# silicon carbide abrasive (58.5, 35, 21.8 and 15.3 micron, respectively) using a
154
rotating grinder and then a final stage made use of a 5 micron abrasive (4000#). In order to
155
avoid distortion of SE and BSE images due to a negative charge which may have built up on
156
the sample surface under the high energy incident electron beam, the samples, nonconductive
157
materials, were coated with a thin film of conductive material, carbon for BSE mode and gold
158
for SE mode, before investigating with the SEM.
159
160
161
162
163
164
165
6 4. Results and discussion
167
4.1 Effect of additives on air-void structure 168
For each void, an effective diameter was calculated by measuring the void area and assuming
169
it to be perfect circle [5]. Figure (3) shows the resulting pore size distributions for FC and
170
FCa foamed concrete mixes with densities of 1300, 1600 and 1900 kg/m3. From the results,
171
sizes vary between approximately 20 and 2000 μm. It is clear that at higher density (less
172
added foam), the proportion of the larger voids decreases leading to a narrower air void size
173
distribution. In addition, for a given density, the additives in combination led to increased
174
void numbers by preventing their merging, see Figure (2), and producing a narrower void
175
size distribution compared to a corresponding conventional mix. To investigate the effect of
176
additives, individually and in combination, on void structure, Figure (4) shows the void size
177
distributions of 1600 kg/m3 mixes.
178
In order to quantify and compare the air void distribution of selected mixes, the parameters
179
D50 and D90 were calculated on the basis of number of voids, see Table (2). It can be seen
180
that both D50 and D90 increased with foam volume while they decreased significantly with
181
additives in combination (FCa mixes) suggesting that the inclusion of these additives helps in
182
achieving more uniform distribution of air voids (less merging) than for the FC mixes.
183
Compared to FC6, using the additives individually slightly deceased D50, while D90 was
184
significantly decreased, again implying that additives helped in reducing the merging of voids
185
and so reduced the areas of the larger voids. This is also clear from the SEM images of the
186
1600 kg/m3 mixes shown in Figure (5). It can also be seen from Figures 2 and 5 that adding
187
a superplasticizer on its own resulted in a void structure fairly similar to that when using all
188
the additives in combination, implying that it is the superplasticizer that has the greatest
189
influence on void sizes and size distribution.
190
4.2 Effect of void structure characterisation on strength 191
Foamed concrete is a porous material; therefore its pore structure plays a dominant role in
192
controlling its properties. Figure (6) shows the effect of void size distribution parameters on
193
the 28-day compressive strength of FC and FCa mixes, while Figure (7) illustrates the effect
194
for the 1600 kg/m3 mixes. It can be seen that for all mixes, a higher foam volume (nominally
195
1300 kg/m3) resulted in a greater degree of void merging, leading to large irregular voids
196
which resulted in a wide distribution of void sizes and lower strength. In addition, a reduction
197
in D50 and D90 is clearly linked to an increase in strength for each density implying that the
198
effect of additives (both individually and in combination) was significant. However, it is
7
known that changes to the cement paste microstructure due to additives, Figures (8) and (9),
200
will also contribute to strength gain. Therefore for a given density, the questions are these;
201
does this strength improvement come from the enhancement of void structure or the paste
202
microstructure improvement due to additives and to what extent does each affect the
203
strength?
204
4.3 Effect of microstructural changes on strength 205
To answer the above questions, the compressive strengths of unfoamed mixes were
206
investigated and compared to those of foamed concrete, see Figure(10). It is evident that the
207
compressive strengths of the most dense unfoamed mixes (FC9 and FCa9) are higher than
208
unfoamed FC3 and FCa3 mixes. The reason is the higher aggregate/binder ratio (a/b) in the
209
FC9 and FCa9 which may lead to reduced damage in the interfacial transition zone (ITZ)
210
between the aggregate and cement paste by reducing shrinkage and bleeding. In addition,
211
with high a/b ratio the cement paste would be less, resulting in, on the one hand, reduced
212
thermal changes from hydration of cement and, on the other hand, a smaller voids fraction
213
and so less adverse effect on strength [16]. In addition, some water may be absorbed by a
214
larger amount of aggregate in FC9 and FCa9 leading to reduce the effective w/b ratio. Neville
215
[16] also stated that strength of a mix decreases as the proportion of aggregate increases from
216
0 to 20% but it increases for aggregate proportions from 40% to 80%. He added that the same
217
behavior was noticed at different w/c ratios but the reason for this pattern of behavior is not
218
clear.
219
Similar strength increases is seen in the foamed concrete mixes FC9 and FCa9 being stronger
220
than the comparable FC3/6 and FCa3/a6 mixes, although the rate of strength increases with
221
density appears somewhat greater for foamed version compared to unfoamed version.
222
It can be seen from Figure (10) that inclusion of additives (individually or in combination)
223
helps to improve the strength of both unfoamed and foamed mixes. This is due to the
224
additional reduction in porosity of cement paste and an improved interface between it and the
225
aggregate by:
226
A substantial reduction in the mixing water (using a superplastisizer);
227
Forming calcium silicate hydrate (C-S-H) from a pozzolanic reaction of fly ash with
228
the lime produced from the hydration of cement and water;
229
Acting as fine filler (silica fume).
230
See Figure (8). This was noticed, firstly, from the difference between the vacuum saturation
231
porosity (entrained air voids and capillary voids) and the entrained (> 20μm) void content
232
calculated from analysis of optical microscopy images. It was found that the capillary
8
porosity of FCa is less than that of FC at all investigated densities. Secondly, micro-hardness
234
values of the ITZ at 30μm distance from the aggregate surface (five readings averaged from a
235
Vickers micro-hardness test, square base pyramid indenter, with test load 10g and contact
236
time 15s) were 39.66, 59.3 and 91.13 HV for FC3, FC6 and FC9 respectively while for FCa3,
237
FCa6 and FCa9 they were 54.83, 85.56 and 111.43, respectively (1 HV=1
238
kgf/cm3=0.09806650 MPa).
239
4.4 General discussion 240
The compressive strength reduction from unfoamed and foamed concrete for each mix is
241
shown in Figure (11). It can be seen that this reduction decreases with increase in density for
242
both FC and FCa mixes. For the same density, the reduction was lower in the case of FCa
243
indicating that the void structure improvement helped in increasing the strength. This is also
244
evident from the results for individual additives (silica fume, fly ash and superplastisizer) at
245
the same density (1600 kg/m3).
246
A similar interpretation can be made from Figure (12) which illustrates the reduction for both
247
unfoamed and foamed concretes between a mix with additives (individual or in combination)
248
and a conventional mix. The difference between values of unfoamed and foamed concrete
249
reductions implies that not only the enhancement of cement paste microstructure but also
250
improvements in the void structure of foamed concrete both will contribute to strength gain.
251
In addition, the effect of each variable, i.e. mortar strength (changes to cement paste
252
microstructure) and void size parameters (D50 and D90), were examined from a statistical
253
point of view using the Chi Squared Test which is the sum of the squared difference between
254
observed and expected data divided by the expected data. With a degree of freedom equal to
255
8 (the number of all categories minus 1) and a probability value α=0.1 (which means that
256
there is a 10% probability that any deviation from expected results is due to change), the
257
value of χ2 equals 13.362. It was found that the greatest effect was for D90 (with a power
258
relation with compressive strength, χ2=6.535) followed by mortar strength (with a linear
259
relation with foamed concrete strength, χ2=10.101). Meanwhile, with a power relationship,
260
χ2=16.841, D
50 does not have any significant effect on the strength of the investigated foamed
261
concrete. These relationships are shown in Figure (13) which demonstrates that D90
262
correlates better than D50 with strength of foamed concrete implying that it is the larger pores
263
that influence the strength. Similar behavior was noticed by Nambiar and Ramamurthy [3].
264
265
266
9
5. Conclusions 268
Based on the results and discussion, the following conclusions are made:
269
For all mixes, higher foam volume (1300 kg/m3) resulted in a greater degree of void
270
merging, leading to large irregular voids which resulted in a wide distribution of void
271
sizes (increased D50 and D90) and lower strength.
272
For a given density, although the additives in combination led to increased void numbers,
273
higher strength was achieved due to reduced void size and connectivity, by preventing
274
their merging and producing a narrow void size distribution (decreased D50 and D90).
275
Adding a superplasticizer on its own resulted in a void structure fairly similar to that
276
from all additives in combination, implying that it is the superplasticizer that has the
277
greatest influence on voids.
278
A reduction in the D50 and D90 of air voids is clearly linked to an increase in strength for
279
each density implying that the effect of additives (both individually and in combination)
280
was significant.
281
Proportional strength increase with density is greater for the foamed concrete mixes than
282
for comparable unfoamed concrete, apparently because a difference in their failure
283
mechanisms due to a presence of foam in the foamed concrete.
284
Not only enhancement of void structure but also improvement to cement paste
285
microstructure of foamed concrete both contribute to strength gain.
286
287
Acknowledgements 288
The authors would like to acknowledge the support of the Higher Committee for Education
289
Development in Iraq (HCED) for the research scholarship enabling this work to be conducted
290
as part of a larger research project. The authors also wish to thank Dr Daniel Wells (E-A-B
291
Associates Company, UK) for providing the foaming agent. Finally, the valuable help and
292
comments of Mr Thomas Buss (University of Nottingham) during the microscopy
293
observation and Mr Martin Roe (University of Nottingham) during the SEM testing are
294
gratefully acknowledged.
295
296 297
298
299
10
Table 1. Mix proportions of the all selected foamed concrete mixes. 302
Mixes
FC3 FCa3 FC6 FCs6 FCf6 FCp6 FCa6 FC9 FCa9 Target density (kg/m3)
1300 1300 1600 1600 1600 1600 1600 1900 1900
Cement content (kg/m3) 500 450 500 450 500 500 450 500 450
Silica Fume (kg/m3) - 50 - 50 - - 50 - 50
W/b ratio* 0.475 0.3 0.5 0.5 0.5 0.325 0.325 0.525 0.35
Superplasticizer (kg/m3) - 7.5 - - - 7.5 7.5 - 7.5
Water content (kg/m3) 237.5 150 250 250 250 162.5 162.5 262.5 175
Sand content (kg/m3) 562 514 850 850 680 930 744 1137.5 974
Fly Ash (kg/m3) - 128.5 - - 170 - 186 - 243.5
Foam (kg/m3) 19.4 19.4 13.3 13.3 13.3 13.3 13.3 7.6 7.6
Foaming agent (kg/m3) 0.35 0.35 0.24 0.24 0.24 0.24 0.24 0.13 0.13
Foam (m3) 0.424 0.424 0.295 0.295 0.295 0.295 0.295 0.166 0.166
*w/b ratios required to achieve a density ratio of about unity for the selected mixes 303
304 305
306
307
308
309
310
[image:10.612.120.481.310.440.2]311 312 313
Fig. 1. SEM images for 1600 kg/m3, (left) mix without foam, (right) foamed concrete mix
314 315
316
317
318
319
320
321
322
323
324
325
326
327
328
Fig. 2. Typical binary images [15.43mm × 11.57mm] for the selected mixes 329
FCa6 FC6
FCa3 FC3
FCp6 FCf6
FCs6
[image:10.612.69.526.464.702.2]11 330
[image:11.612.124.491.65.335.2]331
Fig. 3. Cumulative frequency (%) of pore diameters of FC and FCa foamed concrete mixes 332
333
Fig. 4. Cumulative frequency (%) of pore diameters of 1600 kg/m3 mixes
334 335
336
0 10 20 30 40 50 60 70 80 90 100 110
0 500 1000 1500 2000 2500
C
u
mula
ti
ve
f
re
quenc
y
(%
)
Pore diameter (μm)
FC3
FC6
FC9
FCa3
FCa6
Fca9
0 10 20 30 40 50 60 70 80 90 100 110
0 500 1000 1500 2000
C
u
mula
ti
ve
f
re
quenc
y
(%
)
Pore diameter (μm)
FC6
FCs6
FCf6
FCp6
[image:11.612.119.488.366.666.2]12
Table 2. Parameters of pores sizes and circularity of selected foamed concrete mixes 337
338
FC3 FCa3 FC6 FCs6 FCf6 FCp6 FCa6 FC9 FCa9
D50 (μm) 180 125 175 160 165 165 120 165 95
D90 (μm) 750 465 650 565 510 500 385 525 315
339
340
[image:12.612.59.510.103.500.2]
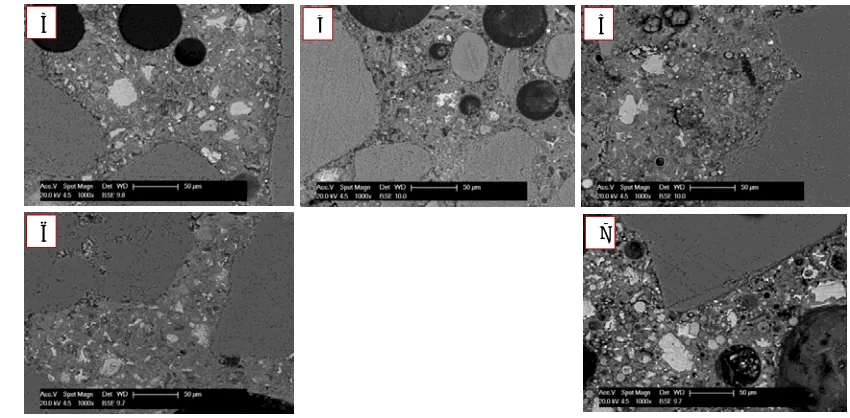
341 342
Fig. 5. SEM images for the selected 1600 kg/m3 mixes (a) FC6 (b) FCs6 (c) FCf6 (d) FCp6 and (e)
343
FCa6 344
[image:12.612.160.452.477.670.2]345
Fig. 6. Compressive strength versus void size parameters 346
0 5 10 15 20 25 30 35 40 45 50
0 100 200 300 400 500 600 700 800
Com
p
res
si
ve
st
ren
gt
h
(
MP
a)
Pore diameter (μm)
D50
D90
FC3 FC6 FC9 FCa3 FCa6 FCa9
a b c
13 347
Fig. 7. Compressive strength versus void size parameters of 1600 kg/m3 mixes
348
349
350
351
352
353
354
355
356
357
358
359
Fig. 8. Effect of additives on the cement paste microstructure, left) FC6 mix, right) FCa6 mix 360
361 362 363 364 365
366
367
368
369
370
371
372
373
Fig. 9. Effect of additives on the cement paste microstructure a) FC6 b) FCs6 c) FCf6 d) FCp6 374
and e) FCa6 375
0 5 10 15 20 25 30 35 40
0 100 200 300 400 500 600 700 800
Co
mpressi
ve
st
rengt
h
(
MPa
)
Pore diameter (μm)
D50
D90
FC6 FCs6 FCf6 FCp6 FCa6
a b c
[image:13.612.122.500.293.436.2] [image:13.612.96.521.475.684.2]14 376
[image:14.612.137.476.86.294.2]377
Fig. 10. 28-day Compressive strength of unfoamed and foamed concrete mixes 378
379
Fig. 11. Compressive strength reduction (%) of unfoamed to foamed concrete for the same mixes 380
381
0 10 20 30 40 50 60 70 80 90 100
FC3 FC6 FC9 FCa3 FCa6 FCa9 FCs6 FCf6 FCp6
C
o
mpr
e
ssive
str
e
ng
th
(MP
a)
Mixes
Unfoamed Foamed
0 10 20 30 40 50 60 70 80 90 100
FC3 FC6 FC9 FCa3 FCa6 FCa9 FCs6 FCf6 FCp6
Compressive
strength
reduction
(un
foa
med
to
f
oa
med)
(%
)
[image:14.612.147.465.337.554.2]15 382
Fig. 12. Compressive strength reduction (%) of unfoamed and foamed concrete mixes (from with 383
additives to conventional) 384
385
386
Fig. 13. (a) Mortar strength and (b) pore size parameters versus foamed concrete strength for all 387
investigated mixes 388
0 10 20 30 40 50 60 70
3a→3 6a→6 9a→9 6s→6 6f→6 6p→6
C
o
mpr
e
ssiv
e
str
e
ng
th
r
edu
cti
on
(%)
Mixes
Unfoamed Foamed
y = 0.8682x ‐ 34.854 R² = 0.778
0 10 20 30 40 50
30 50 70 90
C
o
ncr
e
te
compr
essiv
e
s
tr
eng
th
(MPa)
Mortar compressive strength (MPa)
a
y = 311562x‐1.932
R² = 0.5352
y = 7E+06x‐2.038
R² = 0.8527
0 10 20 30 40 50 60
0 100 200 300 400 500 600 700 800
Con
crete F
cu
(MPa)
Pore diameter (μm) D50
D90
[image:15.612.156.459.299.683.2]16 References
389 390
1. Narayanan, N. and K. Ramamurthy, Structure and properties of aerated concrete: a review. Cement 391
and Concrete Composites, 2000. 22(5): p. 321-329. 392
2. Ramamurthy, K., E.K. Kunhanandan Nambiar, and G. Indu Siva Ranjani, A classification of studies on 393
properties of foam concrete. Cement and Concrete Composites, 2009. 31(6): p. 388-396. 394
3. Nambiar, E. and K. Ramamurthy, Air‐void characterisation of foam concrete. Cement and concrete 395
research, 2007. 37(2): p. 221-230. 396
4. Just, A. and B. Middendorf, Microstructure of high-strength foam concrete. Materials Characterization, 397
2009. 60(7): p. 741-748. 398
5. Kearsley, E., The Effect of High Volume of Ungraded Fly Ash on the Properties of Foamed Concrete, in 399
School of Civil Engineering 1999, The University of Leeds: Leeds. 400
6. Hilal, A.A., N.H. Thom, and A.R. Dawson, The Use of Additives to Enhance Properties of Pre- formed 401
Foamed Concrete. International Journal of Engineering and Technology, 2015. 7(4): p. 286-293. 402
7. BS EN 197-1, Cement-Part 1: Composition, Specifications and Conformity Criteria for Common 403
Cements, in British Standards Institution, London. 2011. 404
8. BS 882, Specification for aggregates from natural sources for concrete. British Standards Institution, 405
London, 1992. 406
9. BS EN 405-1, Fly ash for concrete- Part 1: Defination, specifications and conformity criteria. 2005. 407
10. ASTM C796, Standard test method for foaming agent for use in producing cellular concrete using 408
preformed foam. 1997, American Society for Testing and Materials. 409
11. Jones, M. and A. McCarthy, Preliminary views on the potential of foamed concrete as a structural 410
material. Magazine of concrete research, 2005. 57(1): p. 21-31. 411
12. BS EN 12390-3, Testing hardened concrete—Compressive strength of test specimens. British European 412
Standards Specifications, 2002. 413
13. BS EN 480-11, Admixtures for concrete, mortar and grout- Test methods- Part 11: Determination of air 414
void characteristics in hardened concrete. 2005: British Standards Institution, London. 415
14. Hilal, A.A., N.H. Thom, and A.R. Dawson, On entrained pore size distribution of foamed concrete. 416
Construction and Building Materials, 2014.[In Press]. 417
15. ASTM C457, Standard test method for Microscopical Determination of Parameters of the Air-Void 418
System in Hardened Concrete. 1998, American Society for Testing and Materials 419
16. Neville, A.M., Properties of concrete. 5th ed. 2011, London Pearson Education Limited. 846. 420
421 422
423
424
425
426
427
428
429
430
431
432
433
434
435
17 Figures Captions
437
Fig. 1. SEM images for 1600 kg/m3, left) mix without foam, right) foamed concrete mix 438
Fig. 2. Typical binary images [15.43mm × 11.57mm] for the selected mixes
439
Fig. 3. Cumulative frequency (%) of pore diameters of FC and FCa foamed concrete mixes
440
Fig. 4 Cumulative frequency (%) of pore diameters of 1600 kg/m3 mixes 441
Fig. 5. SEM images for the selected 1600 kg/m3 mixes (a) FC6 (b) FCs6 (c) FCf6 (d) FCp6 442
and (e) FCa6
443
Fig. 6. Compressive strength versus void size distribution parameters
444
Fig. 7. Compressive strength versus void size distribution parameters of 1600 kg/m3 mixes 445
Fig. 8. Effect of additives on the cement paste microstructure (left) Mortar of FC6 mix (right)
446
Mortar of FCa6 mix
447
Fig. 9. Effect of additives on the cement paste microstructure (a) FC6 (b) FCs6 (c) FCf6 (d)
448
FCp6 and (e) FCa6
449
Fig. 10. 28-day Compressive strength of unfoamed and foamed concrete mixes
450
Fig. 11. Compressive strength reduction (%) of unfoamed to foamed concrete for the same
451
mixes
452
Fig. 12. Compressive strength reduction (%) of unfoamed and foamed concrete mixes (from
453
with additives to conventional)
454
Fig. 13. (a) Mortar strength and (b) pore size parameters versus foamed concrete strength for
455
all investigated mixes
456
457