ISSN Online: 2153-1188 ISSN Print: 2153-117X
DOI: 10.4236/msa.2018.93021 Mar. 15, 2018 315 Materials Sciences and Applications
Experimental Study on Improved Engineered
Cementitious Composite Using Local Material
Fariborz Nateghi-A
1*, Mohammad Hossein Ahmadi
1, Ayoub Dehghani
21International Institute of Earthquake Engineering and Seismology, Tehran, Iran 2Persian Gulf University, Boushehr, Iran
Abstract
Engineered Cementitious Composite (ECC) is a cement based material with ultra-high ductility and strength in tension. This material is a kind of high-performance fiber-reinforced cementitious composite materials (HPFRCCs) reinforced with short fibers and characterized by tight multiple cracking. These characteristics of ECC make it applicable to increase the capacity and the ductility of structural elements so that structural design is economic and sustainable. This paper presents an extended evaluation of Improved Engi-neered Cementitious Composites (IECC) for the use in the strengthening of masonry in filled reinforced concrete frames. IECC is a mixture of cement, fly ash, water, sand, quartz powder and poly-vinyl alcohol fibers with a better quality of tensile strain rather than common ECC. Two types of fine sand and quartz powder used in this study as filler to improve ECC behavior. Also, to show the effect of fly ash on IECC properties, five different mixtures were considered with various fly ash ratios. Different mixtures of IECC using fine aggregates produced in Iran were selected to find out how the aggregates and fly ash would affect IECC performance. The results show that the optimized mixture has the best characteristics including tensile strength and strain. Also, three-dimensional diagrams were used to compare the properties of different mixtures of IECC more effectively and to represent the influence of the range of fly ash ratios so that it can be opted based on design objectives such as ECC properties, costs and structural parameters and demands. These diagrams show the behavior of IECC which its fly ash content ratio in the binder is 50% to 67%.
Keywords
Improved Engineered Cementitious Composites, Optimization, Experimental Study, Local Material
How to cite this paper: Nateghi-A, F., Ahmadi, M.H. and Dehghani, A. (2018) Experimental Study on Improved Engi-neered Cementitious Composite Using Local Material. Materials Sciences and Applica-tions, 9, 315-329.
https://doi.org/10.4236/msa.2018.93021
Received: December 14, 2017 Accepted: March 12, 2018 Published: March 15, 2018
Copyright © 2018 by authors and Scientific Research Publishing Inc. This work is licensed under the Creative Commons Attribution International License (CC BY 4.0).
DOI: 10.4236/msa.2018.93021 316 Materials Sciences and Applications
1. Introduction
ECC has very high ductile behavior in tensile loads and is known as a special kind of HPFRCC that invented at the University of Michigan in the early 1990s for the first time [1]. This material is known by high ductility more than 3% and multiple cracks with about 60 μm wide. A typical tensile stress-strain curve of
ECC and multiple cracks is shown in Figure 1 [2]. Plain concrete and fiber
reinforced concrete have strain-softening after initial cracks. However, ECC ex-hibits material property like steel with tensile strain-hardening behavior. High ductile behavior is due to the interactions among fiber, matrix and fiber-matrix interface [3]. Also, ECC shows good durability and high tensile strength due to self-controlled cracks.
Thus, ECC can be used in many structures to extend service life, reduce the maintenance and repair cost. Recently, ECC is highly used in decks [4], structur-al elements in high-rise buildings to improve their seismic behavior, and in re-pair application [5] [6].
In normal concrete, aggregates play a key role in mechanical properties of hardened concrete. However, they cause poor fiber dispersion in fiber reinforced concrete [7]. Since fiber dispersion is an effective parameter in strain-hardening behavior of ECC, using fine and appropriate aggregates increase the ductility of ECC. Therefore, the size and the amount of aggregates are limited in this ma-terial [8].
The high quantity of cement in ECC makes easy control in fiber dispersion and better strain-hardening behavior. To obtain strain hardening in this materi-al, matrix fracture toughness has to be limited so that multiple cracking could occur before reaching the maximum fiber bridging stress [9].
[image:2.595.209.538.496.707.2]Based on previous studies, ECC has better performance than traditional ce-ment concrete mixes. However, nearly all of the past works were performed on
DOI: 10.4236/msa.2018.93021 317 Materials Sciences and Applications ECC material consist of very fine sand which is not supplied by the common size of aggregates. This kind of sand includes more than 90% passing the No. 100 sieve size [10] [11]. Due to the lack of coarse aggregates in this gradation, the costs due to using the fine sand and quartz powder would increase the price of the ECC material. However, finding a good gradation of aggregates can eco-nomize the mixture.
Although, there are few studies on the influence of Fly Ash (FA) on characte-ristics of ECC such as the bonding interface between fiber and matrix, the tensile properties and strength, there are some special studies carried out and focused on testing different FA contents and evaluating these properties. Tensile test of PVA-ECC with the FA/C (fly ash and cement ratio) between 0 to 1.5, the results showed that ECC strain capacity increased with the increase of FA/C [12] [13]. Also, by increasing FA content to 40%, the ultimate tensile strain reached a maximum value (1.7%) [14]. Some different FA contents (50%, 60%, 70% and 80%) are considered in ECC mixture to show that initial cracking and
compres-sive strength are decreased by increasing this ratio [15]. In some previous
stu-dies, it shows that this content is not stable and needs to be optimized in various contents (50%, 55%, 60%, 65%, 70% and 75%). The best tensile behavior is 75% whereas 50% and 65% are the lowest tensile strain [16].
In this study by the use of fine and medium aggregates in ECC, two types of aggregate size gradation are evaluated. The results showed that ECC made with fine aggregates exhibit the better and desired tensile properties or ductile beha-vior. Two kinds of fine sand and quartz powder were used to show the effect of aggregate size on fiber dispersion and uniaxial tensile behavior of ECC. To show the effect of cement content on the behavior of ECC, five mixtures with different ratios of the matrix which have a different volume of fly ash, were produced.
This paper presents multiple evaluations of the improved engineered cementi-tious composite using locally sourced materials for use of retrofit in masonry in-filled reinforced concrete frames. IECC is a mixture of cement, fly ash, water, sand, quartz powder and poly-vinyl alcohol fibers with the high quality of tensile strain. In standard mix design of ECC, fly ash is commonly used. Since fly ash is expensive and not produced in Iran, using another material which contains pozzolanic properties is proposed. For this reason, five mixtures were considered for different ratio of fly ash in ECC to show the effect of this material on tensile behavior and optimize this content ratio. The purpose of evaluating IECC was to determine if IECC would be suitable for use as a masonry infill overlay. In total, 6 different laboratory mixes were evaluated using 36 uniaxial tensile tests. The results show that one mixture has the best behavior in tension.
2. Experimental Program
2.1. Material Information
DOI: 10.4236/msa.2018.93021 318 Materials Sciences and Applications best ECC and know as IECC. Also, to show the effect of sands on tensile strength and strain of ECC, two kinds of sands were used for standard material. Mix proportions were selected based on the findings from previous research on ECC [5] [6].
2.1.1. Material Properties
The ECC material used in this study utilized cement, fly ash, fine sand, quartz powder, water, and superplasticizer to improve the fresh properties of the mix-ture and PVA fibers. All types of materials are common except fine sand and quartz powder. Table 1 shows the geometrical and mechanical properties of PVA fiber.
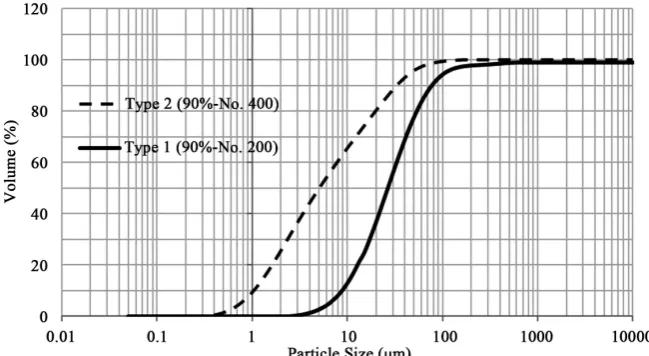
One of the most important factors of producing of each material is an ex-penditure. The fine sand and quartz powder used in this study as filler were in-stead of the typically used sand to improve ECC behavior. Two different sands
and quartz powder sources were selected in Iran. Figure 2 and Figure 3
illu-strate the gradations of the two aggregates evaluated along with the sand and quartz powder that is typically used in ECC. One kind of sand includes more than 90% passing the No. 50 (300 µm) and another one contains more than 90% passing the No. 70 (212 µm) sieve size. Also, for quartz powder, one of them has more than 90% passing the No. 200 (75 µm) and another one contains more than 90% passing the No. 400 (38 µm) sieve size.
2.1.2. Mix Properties
[image:4.595.207.540.478.704.2]As mentioned, The ECC material used in this particular study utilized cement, fly ash, fine sand, quartz powder, water, and Hydroxy Propyl Methyl Cellulose (HPMC) as superplasticizer to enhance the fresh properties of the mixture and
Table 1. Properties of PVA fiber.
Diameter
(µm) Length (mm) Tensile strength (MPa) Young’s modulus (GPa) Elongation (%) Density (g/cm3)
39 8 1600 42.8 6 1.3
DOI: 10.4236/msa.2018.93021 319 Materials Sciences and Applications 2% of PVA fibers in volume. The weight proportions of the ECC matrix ingre-dients are given in Table 2.
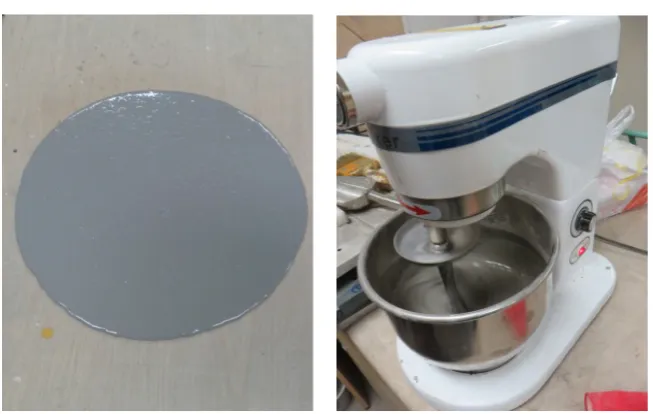
In practice, dry ingredients consist of cement, fly ash, sand, quartz powder and superplasticizer were first mixed using a type of laboratory mixer for about 1 min. Then water was added and mixed about 4 min. At this time, obtained mor-tar showed adequate flowability and viscosity visually investigated and needed for the good workability and uniform fiber distribution. Finally, PVA fibers were added gradually and mixed for 3 min.
2.2. Testing Plan
To determine the applicability of using IECC as a masonry infill overlay, the material was subjected to performance tests to determine tensile strength and strain.
[image:5.595.209.534.448.626.2]To confirm the tensile strain-hardening behavior of this ECC and compare with the common ECC, the dog-bone specimens with 500 mm long, 90 mm wide and 50 mm thick shown in the next section, at the age of 7 days were used in the uniaxial tensile test. The strain of the dog-bone specimen was obtained by taking the average reading of extensometer, attached to the specimen. Mixing process and slump test of the specimens is shown in Figure 4. The average slump of the specimens is about 35 cm. This value shows that it is suitable to use as an overlay on masonry walls in strengthening [6].
Figure 5 shows the test set-up and specimen before and after testing. After casting dog-bone specimens in a suitable mould and curing for 7 days, the spe-cimen was fixed on the test set-up by clamping the plate-glued ends with two
[image:5.595.204.540.682.727.2]Figure 3. Gradation of quartz powder.
Table 2. Weight proportions of the ECC matrix.
Cement Fly ash Fine sand Quartz powder Water Superplastisizer
DOI: 10.4236/msa.2018.93021 320 Materials Sciences and Applications
Figure 4. Fresh cone and mixer.
[image:6.595.207.539.76.473.2]Figure 5. Test set-up and specimen before and after testing.
pairs of steel plates, which were connected to the loading device. Then, an ex-tensometer was attached on both sides of the specimen to measure the specimen deformation and consider eccentricities. The tests were conducted under dis-placement control with a loading rate of 0.015 mm/s [6].
3. Results and Discussion
3.1. Tensile Behaviour
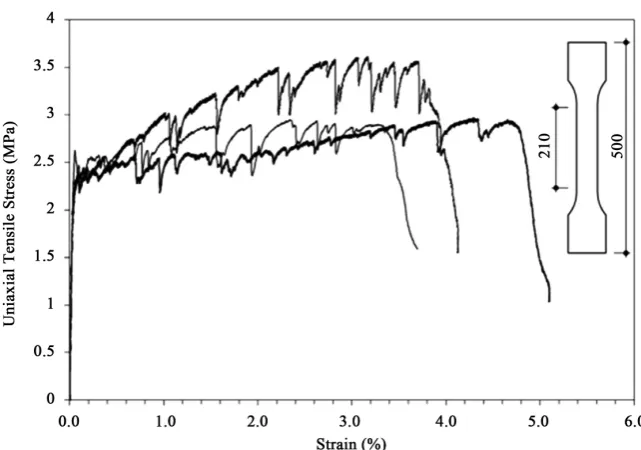
[image:6.595.209.539.294.518.2]DOI: 10.4236/msa.2018.93021 321 Materials Sciences and Applications Figure 6. Tensile stress-strain curves (Type 1 material).
Figure 7. Tensile stress-strain curves (Type 2 material).
Table 3. Results obtained from direct tensile tests of ECC.
ECC type Tensile yield strength (MPa) Tensile strength (MPa) Ultimate tensile strain
Type 1 2.4 ± 0.1 3.16 ± 0.25 3.92 ± 0.6
Type 2 2.3 ± 0.15 2.84 ± 0.63 4.15 ± 0.64
strength, ultimate strength and ultimate strain. The definition of tensile yield strength is shown in Figure 8.
DOI: 10.4236/msa.2018.93021 322 Materials Sciences and Applications Figure 8. Definition of tensile yield strength.
Table 4. Mixture of ECC.
Mix name Cement ratio Fly ash ratio
F0.5 1 0.5
F1 1 1
F1.5 1 1.5
F2 1 2
F2.5 1 2.5
the binder was fix and the total amount of cement and fly ash is not variable whereas their ratio is changing. Figures 9-12 show the tensile stress-strain curves.
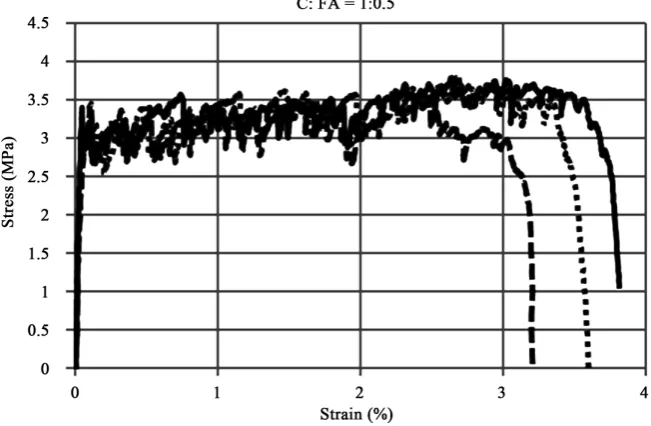
The tensile properties of the ECC were evaluated at 14 days after mixing. The reported tensile strengths are the maximum value for testing. The reported ten-sile strains are the values where the tenten-sile load experiences a large drop just be-fore the sample breaks into two. Since the behavior of ECC with type 2 is better than type 1, the best mixture is tested using type 2 material. As seen, the best behavior of ECC tested with different fly ash ratios with type 2 material is F1.5 Mixture (with 1:1.5 cement to fly ash ratio). This mixture can be known as IECC due to high tensile strength and strain which are 3.5 MPa and 6% respectively. To compare standard ECC and IECC which have an average tensile strength of 3.16 MPa and 3.92 MPa and tensile strain 3.92% and 6% respectively.
[image:8.595.208.540.389.483.2]DOI: 10.4236/msa.2018.93021 323 Materials Sciences and Applications Figure 9. Tensile stress-strain curves (C:FA = 1:1.5).
Figure 10. Tensile stress-strain curves (C:FA = 1:2.5).
[image:9.595.210.537.516.701.2]DOI: 10.4236/msa.2018.93021 324 Materials Sciences and Applications Figure 12. Tensile stress-strain curves (C:FA = 1:0.5).
Table 5. Results obtained from direct tensile tests of ECC.
ECC mixture Tensile yield strength (MPa) Tensile strength (MPa) Ultimate tensile strain (%)
Standard type 1 (S1) 2.4 ± 0.1 3.16 ± 0.25 3.92 ± 0.6
Standard type 2 (S2) 2.3 ± 0.15 2.84 ± 0.63 4.15 ± 0.64
F0.5 3.25 ± 0.1 3.65 ± 0.1 3.35 ± 0.4
F1 2.95 ± 0.05 3.6 ± 0.08 3.7 ± 0.3
F1.5 2.65 ± 0.1 3.4 ± 0.14 6.1 ± 0.13
F2.5 1.9 ± 0.12 2.2 ± 0.13 2.7 ± 0.62
Figure 13. Tensile yield strength of ECC mixtures.
F2.5 F1.5
F1 F0.5
S2 S1
3.5
3.0
2.5
2.0
1.5
1.0
0.5
0.0
ECC Mixture
T
e
n
si
le
Y
ie
ld
S
tr
e
n
g
th
(
M
P
a
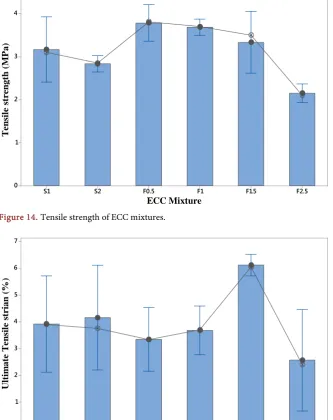
DOI: 10.4236/msa.2018.93021 325 Materials Sciences and Applications Figure 14. Tensile strength of ECC mixtures.
Figure 15. Ultimate tensile strain of ECC mixtures.
mean and median values of results in bar charts and connect line respectively. Also, the interval of each mixture can be seen to consider standard deviation calculated in Table 5.
3.2. Statistical Analysis
As it can be seen, the best mixture in tensile yield strength and tensile strength is F0.5 which has C:FA ratio of 1:0.5. The mean values of these strengths for this mix are 3.15 MPa and 3.7 MPa respectively with 0.1 standard deviation. The lowest mean values of strengths (1.9 MPa and 2.2 MPa) belong to F2.5 with C:FA = 1:2.5 ratio.
[image:11.595.208.542.78.499.2] [image:11.595.208.539.299.525.2]DOI: 10.4236/msa.2018.93021 326 Materials Sciences and Applications most important factor of the ductile behavior of ECC is having multiple cracks and higher ultimate tensile strain represented in the uniaxial tensile stress-strain curve. To obtain the high-ductile behavior of ECC, this parameter must be greater than ordinary HPFRCC. To achieve the high ductile behavior and mul-tiple cracks in ECC ultimate tensile strain was compared to 6 mixtures based on Figure 15. F1.5 Mixture has the best tensile behavior among all mixes with a mean value of tensile strain 6.1%. However, its tensile strength is moderate.
Also, it should be noticed that variation of results and standard deviation in strength parameters is less than strain. Based on Table 4, it is obvious that stan-dard deviation of strengths is about 0.1. However, this statistics parameter for strain is higher than 0.1 and averagely about 0.4.
By comparing the mean and median value of figures, it can be found that there is no significant difference between them. Although mean is not a robust statistic tool since it cannot be applied to all distributions, it is easily the most widely used statistic tool to derive the central tendency. The reason for this mat-ter is due to getting unduly impacted by values in the sample that is too small to too large. On the other hand, it is difficult to use median in theoretical studies and generally, there is no easy mathematical formula to calculate the median. Therefore, in this case these two statistical parameters are compared to show the central tendency of their distribution. As seen, mean and median values are nearly the same in all figures. So, it means that in this case the mean is a good representative of the central tendency of the samples.
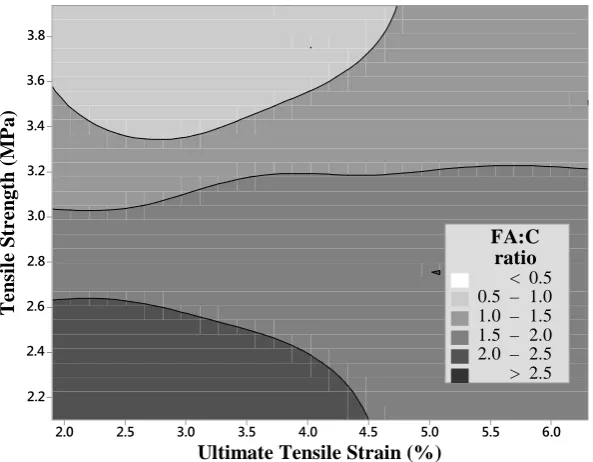
[image:12.595.226.523.473.704.2]To show the effect of the other C:FA ratios in tensile strength and strain of ECC, a contour plot between tensile strength and ultimate tensile strain is shown for different mixtures in Figure 16. This contour shows characteristics of a wide range of mixtures by interpolation of experimental study. The interpolation is
Figure 16. Contour plot of characteristics of ECC mixtures. Ultimate Tensile Strain (%)
DOI: 10.4236/msa.2018.93021 327 Materials Sciences and Applications done using the distance-based method to predict the strength and strain of ECC. This method is simple and famous which is mostly used for the interpolation. It is based on the gradual change of trend surface in proximity concept [18] [19] [20]. It is calculated as:
( )
( )
* 1 n i i iZ u =
∑
= λZ u (1)where u is the estimation location, ui, i = 1, 2, ···, n, are the locations of the
sam-ple points within the search neighborhood, Z*(u) is the inverse distance estimate
at the estimation location, n is the number of sample points, λi, i = 1, 2, ···, n, are
the weights assigned to each sample point, and Z(ui), i = 1, 2, ···, n, are the
condi-tioning data at sample points. The weights are determined as:
(
)
1
1
, 1, 2, ,
1 p i i n p i i d i n d λ = = =
∑
(2)where di are the Euclidian distances between estimation location and sample
points, and exponent p is the power or distance exponent value. It should be
mentioned that the sum of the inverse distance weights is equal to 1 as follows:
1 1
n i i= λ =
∑
(3)The most common value applied for the power p is 2. However, any value for
p can be chosen. If p increases, the interpolated value by inverse distance will be
assigned the value of the nearest sample point and become the same as estimate produced by polygonal method [19].
As known, the distance method works well in a wide range of circumstances. It is a conservative method because it always provides estimates of the third fac-tor within the range of the data. In this approach, distance power is 2 and mesh number of interpolating surface is 30 × 30 in each direction to obtain a higher quality of results.
As seen in Figure 14, four major ranges of FA:C ratio are shown to determine tensile strength and ultimate tensile strain. Based on this figure, in FA:C ratio between 0.5 - 1.0, ECC material has higher tensile strength whereas the value of ultimate tensile strain is less than 4.5%. In the second range (1.0 - 1.5) that might be the best range of FA:C ratio, tensile strength is more than 3 MPa and tensile strains mostly more than 4.5%. In third one, it might be expected that tensile strength is less than 3.0 MPa. However, the widest range of high value for the ul-timate tensile strain. Also, in FA:C ratio more than 2.0, it is expected the lowest ductile behavior of ECC. The optimum range of ultimate tensile strain is be-tween 4.5% and 6.5% and tensile strength is bebe-tween 3.1 MPa and 3.8 MPa for FA:C ratio 1 - 1.5.
4. Conclusions
DOI: 10.4236/msa.2018.93021 328 Materials Sciences and Applications locally sourced materials. Two different fine sand and quartz powders and five different mix proportions of fly ash were used to develop IECC mix. The per-formance of IECC was compared to that of a typical ECC mix used for masonry infill overlays in RC frames. The objective was to determine if IECC could re-place the ECC as the material for these overlays.
Based on the findings from this study, the following observations can be made:
• Using fine materials show lower strength and higher strain that must be
con-sidered in all designs.
• In fine aggregates, yield strength and tensile strength were decreased 5% and
10% respectively. However, the ultimate strain was increased 5%.
• The best ratio of fly ash in the binder is 1 to 1.5 for the cement to fly ash ratio
which has 3.5 MPa tensile strength and 6% tensile strain so that IECC can be known with 60% in the binder.
• The Central tendency of the samples was observed in all ECC mixtures.
• It is concluded that in FA/C ratio between 1 - 2, ECC has high ductility.
However, tensile strength can be higher than 3 MPa in the ratio between 1 - 1.5 and lower than 3 MPa in the ratio between 1.5 - 2. Thus, IECC will be obtained if fly ash content is between 50% to 67% of the binder.
Acknowledgements
The authors are grateful to International Institute of Earthquake Engineering and Technology (IIEES) for the supports in this research especially in experi-mental studies.
References
[1] Li, V.C. (1993) From Micromechanics to Structural Engineering the Design of Ce-mentitious Composites for Civil Engineering Applications. Proceedings of the Japan
Society of Civil Engineers, No. 471, 1-12.
[2] Weimann, M.B. and Li, V.C. (2003) Hygral Behavior of Engineered Cementitious Composite (ECC). International Journal for Restoration of Buildings and
Monu-ments, 9, 513-534. https://doi.org/10.1515/rbm-2003-5791
[3] Li, V.C. and Leung, C.K.Y. (1992) Theory of Steady State and Multiple Cracking of Random Discontinuous Fiber Reinforced Brittle Matrix Composites. Journal of
En-gineering Mechanics, 118, 2246-2264.
https://doi.org/10.1061/(ASCE)0733-9399(1992)118:11(2246)
[4] Lepech, M.D. and Li, V.C. (2009) Application of ECC for Bridge Deck Link Slabs.
Materials and Structures, 42, 1185. https://doi.org/10.1617/s11527-009-9544-5
[5] Dehghani, A., Fischer, G. and Nateghi Alahi, F. (2015) Strengthening Masonry Infill Panels Using Engineered Cementitious Composites. Materials and Structures, 48, 185-204. https://doi.org/10.1617/s11527-013-0176-4
[6] Dehghani, A., Fischer, G. and Nateghi Alahi, F. (2015) Structural Behavior of Small Scale Masonry Elements Strengthened with Engineered Cementitious Composites.
15 WCEE Conference, Lisbon, 28800-28810.
Com-DOI: 10.4236/msa.2018.93021 329 Materials Sciences and Applications posite Material. In: di Prisco, M., et al., Eds., Fibre-Reinforced Concretes, Proc. 6th
RILEM Symposium on FRC (BEFIB 2004), Varenna, Italy, 1301-1310.
[8] Torigoe, S., Horikoshi, T., Ogawa, A., Saito, T. and Hamada, T. (2003) Study on Evaluation Method for PVA Fiber Distributionin Engineered Cementitious Com-posite. Journal of Advanced Concrete Technology, 1, 265-268.
[9] Battelle (2002) Toward a Sustainable Cement Industry. World Business Council on
Sustainable Development (WBCSD), 92 p.
[10] Lepech, M. and Li, V. (2008) Large-Scale Processing of Engineered Cementitious Composites. ACI Materials Journal, 105, 358-366.
[11] Fischer, G., Want, S. and Li, V.C. (2003) Design of Engineered Cementitious Com-posites (ECC) for Processing and Workability Requirements. Brittle Matrix
Com-posites, 29-36.
[12] Wang, S.X. (2005) Micromechanics Based Matrix Design for Engineered Cementi-tious Composites. University of Michigan, Michigan.
[13] Wang, S.X. and Li, V.C. (2007) Engineered Cementitious Composites with High-Volume Fly Ash. ACI Materials Journal, 104, 233-241.
[14] Gong, C.X. and Zhang, J. (2008) Tensile Performance of High Ductile Fiber Rein-forced Cementitious Composite. Journal of Hydraulic Engineering, 39, 361-366. (In Chinese)
[15] Yang, Y.Z., Zhu, Y., Gao, X.J., et al. (2009) Experimental Study on High-Ductile PVA Fiber Reinforced Cement Based Composite Materials with Fly Ash. Journal of
Qingdao Technological University, 30, 51-59. (In Chinese)
[16] Li, W., Li, N. and Zhou, X.Y. (2015) Research on the Effect of Fly Ash Content on the Tensile Properties of PVA-ECC. Asia-Pacific Energy Equipment Engineering
Research Conference (AP3ER), 13-14 June 2015, Zhuhai, 357-367.
[17] MINITAB Statistical Package Release 13 for Windows. Minitab 18.
http://www.minitab.com/en-us/
[18] Shepard, D. (1968) A Two-Dimensional Interpolation Function for Irregularly Spaced Data. Proceedings of the 1968 23rd ACM National Conference, 27-29 Au-gust 1968, New York, 517-524. https://doi.org/10.1145/800186.810616
[19] Franke, R. (1982) Scattered Data Interpolation: Tests of Some Methods. Math
Comput, 38, 181-200.
[20] Diodato, N. and Ceccarelli, M. (2005) Interpolation Processes Using Multivariate Geostatistics for Mapping of Climatological Precipitation Mean in the Sannio Mountains (Southern Italy). Earth Surface Processes and Landforms, 30, 259-268.
![Figure 1. Tensile stress-strain curve and tight crack width control of ECC [2].](https://thumb-us.123doks.com/thumbv2/123dok_us/9944403.496115/2.595.209.538.496.707/figure-tensile-stress-strain-curve-tight-crack-control.webp)