ORIGINAL RESEARCH
PEDIATRICS
Effectiveness of 3D T2-Weighted FLAIR FSE Sequences with Fat
Suppression for Detection of Brain MR Imaging Signal Changes
in Children
XM. Mascalchi,XA. Bianchi,X M. Basile,XP. Gulino,XM.R. Trifan,XD. Difeo,X E. Bartolini,XC. Defilippi, andX S. Diciotti
ABSTRACT
BACKGROUND AND PURPOSE: T2-weighted FLAIR can be combined with 3D-FSE sequences with isotropic voxels, yielding higher signal-to-noise ratio than 2D-FLAIR. Our aim was to explore whether a T2-weighted FLAIR–volume isotropic turbo spin-echo acquisition sequence (FLAIR-VISTA) with fat suppression shows areas of abnormal brain T2 hyperintensities with better conspicuity in children than a single 2D-FLAIR sequence.
MATERIALS AND METHODS: One week after a joint training session with 20 3T MR imaging examinations (8 under sedation), 3 radiologists independently evaluated the presence and conspicuity of abnormal areas of T2 hyperintensities of the brain in FLAIR-VISTA with fat suppression (sagittal source and axial and coronal reformatted images) and in axial 2D-FLAIR without fat suppression in a test set of 100 3T MR imaging examinations (34 under sedation) of patients 2–18 years of age performed for several clinical indications. Their agreement was measured with weightedstatistics.
RESULTS:Agreement was “substantial” (mean, 0.61 for 3 observers; range, 0.49 – 0.69 for observer pairs) for the presence of abnormal T2 hyperintensities and “fair” (mean, 0.29; range, 0.23– 0.38) for the comparative evaluation of lesion conspicuity. In 21 of 23 examinations in which the 3 radiologists agreed on the presence of abnormal T2 hyperintensities, FLAIR-VISTA with fat suppres-sion images were judged to show hyperintensities with better conspicuity than 2D-FLAIR. In 2 cases, conspicuity was equal, and in no case was conspicuity better in 2D-FLAIR.
CONCLUSIONS: FLAIR-VISTA with fat suppression can replace the 2D-FLAIR sequence in brain MR imaging protocols for children.
ABBREVIATION:VISTA⫽volume isotropic turbo spin-echo acquisition
3
D (volume) gradient-echo T1-weighted sequences are a well-established part of brain MR imaging protocols due to the intrin-sically higher SNR compared with 2D sequences and the ability to obtain optimal MPR.1However, abnormalities of the brain areusually detected as nonspecific areas of variably increased sig-nal in T2WI. FLAIR images are preferable to FSE images for detecting such T2 abnormalities because suppression of the
CSF high signal results in an improved gray-scale dynamic range.2
T2-weighted FLAIR can be combined with 3D-FSE sequences with isotropic voxels that are variably named by different vendors, including volume isotropic turbo spin-echo acquisition (VISTA; Philips Healthcare, Best, the Netherlands), SPACE (sampling perfec-tion with applicaperfec-tion-optimized contrasts by using different flip an-gle evolution; Siemens, Erlangen, Germany), Cube (GE Healthcare, Milwaukee, Wisconsin), isoFSE (http://www.hitachimed.com/ products/mri/oasis/Neurological/isoFSE), and 3D mVox (Toshiba, Tokyo, Japan). Such T2-weighted FLAIR 3D-FSE sequences have a higher SNR than 2D-FLAIR, enable MPR, and are less affected by CSF flow artifacts,3-6which are more prominent in sedated
children at a higher field strength 3T magnet.7-9
Theoretically, suppression of fat signal with spectral presatu-ration could improve the sensitivity of FLAIR-VISTA by further narrowing the gray-scale dynamic range.2
The purpose of the present study was to evaluate whether a Received February 12, 2016; accepted after revision July 4.
From the “Mario Serio” Department of Experimental and Clinical Biomedical Sciences (M.M., A.B.), University of Florence, Florence, Italy; Structural and Functional Neuroradiology Research Unit (M.M.), Diagnostic Radiology (M.B., P.G., M.R.T., D.D., C.D.), and Neurology Unit and Laboratories (E.B.), Meyer Chil-dren’s Hospital, Florence, Italy; and Department of Electrical, Electronic, and Information Engineering “Guglielmo Marconi” (S.D.), University of Bologna, Cesena, Italy.
Please address correspondence to Mario Mascalchi, MD, University of Florence, “Mario Serio” Department of Clinical and Experimental Biomedical Sciences, Viale Morgagni 50, Firenze 50134, Italy; e-mail: [email protected]fi.it
FLAIR-VISTA sequence with fat suppression shows abnormal brain T2 signal hyperintensities with better conspicuity than a 2D-FLAIR sequence on a single axial plane in children.
MATERIALS AND METHODS
This prospective study was approved by the Meyer Children’s Hospital of Florence institutional review board. Parental in-formed consent was obtained before inclusion of each subject in the study.
Selection of the Case Material
One hundred twenty brain MR imaging examinations not af-fected by motion artifacts performed over a 6-month period at a children’s hospital (Meyer Children’s Hospital of Florence) con-stituted the basis for the present study. They were performed in subjects 2–18 years of age for a variety of clinical indications ( Ta-ble 1). Children younger than 2 years of age were excluded be-cause of incomplete WM myelination, which implies a relative hyperintensity of the normal WM and hinders the visual percep-tion of abnormally increased T2 signal.10,11
From the 120 MR imaging examinations, a neuroradiologist with 30 years of experience in brain MR imaging (M.M.) ran-domly selected 20 cases for a training set and 100 further cases for a test set. Overall, 42 MR imaging examinations included in the training (n⫽8) or test (n⫽34) sets were performed with the patients under sedation obtained by breathing vaporized sevoflu-rane through a mask.
MR Imaging Examination
All the MR imaging examinations were performed on a 3T system (Achieva, Release 2.6.3.7; Philips Healthcare, Best, the Nether-lands) equipped with an 8-channel phased array head coil accord-ing to the followaccord-ing protocol: after localizers, volume T1-weighted gradient-echo 1-mm-thick images on a sagittal plane (TR⫽8.2 ms, TE⫽3.8 ms, flip angle⫽8°, FOV⫽256⫻256 mm, matrix⫽252⫻220, 155–175 sections, NEX⫽1, dura-tion⫽7 minutes); FLAIR-VISTA with fat suppression 1-mm-thick images on the sagittal plane (TR⫽8000 ms, TE⫽355 ms, TI⫽2400 ms, variable [10°–180°] flip angle, echo-train length⫽ 110, FOV⫽256⫻256 mm, matrix⫽232⫻232, 155–175 sec-tions, NEX⫽1, sensitivity encoding factor⫽3.0, fat suppression with spectral selection attenuated inversion recovery, duration⫽
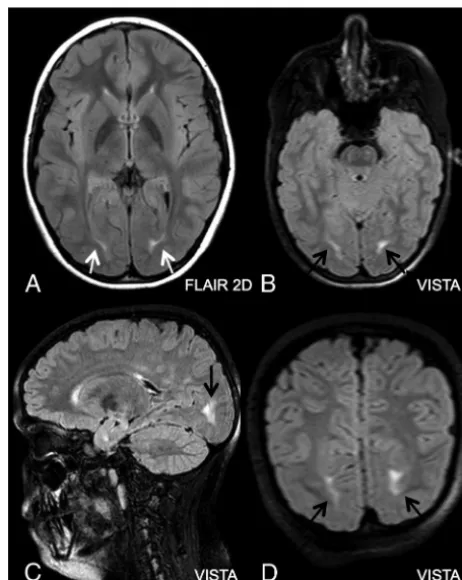
[image:2.594.301.532.45.335.2]5 minutes 28 seconds); 2D-FLAIR 4-mm-thick images on the ax-ial plane parallel to the bicommissural line (TR⫽11,000 ms, TE⫽122 ms, TI⫽2800 ms, flip angle⫽90°, echo-train length⫽ 31, FOV⫽256⫻256 mm, matrix⫽292⫻198, 36 sections, NEX⫽2, sensitivity encoding factor⫽2.2, duration⫽4 minutes 30 seconds); T2-weighted FSE 3-mm-thick images on the coronal plane parallel to the main axis of the cerebral aqueduct (TR⫽ 3000 ms, TE⫽80 ms, echo-train length⫽15, FOV⫽250⫻190 mm, matrix⫽312⫻231, 40 sections, NEX⫽3, duration⫽4 minutes); T2*-weighted gradient-echo 4-mm-thick images on FIG 1. T2 hyperintensity of the WM adjacent to the occipital horns of the lateral ventricles (arrows) in a 9-year-old girl referred for MR imaging for episodes of hypersomnia. This is often observed as an isolated finding in children with otherwise normal MR imaging exam-ination and was indicated in the training session to represent a bor-derline or normal finding to the 3 observers and not to be marked as abnormal T2 hyperintensity.
Table 2: Expert neuroradiologist’s evaluation of the training set
MRI Diagnosis No.
Presence of Abnormal T2 Hyperintensity
None 4 –
WM UBOs 4 4
Leukoencephalopathy 2 2
Focal cortical dysplasia 1 1
Neuronal migration disorders 1 –
UBOs, neurofibromatosis type 1 1 1
Tuber in tuberous sclerosis 1 1
Multiple sclerosis plaques 1 1
Brain infarct – –
Intra-axial tumor – –
Postsurgical tumor evaluation 3 3
Myelination delay 1 1
Brain malformations – –
Others 1 1
[image:2.594.53.286.72.218.2]Note:—UBOs indicates unidentified bright objects. Table 1: Patient demographic characteristics, number of MRI
examinations under sedation, and clinical indications in the training and test sets
Training Set Test Set
No. 20 100
Age (mean) (range) (yr) 9⫾6.5, 2–17 9⫾7, 2–18
Sex Female,n⫽10;
male,n⫽10
Female,n⫽45; male,n⫽55
No. of sedations 8 34
Clinical indications
Epilepsy 9 40
Postsurgery for tumor or epilepsy
3 13
Headache – 12
Malformation – 5
Perinatal damage 1 2
[image:2.594.300.531.428.593.2]the axial plane parallel to the bicommissural line (TR⫽1068 ms, TE⫽16 ms, flip angle⫽18°, FOV⫽250⫻202 mm, matrix⫽ 244⫻194, 24 sections, NEX⫽1, duration⫽3 minutes). In 28 (7 training set; 21 test set) MR imaging examinations, the volume T1-weighted gradient-echo sequence was repeated after intrave-nous administration of gadolinium chelates.
Image Analyses
The expert neuroradiologist preliminarily evaluated the presence of CSF flow artifacts in the middle and posterior cranial fossa in a
binary way (yes/no) on 2D-FLAIR and FLAIR-VISTA images. Three radiologists with at least 5 years of clinical experience in brain MR imaging in children (M.B., P.G., M.R.T.) were involved in image analyses. They had not previously evaluated the MR imaging examinations selected for the study. They participated in a joint session with the expert neuroradiologist on the 20 cases of the training set in which he illustrated the type of contrast in FLAIR-VISTA images with fat suppression on MR imaging exam-inations with normal and abnormal findings. In particular, he made them aware of the usually greater conspicuity in FLAIR-VISTA images with fat suppression of T2 hyperintense caps ob-served in the cerebral posterior periventricular WM correspond-ing to terminal zones of myelination (Fig 1).
Then the 3 observers separately assessed the 100 cases of the test set by using the hospital PACS. The shortest interval between the joint session and beginning of individual sessions was 1 week. Overall, the observers took a maximum of 1 month to complete individual readings of the 100 cases of the test set. They were blinded to the clinical indications for the MR imaging examina-tions and to the expert neuroradiologist’s reports. In addition, most important, the observers were not informed of the study hypothesis, namely that FLAIR-VISTA could demonstrate brain lesions with more conspicuity compared with 2D-FLAIR. They had access to all source images obtained for each examination and to the 3-mm-thick images reconstructed on the axial (parallel to the bicommissural plane) and coronal planes (parallel to the brain stem) from both the source 1-mm-thick sagittal T1WI and FLAIR-VISTA with fat suppression im-ages. No indication was given to the ob-servers concerning the order or method of evaluation of the provided MR im-ages. They were able to look at all images simultaneously on multiple panel mon-itors of a diagnostic workstation and were allowed to manipulate the image visualization by changing the gray-scale window width and level.
The observers were requested to per-form 2 assessments: first, to judge in a binary way (yes/no) whether the FLAIR-VISTA or 2D-FLAIR demonstrated ab-normal focal or diffuse T2 hyperintensi-ties of the brain. If the observer identified such abnormalities in only 1 sequence, his or her judgment was con-sidered negative for abnormal T2 hyper-intensities. Second, in case they identi-fied abnormal T2 hyperintensities on both sequences, they were to evaluate in which sequence the areas of signal changes were shown with better conspi-cuity or whether the conspiconspi-cuity was equal.
Statistical Analyses
Possible differences between the train-ing and test sets were assessed with the Studentt test for parametric variables FIG 2. Results of the visual assessment by the 3 observers of T2 hyperintensities in 100 MR imaging
[image:3.594.53.285.186.353.2]examinations.
Table 3: Expert neuroradiologist’s evaluation of the test set
MRI Diagnosis No.
Presence of Abnormal T2 Hyperintensity
None 28 –
WM UBOs 22 22
Leukoencephalopathy 9 9
Focal cortical dysplasia 4 4
Neuronal migration disorders 1 –
UBOs, neurofibromatosis type 1 2 2
Tuber in tuberous sclerosis 1 1
Multiple sclerosis plaques – –
Brain infarct 3 3
Intra-axial tumor 2 2
Postsurgical tumor evaluation 11 11
Myelination delay 2 2
Brain malformations 5 –
Others 10 10
[image:3.594.59.369.380.706.2]and with the2test for categoric variables. Statistical significance was set atP⬍.05. The interobserver agreement concerning the presence and conspicuity of abnormal T2 hyperintensities in the test set was evaluated by the linear-weighted Cohenstatistic, which measures agreement beyond chance.12Cohencoefficient
values are categorized into 5 levels of agreement: slight (0 – 0.2), fair (0.21– 0.4), moderate (0.41– 0.6), substantial (0.61– 0.8), and almost perfect (0.81–1.0). We considered agreement of pairs of observers (A versus B, A versus C, and B versus C) and the overall mean of the results of the 3 pairs.
In particular, we first measured the agreement of the 3 observ-ers in the entire 100 MR imaging examinations of the test set in judging the presence or lack of abnormal T2 hyperintensities. Then we measured the agreement in judging relative conspicuity of the abnormal T2 hyperintensities in the sample of MR imaging examinations in which all 3 observers recognized the presence of the abnormal T2 hyperintensities.
RESULTS
The training set and test set were not significantly different for the patient demographic data, clinical indications, and number of MR imaging examinations of patients under sedation (Table 1). The expert neuroradiologist judged CSF flow artifacts to be pres-ent in 2D-FLAIR in 96 of 100 cases of the test set, but in FLAIR-VISTA, they were seen in only 2 cases. His assessment of 120 MR imaging examinations is summarized inTables 2and3. In partic-ular, he reported the presence of abnormal T2 hyperintensities in 66 of 100 examinations of the test set. In 5 patients of the test set who underwent an operation, pathologic diagnoses included type IB focal cortical dysplasia, type IIB focal cortical dysplasia, a cor-tical tuber in tuberous sclerosis, a primary neuroectodermal tu-mor, and recurrence of a dysembryoplastic neuroepithelial tumor.
Abnormal T2 hyperintensities of the brain were judged pres-ent in 61/100 FLAIR-VISTA images and 59/100 2D-FLAIR images by observer 1, in 71/100 FLAIR-VISTA images and 69/100 2D-FLAIR images by observer 2, and in 60/100 2D-FLAIR-VISTA images and 62/100 2D-FLAIR images by observer 3.
Figure 2shows the results of the visual assessment of the 100 MR imaging examinations of the test set by the 3 observers. Agree-ment about the presence or lack of abnormal T2 hyperintensities was achieved in 46 of 100 patients, whereas some disagreement occurred in 54 patients. In 23 patients, the radiologists all identi-fied some abnormal brain T2 hyperintensities, and in 23, they all identified none. In 26 patients, 2 operators identified abnormal T2 hyperintensities, and one did not, and in 28, 1 operator only identified abnormal T2 hyperintensities.
Table 4shows the results of the weightedstatistics in the test set concerning agreement of the 3 observer pairs for the presence of abnormal T2 hyperintensities and for comparative evaluation
of the conspicuity of these signal changes in FLAIR-VISTA with fat suppression and in 2D-FLAIR.
The weightedstatistics indicated that agreement for the pres-ence of abnormal focal or diffuse T2 signal hyperintensities was “substantial” (mean, 0.61 for the 3 observers; range, 0.49 – 0.69 for the 3 observer pairs).
All 3 observers judged FLAIR-VISTA with fat suppression im-ages as showing the abnormal T2 signal hyperintensities with bet-ter conspicuity than 2D-FLAIR in 21 of the 23 cases in which they identified abnormal T2 hyperintensities (Fig 3). The conspicuity was similar in 2 of 23 (Fig 4), and in no case was conspicuity better on 2D-FLAIR. The weightedstatistics indicated that the 3 ob-servers showed a “fair” (mean, 0.29; range, 0.23– 0.38) agreement for the comparative evaluation of relative conspicuity of the ab-normal T2 hyperintensities in the 23 cases.
Notably, in 21 of the 26 cases in which 2 observers identified abnormal focal T2 hyperintensities whereas the third operator did not, the abnormality was detected on VISTA-FLAIR but not on 2D-FLAIR (Fig 5).
DISCUSSION
Since its introduction in the early 1990s, the 2D-FLAIR sequence has been added to or replaced 2D T2-weighted spin-echo se-Table 4: Weightedstatistic assessment of the agreement of the 3 observers
Observers 1 and 2
Observers 1 and 3
Observers 2 and 3
Mean Value
Presence of abnormal T2 hyperintensities of the brain (n⫽100) 0.69 0.49 0.64 0.61
Conspicuity of abnormal T2 hyperintensities in FLAIR-VISTA vs 2D-FLAIR (n⫽23)
0.27 0.38 0.23 0.29
[image:4.594.301.533.125.386.2]quences for the detection of abnormal T2 hyperintensities of the brain tissue.2Technologic developments, including multislab
ac-quisition and variable flip angle radiofrequency excitation,13,14
have made 3D-FLAIR sequences compatible with clinical use. Ac-cordingly, 3D-FLAIR has found wide application for MR imaging evaluation of the adult brain in healthy subjects and in patients with a variety of diseases or tumors.14-17The lesser conspicuity of
CSF flow artifacts in our study is in line with findings in previous reports.3-6So far, few studies have compared the capability of
3D-FLAIR (4 without6,18-20and 2 with fat suppression21,22) and
2D-FLAIR in identifying areas of abnormal T2 hyperintensities of the brain.6,18-22
Three of these studies compared the 2 sequences in revealing focal areas of abnormal T2 hyperintensities in the WM of adult patients with MS, and all concluded that 3D-FLAIR might replace 2D-FLAIR in clinical protocols for brain MR imaging of MS.19-21
Instead, Kakeda et al6compared the 2 sequences in adult patients
with a variety of diseases and conditions. Also supported by the analysis of the contrast ratio between the signal intensity of the lesion and normal GM or WM, they confirmed the general supe-riority of 3D-FLAIR. However they reported that leptomeningeal metastases and hippocampal sclerosis were more conspicuous in 2D-FLAIR and that the “ivy sign” in Moyamoya disease (diffuse leptomeningeal T2 hyperintensity, presumably reflecting slowed flow in superficial vessels involved in collateral circulation phe-nomena) was frequently obscured in 3D-FLAIR. Finally, 2 studies addressed the relative contribution of 3D-FLAIR without18or
with22fat suppression versus 2D-FLAIR in evaluating adults and
children with specialized protocols for focal cortical dysplasia. The studies reported conflicting results because 3D-FLAIR was judged superior to 2D-FLAIR in one study18and equal in the
other study,22at least on visual qualitative analysis.
Our study partially differs from the above studies in 3 main aspects. First, we focused exclusively on a population of pediatric patients referred to a children’s hospital with heterogeneous clin-ical indications and MR imaging findings. Second, like Tschampa et al,22we implemented a FLAIR-VISTA sequence with fat
sup-pression. Third, we used FLAIR-VISTA as a supplement to a gen-eral protocol and not to a specialized one for epilepsy. The sub-stantial agreement of our 3 observers for the presence of areas of abnormal T2 hyperintensities in FLAIR-VISTA and 2D-FLAIR appears reasonable when one considers the above heterogeneities and that the observers were blinded to the clinical indications of the MR imaging examination. The latter choice was made to de-crease the variable influence that such knowledge might have on the observers’ assessments.
Most areas of abnormal T2 hyperintensity in FLAIR sequences in our study were the focal nonspecific ones, commonly referred to as unidentified bright objects, which can have a number of underlying pathologic changes (microinfarct, gliosis, demyelina-tion, and so forth).
In our opinion, the “fair” agreement of the 3 observers about the relative con-spicuity of the abnormal T2 hyperinten-sities might reflect their having had no prior clinical experience with FLAIR-VISTA, whereas 2D-FLAIR has been part of the MR imaging brain protocol since the installation of the MR imaging system 7 years earlier.
Remarkably, in no case did the ob-servers agree in judging the abnormal T2 hyperintensities more conspicuous on 2D-FLAIR than on FLAIR-VISTA. The possible partial discrepancy between our findings and those of Kakeda et al6can
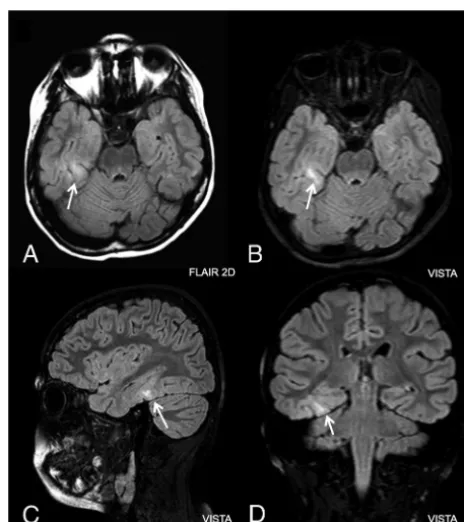
be explained by our having no case of FIG 4. Abnormal focal T2 hyperintensity corresponding to
patholog-ically verified recurrence of dysembryoplastic neuroepithelial tumor in the left parietal-occipital region of a 10-year-old boy. Two observ-ers judged that the abnormal T2 hyperintensity was more conspicu-ous in FLAIR-VISTA (B–D) than in axial 2D-FLAIR (A), whereas 1 observer judged that the conspicuity was similar.
[image:5.594.53.285.184.477.2] [image:5.594.55.376.553.669.2]leptomeningeal metastases or Moyamoya disease. However in the single case of hippocampal sclerosis in our series, 2 of 3 observers judged abnormal T2 hyperintensity of the mesial temporal lobe to be present on FLAIR-VISTA but not on 2D-FLAIR. In our opin-ion, the fat suppression adopted in our study but not in that of Kakeda et al6might have improved detection of this abnormality
in our patients.
Notably, we compared a 3D-FLAIR sequence with sagittal source and axial and coronal reformatted images with a 2D-FLAIR sequence on a single axial plane. Although 2D-2D-FLAIR im-ages were obtained on the axial and coronal planes in a study comparing 3D-FLAIR and 2D-FLAIR in patients with focal cor-tical dysplasia,22this procedure entails a proportional increase of
the acquisition time of the 2D sequence that definitely overcomes the small (18%) increase in the acquisition time of FLAIR-VISTA compared with a single 2D-FLAIR in our study.
We recognize the following limitations of our study: First, we compared FLAIR-VISTA with fat suppression with 2D-FLAIR without fat suppression. Although spectral presaturation of fat is also possible with 2D (spin-warp) acquisition schemes, these are more demanding for the magnet hardware compared with 3D acquisition schemes and imply an increase of sequence duration and generally entail a worse result in terms of homogeneity of fat suppression. Second, we compared visual assessment of FLAIR-VISTA and 2D-FLAIR, which is affected by the observer’s experi-ence and other variables, including room light and the observer’s fatigue, which can compromise the interobserver reproducibility. Moreover, aiming to reproduce the conditions of current clinical work, observers had simultaneous access to the 2 types of images they were requested to evaluate for the presence and relative con-spicuity of areas of abnormal T2 hyperintensities. Admittedly, after training, they could easily recognize the FLAIR-VISTA and the 2D-FLAIR images they were observing. These factors may have introduced biases that a different, more experimental, study setup could have overcome. Third, we focused on detection and comparative evaluation of FLAIR-VISTA with fat suppression and 2D-FLAIR for areas of abnormally increased T2 signal of the brain, whereas we skipped the evaluation of areas of abnormally decreased T2 signal of the brain and of leptomeningeal (extra-axial) lesions.
CONCLUSIONS
FLAIR-VISTA with fat suppression shows abnormal T2 signal hyperintensities of brain gray and white matter with better con-spicuity than the 2D-FLAIR sequence without fat suppression on a single axial plane in subjects 2–18 years of age examined for a variety of indications.
REFERENCES
1. Barkhof F, Pouwels P, Wattejes M.The holy grail in diagnostic neuroradiology: 3T or 3D? Eur Radiol2011;21:449 –56CrossRef Medline
2. De Coene B, Hanjal JV, Gatehouse P, et al.MR of the brain using fluid-attenuated inversion recovery (FLAIR) pulse sequences. AJNR Am J Neuroradiol1992;13:1555– 64Medline
3. Kallmes D, Hui FK, Mugler JP 3rd.Suppression of cerebrospinal fluid and blood flow artifacts in FLAIR MR imaging with a
single-slab three-dimensional pulse sequence: initial experience. Radiol-ogy2001;221:251–55CrossRef Medline
4. Naganawa S, Kawai H, Fakatsu H, et al.High speed imaging at 3 Tesla: a technical and clinical review with an emphasis on whole-brain 3D imaging.Magn Reson Med Sci2004;3:177– 87CrossRef Medline
5. Lummel N, Schoepf V, Burke M, et al.3D Fluid-attenuated inver-sion recovery imaging: reduced CSF artifacts and enhanced sensi-tivity and specificity for subarachnoid hemorrhage.AJNR Am J Neuroradiol2011;32:2054 – 60CrossRef Medline
6. Kakeda S, Korogi Y, Hiai Y, et al.Pitfalls of 3D brain imaging: a prospective comparison with 2D FLAIR. Acad Radiol 2012;19: 1225–32CrossRef Medline
7. Frigon C, Shaw DW, Heckbert SR, et al.Supplemental oxygen causes increased signal intensity in subarachnoid cerebrospinal fluid on brain FLAIR MR images obtained in children during general anes-thesia.Radiology2004;233:51–55CrossRef Medline
8. Ozcan U, Isik U, Ozpinar A, et al.Assessment of sedated pediatric brain with 3D-FLAIR sequence at 3T MRI.Brain Dev2015;37:495– 500CrossRef Medline
9. Lavdas E, Tsougos I, Kogia S, et al.T2 FLAIR artifacts at 3-T brain magnetic resonance imaging.Clin Imaging2014;38:85–90CrossRef Medline
10. Murakami J, Weinberger E, Shaw DW.Normal myelination of the pediatric brain imaged with fluid-attenuated inversion-recovery (FLAIR) MR imaging.AJNR Am J Neuroradiol 1999;20:1406 –11 Medline
11. Dubois J, Dehaene-Lambertz G, Kulikova S, et al.The early develop-ment of brain white matter: a review of imaging studies in fetuses, new-borns and infants.Neuroscience2014;276:48 –71CrossRef Medline 12. Cohen J.Weighted kappa: nominal scale agreement with provision
for scale disagreement or partial credit.Psychol Bull1968;70:213–20 CrossRef Medline
13. Mugler J.Optimized three-dimensional fast-spin-echo MRI.J Magn Reson Imaging2014;39:745– 67CrossRef Medline
14. Naganawa S.The technical and clinical features of 3D-FLAIR in neuro-imaging.Magn Reson Med Sci2015;14:93–106CrossRef Medline 15. Bink A, Schmitt M, Gaa J, et al.Detection of lesion in multiple
scle-rosis by 2D FLAIR and single-slab 3D FLAIR sequences at 3.0 T: initial results.Eur Radiol2006;16:1104 –10CrossRef Medline 16. Kitajima M, Hirai T, Shigematsu Y, et al.Comparison of 3D FLAIR,
2D FLAIR, and 2D T2-weighted MR imaging of brain stem anat-omy.AJNR Am J Neuroradiol2012;33:922–27CrossRef Medline 17. Yoshida A, Tha KK, Fujima N, et al.Detection of brain metastases by
3-dimensional magnetic resonance imaging at 3 T: comparison be-tween T1-weighted volume isotropic turbo spin echo acquisition and 3-dimensional T1-weighted fluid-attenuated inversion recovery imag-ing.J Comput Assist Tomogr2013;37:84 –90CrossRef Medline 18. Saini J, Singh A, Kesavadas C, et al.Role of three-dimensional fluid
attenuated inversion-recovery (3D FLAIR) and proton density magnetic resonance imaging for the detection and evaluation of lesion extent of focal cortical dysplasia in patients with refractory epilepsy.Acad Radiol2010;51:218 –25CrossRef Medline
19. Paniagua-Bravo A, Sa´nchez Herna´ndez JJ, Iba´n˜ez Sanz L, et al.A comparative MRI study for white matter hyperintensities detection: 2D-FLAIR, FSE PD 2D, 3D FLAIR and FLAIR MIP.Br J Radiol2014;87:20130360CrossRef Medline
20. Patzig M, Burke M, Bru¨ckmann H, et al.Comparison of 3D cube FLAIR with 2D FLAIR for multiple sclerosis imaging at 3 Tesla.Rofo
2014;186:484 – 88CrossRef Medline
21. Tan IL, Powels PJ, van Schijndel RA, et al.Isotropic 3D fast FLAIR imaging of the brain in multiple sclerosis patients: initial experi-ence.Eur Radiol2002;12:559 – 67CrossRef Medline