1
M
ULTISTATIC MICRO-D
OPPLER RADAR FEATURE EXTRACTION FORCLASSIFICATION OF UNLOADED
/
LOADED MICRO-
DRONESMatthew Ritchie1, Francesco Fioranelli1, Hervé Borrion2, Hugh Griffiths1
1Department of Electronic & Electrical Engineering, University College London, London, UK 2Department of Security and Crime Science, University College London, London, UK
Abstract
This paper presents the use of micro-Doppler signatures collected by a multistatic radar to detect and discriminate between micro-drones hovering and flying while carrying different payloads, which may be an indication of unusual or potentially hostile activities. Different features have been extracted and tested, namely features related to the Radar Cross Section of the micro-drones, as well as the Singular Value Decomposition (SVD) and centroid of the micro-Doppler signatures. In particular, the added benefit of using multistatic information in comparison with conventional radar is quantified. Classification performance when identifying the weight of the payload that the drone was carrying while hovering was found to be consistently above 96% using the centroid-based features and multistatic information. For the non-hovering scenarios classification results with accuracy above 95% were also demonstrated in preliminary tests in discriminating between three different payload weights.
1. Introduction
In recent years the number of micro-drones, i.e. small Unmanned Aerial Vehicles (UAVs), openly available to civilian use has enormously increased thanks to the relatively low price and simplicity of use. These platforms can be privately used for filming and other leisure activities, but also for potential applications in commercial domains such as support for agriculture, parcel deliveries, help in search and rescue operations, amongst many others. Regulatory bodies such as the Civil Aviation Authority (CAA) in the UK have started to legally control the use of such platforms in order to avoid and sanction potential misuses [1, 2]. However many misuses of micro-drones in criminal and potentially dangerous activities have been reported, for instance privacy invasion and illegal filming of restricted areas, near-miss collisions with people, other micro-drones or larger aircraft near airports, potential use of these platforms to disrupt public events and even to carry explosives or chemical weapons in terrorist attacks [3, 4].
The suitability of conventional radar systems to detect and identify micro-drones is a matter of significant importance to national security and is being investigated while the use of such platforms is becoming more and more widespread. This is expected to be challenging, as micro-drones have low Radar Cross
2 Section (RCS), fly at low altitude, and move at low speed in comparison with more conventional radar targets such as aircraft, helicopters, and larger drones for military applications. The acronym ‘LSS’ is used to indicate the challenge of detecting and identifying micro-drones with conventional radar systems, i.e. Low altitude, Small RCS, Slow speed [5]. In addition to the challenge of detecting the presence of such difficult targets there are also many naturally present targets such as birds, which would cause a large number of false alarms for a sensitive radar. The characterisation of radar signatures from birds has been previously investigated within [6, 7], evaluating the differences in their RCS compared with the micro-Doppler profiles. However, there is little available research on radar detection and classification of micro-drones. In [5,8-10] the micro-Doppler signatures of different models of micro-drones collected using a continuous wave (CW) X-band radar have been analysed to differentiate between different models and between micro-drones and large birds. The use of radar micro-Doppler signatures to identify a small helicopter has also been reported in [11]. In [12] other features extracted at tracking level rather than from micro-Doppler signatures have been proposed to classify micro-drones and distinguish them from other aircraft, birds, or atmospheric phenomena. This is based on the assumption that micro-drones exhibit a specific flying behaviour, different from other targets, and has been tested with simulated data of small UAVs tracks showing promising results. In a recent publication we have investigated the variation of the RCS of micro-drones and their blades as a function of frequency and polarization through simulations and experiments in the controlled environment of an anechoic chamber [13]. In [14] the analysis of RCS of a common model of quadcopter (DJI Phantom 2) was presented using numerical simulations of electromagnetic models with different degrees of fidelity in reproducing the physical parts of the simulated small UAV, and compared with the experimental data obtained.
The main objective of the work presented in this paper is to analyse the micro-Doppler signatures of a micro-drone hovering and flying while carrying different payloads, and to investigate the suitability of features to classify and distinguish between the different cases. The fact that the micro-drone is carrying a payload may be an indication of potentially unusual or hostile activity, and cue other sensors such as optical systems for further identification, or trigger a form of countermeasures if required. A multistatic radar system was used to collect the data, and it is believed that this makes these results of significant interest and particularly novel, as there are few experimental data published on this subject, of which even fewer are multistatic. The analysis of the data seems to suggest that features based on the received power and its fluctuations over time are not particularly effective, whereas features extracted from the micro-Doppler signatures are more suitable for the classification. One possible approach was the use of Singular Value Decomposition (SVD). Rather than extracting features from individual singular vectors as in [8], the approach proposed in this paper assumes that useful information is included in the whole matrices U and V resulting from the SVD. Another approach was the use of two features derived from the centroid of
3 the micro-Doppler signatures, which also proved to be effective. The centroid features extracted are the weighted centre of gravity and the bandwidth relative to this evaluated for each time sample within a spectrogram. This research presented here is an extension of the preliminary results shown in [15] which also utilized these centroid features. In this publication five different types of payloads rather than the previous limited set of three are successfully classified, and the effect on the classification performance of the duration of the data used for feature extraction is also investigated. It is shown that 1 s of data is sufficient to achieve a fast and successful classification with accuracy up to 97%. Different types of features are also investigated and compared with respect to prior work. Data related to micro-UAVs flying with or without payloads (rather than simply hovering) were also analysed, showing promising classification results.
The rest of this paper is organised as follows. Section 2 presents the radar system and the experimental setup for data collection. Section 3 introduces the theory behind the classifiers, shows the analysis of the data and discusses suitable features extracted from the micro-Doppler signatures for the classification of micro-drones carrying different payloads while hovering or moving forwards/backwards. Section 4 concludes the paper with a summary of the results and indicates future potential expansions of this research.
2. Experimental setup and radar system
The data analysed in this paper were recorded using the multistatic radar system NetRAD, developed at University College London over the past twelve years [16]. NetRAD is a netted coherent pulse radar with three separate but identical nodes that operate at 2.4 GHz (S-band). The parameters used to collect these data were linear chirped pulse with 0.6 μs duration and 45 MHz signal bandwidth, 30 s duration for each recording, and 5 kHz pulse repetition frequency (PRF) to ensure that the whole micro-Doppler signature of the micro-drone and its rotor blades was contained in the unambiguous Doppler region. The radar operated at a low power regime, with transmitted power equal to +23 dBm and horizontally polarized antennas with 24 dBi gain and approximately 10°×10° beamwidth. Horizontal polarization was chosen as it was observed that it is more suitable to characterize the micro-Doppler signatures of the rotor blades of micro-drones [13].
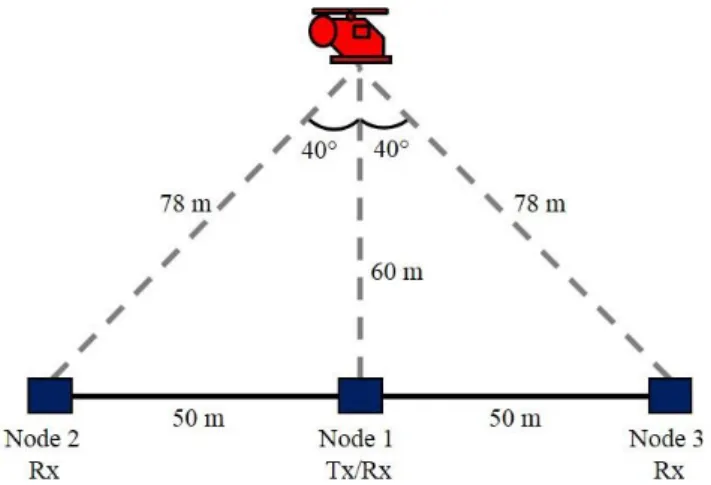
The experiment was performed in July 2015 in an open football field at the UCL Sports Ground to the North of London. The experimental setup is represented in Fig. 1, with the three NetRAD nodes deployed along a linear baseline with approximately 50 m inter-node separation. Node 1 was used as the monostatic transceiver, and Nodes 2 and 3 as the receiver-only bistatic nodes. The micro-drone was hovering at
4 approximately 60 m from the baseline, hence the resulting bistatic angle was 40° for both bistatic nodes. Data were collected about the exact tracks of the micro-UAV, in this case flying towards Node 1 from approximately 90 to 60 m from the baseline. The model of micro-drone used in this experiment was the quadcopter DJI Phantom Vision 2+. The default camera was removed during the experiment to fit the micro-drone with different payloads. The drone had an initial weight of 1.2 kg before any payloads are added. The payloads consisted of a plastic tray mounted below the drone and containing small metallic discs, each weighing 10 g. Using multiple discs, data for four different payloads were recorded, namely 200 g, 300 g, 400 g, and 500 g, as well as the case where the micro-drone was fitted with no payload. The 500 g payload appeared to be the limit for the micro-drone to take off, the drone was capable of taking off but was much laboured in its flight. The material of the discs used as payload was the same in all cases, but more discs were progressively used to get heavier payloads, making the overall size slightly bigger.
Figure 1 Experimental setup for the data collection
3. Data analysis and classification
3.1 Classification TheoryDiscriminant Analysis
The first classifier applied in this work is based on the discriminant analysis method, in particular its diagonal-linear variant which is described in detail within [17, 18]. The assumption of this method is that the samples of each class are represented by a multivariate Gaussian distribution, and the parameters of this distribution (mean and covariance matrix) are estimated during the initial training phase of the classifier. Equation 1 shows the probability density function of the Gaussian distribution, where µk is the mean for class k, Σk the covariance matrix, and |Σk | is the determinant of the matrix.
𝑃(𝑥|𝑘) = 1 √2𝜋|𝛴𝑘|exp (− 1 2(𝑥 − 𝜇𝑘) 𝑇𝛴 𝑘−1(𝑥 − 𝜇𝑘)) (1)
5 At the training phase the diagonal-linear variant of the classifier estimates a single covariance matrix for all the classes, with the assumption that only the mean values change between different classes. The sample space is divided into different regions where an expected classification cost, C, is related to each predicted classification posterior probability, 𝑃̂, with the aim of minimizing this cost as:
𝑦̂ = argmin
𝑦=1,…,𝐾 ∑ 𝑃̂(𝑘|𝑥)𝐶(𝑦|𝑘) 𝐾
𝑘=1 (2)
Naïve Bayes
The Naïve Bayes classifier uses the assumptions that the individual features from each class are Independent and Identically Distributed (IID) Gaussian samples. Therefore the definition of each class can be reduced to the mean and variance of the features within that class. This method models posterior probabilities using Bayes rule such that,
𝑝(𝐶𝑘|𝑥) =𝑝(𝐶𝑘)𝑝(𝑝(𝑥)𝑥|𝐶𝑘) (3)
where 𝑝(𝐶𝑘|𝑥) is the probability of class k given the input samples x, 𝑝(𝐶𝑘) and 𝑝(𝑥) are the probabilities of the classes and samples respectively, and 𝑝(𝑥|𝐶𝑘) is the probability of a sample given the class. The advantage of this classifier is that it is simple to implement and has low computational load. For both this method and the Discriminant analysis technique the assumption that the samples are Gaussian distributed may have a significant effect on the results if this is not valid for the features selected.
Random forest theory
The third applied classifier to the data was a random decision forest method, [19, 20]. This technique is a supervised machine learning algorithm that uses a series of decision trees in order to discriminate between the different classes of input data. An input is initiated at the top of a decision tree and is passed through the series of binary decision branches, which finally results in the input sample being defined as part of one of the possible classes. The random aspect of this method is to extract a random subset of the input data and iterate the decision process with different decision trees, with the goal of obtaining a series of partitions that minimize the sum of errors in classification. The error in the random forest technique is defined by the Gini Diversity Index (GDI) which is
𝑔(𝑛) = 1 − ∑ 𝑝2(𝑖)
𝑖 (4)
where g is the GDI, i is the classes, is p is the fraction of classes with the correct class i that reach a given node with the classifier tree. This is minimised by varying the decision criterion which affects the net
6 GDI of the forest. The advantage of random forest classifiers is that they do not require Gaussian distributed samples and can handle large feature space variables well.
3.2 Received Power Features
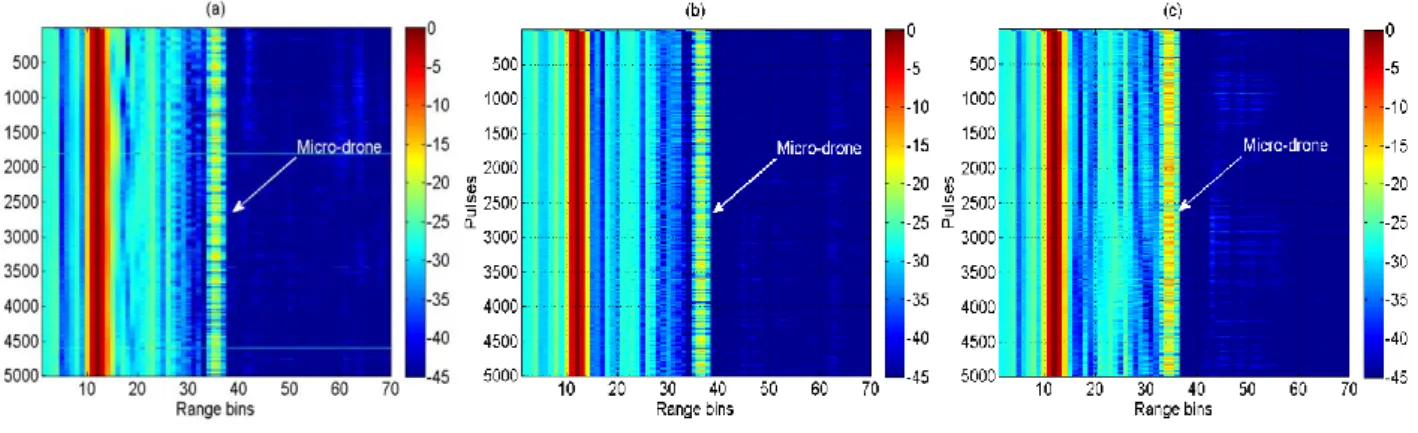
The first classification approach tested on the data was based on features related to the received power reflected from the micro-drone in the time domain, with the assumption that the presence of the payload would modify the overall RCS of the micro-drone and increase the received power at the radar. Range-Time-Intensity (RTI) were produced by dividing each 30 s dataset into 30 blocks with 1 s duration. Each block consisted of 5000 pulses at the given 5 kHz PRF. Figure 2 shows examples of these RTI plots with data collected at the monostatic Node 1 for no payload, medium payload (200 g), and heavy payload (500 g). The drone is represented by the vertical line within the plot as it resided in the same range bin throughout the recording while hovering. The additional lines within the plots, at shorter ranges, are due to internal characteristics of RF switching within each node and not related to the target.
Figure 2 Range-Time-Intensity plots over 1 s of data collected at monostatic Node 1 for micro-drone fitted with (a) no payload, (b) 200 g payload, and (c) 500 g payload
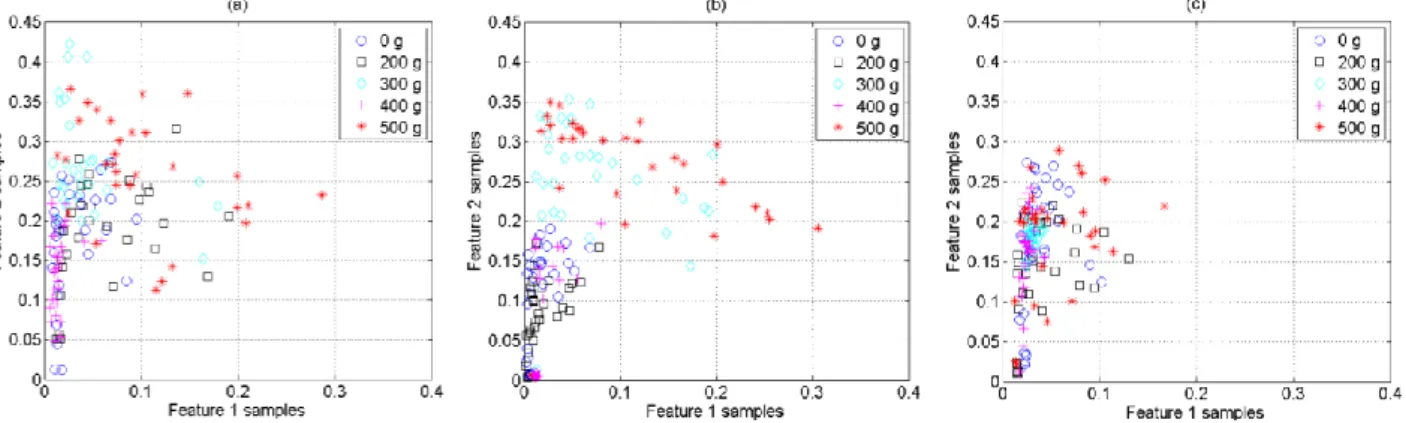
The mean and the standard deviation of the received power at the range bin containing the micro-drone signatures were hypothesized as features to discriminate between the different classes of payloads. Figure 3 shows feature-space plots for samples of these two features extracted from the data collected at different radar nodes, feature 1 being the mean and feature 2 the standard deviation. At Nodes 1 and 2 (Fig. 3a-3b) it appears that the mean of the received power over 1 s (Feature 1) is higher for the heaviest payload (500 g). However, the overall separation between the five classes is rather poor; hence, these features are not expected to be well suitable for a successful classification. Estimation of the mean and standard deviation of the received power over a longer time interval of up to three seconds have been also tested, but the separation of the different payload classes was found not to improve. There were changes in micro-drone RCS with different payload types, but a direct relation between received power features and size of the
7 payload was not established. The focus of the classification analysis was therefore moved to the micro-Doppler signatures of the micro-drones.
Figure 3 Feature space plots based on RTI features for data extracted from the three radar nodes and all five classes: (a) Node 1, (b) Node 2, and (c) Node 3
3.3 SVD features
The recorded data were processed using Short Time Fourier Transform (STFT) to characterize the micro-Doppler signatures of the micro-drone hovering with different payloads. Each 30 s recording was divided into smaller blocks and the STFTs of each block was calculated using a 0.1 s Hamming window with 95% overlap between adjacent windows. Five different durations of the smaller blocks were used, namely 1 s, 1.5 s, 2 s, 2.5 s, and 3 s in order to assess the effect of this parameter on the overall micro-Doppler based classification, in particular whether shorter available data are sufficient to perform a successful and fast classification.
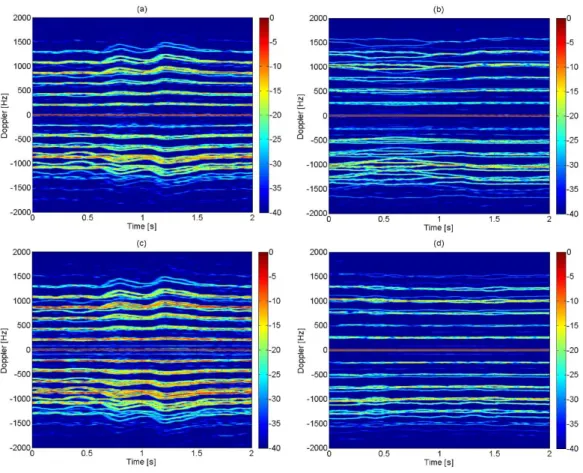
Figure 4 shows examples of micro-Doppler signatures for micro-drone hovering with no payload and with 500 g payload, for both monostatic and bistatic data. The duration of the data used to generate each spectrogram was 2 s in this case. The horizontal lines related to the rotation of the blades of the micro-UAV are clearly visible in these spectrograms and are similar to those reported in the literature for these kinds of platforms [5, 8, 10]. The difference in spectrograms between the two extreme cases (no payload and 500 g payload) can be empirically seen, with the blade lines appearing more uniform and straight and reaching higher positive and negative Doppler frequencies for the latter case. This is assumed to be related to the higher rotational speed of the blades when the micro-drone is loaded in order to get higher lifting force to cope with the weight of the payload. These empirical differences need to be quantified and characterized through suitable features and numerical parameters to use as inputs to classifiers.
8 Figure 4 Spectrograms for the micro-drone hovering: (a) monostatic data 0 g payload, (b) monostatic data 500 g payload, (c) bistatic data 0 g payload, and (d) bistatic data 500 g payload
A first approach to extract suitable features uses SVD on the spectrograms. The application of SVD analysis to a dataset allows for the decomposition of the original matrix into a lower dimensional space defined by the key components of the original matrix. The theorem defines that any matrix M can be noted as:
𝐌 ∈ 𝑹𝑚𝑥𝑛 (5)
If the matrix M has an arbitrary rank r and m≥n it can be represented by a sum of rank one matrices such that,
𝐌 = ∑𝑟 𝑼𝑖𝑺𝒊𝑽𝒊𝑻
𝑖=1 (6)
Applying this approach to the Doppler data treats the spectrogram as a matrix M, with SVD representation given by M = USVT, where S is a diagonal matrix with the singular values of M, and V and U are the matrices containing the right and left singular vectors of M. SVD has been proposed as an approach to extract suitable features for the classification of different models of micro-UAVs and their discrimination from birds [8]. It has been shown that this technique can reduce the dimensionality of the feature space by keeping only singular vectors associated with the largest singular values, and that
9 physical characteristics of the micro-UAVs such as velocity or motion periodicity are related to particular SVD vectors. Our previous work in [21] has also applied features extracted from singular vectors to human micro-Doppler analysis for multistatic classification of armed and unarmed personnel and for personnel recognition [22].
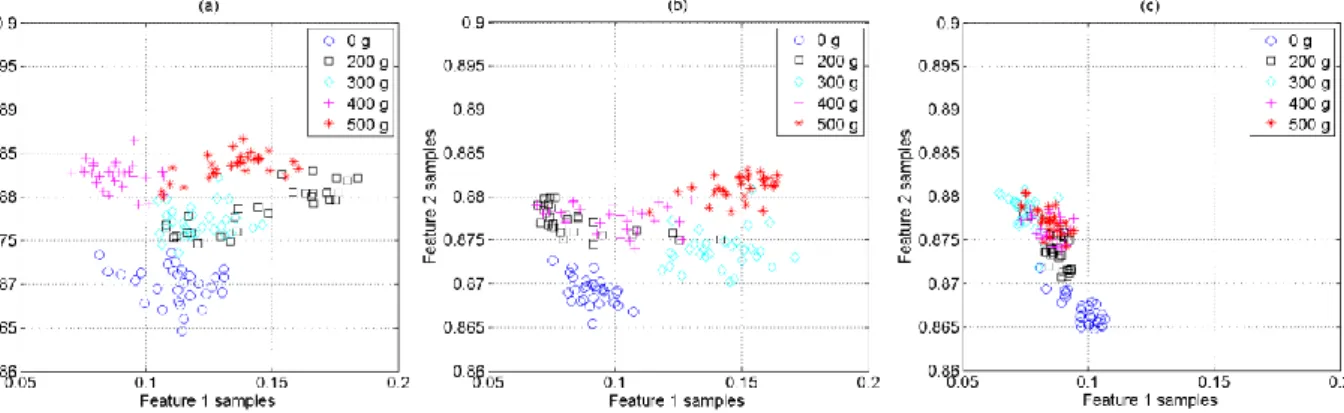
The feature extraction approach proposed in this paper is different from the aforementioned works, as it assumes that the relevant information may not be strictly concentrated in only a few singular vectors, but spread across multiple vectors in the whole matrices U and V. The analysis of the available data showed that the values in the V matrix do not present particular variations for different classes, i.e. micro-drone fitted with different payloads. On the contrary the values in the diagonal of the U matrix show noticeable changes for different payloads, and the mean and the standard deviation of these values appear to be suitable features to obtain good separation between the different classes. Figure 5 shows feature space plots for the five different classes considered in this paper using data collected at the three different radar nodes. Feature 1 and 2 are the mean and standard deviation of the SVD outputs from each spectrogram matrix respectively. The best separation between the classes is obtained at the monostatic node (Fig. 5a), but it is interesting to notice that feature samples related to the case without payload are well separated from the others for data at all the three nodes.
Figure 5 Feature space plots based on SVD features for data extracted from the three radar nodes and all five classes: (a) Node 1, (b) Node 2, and (c) Node 3
The three classifiers used in this paper are the Naïve Bayes, diagonal-linear variant of the discriminant analysis classifier and the random forest classifier, of which the first two have been previously successfully applied in [18]. All of these machine learning algorithms can be trained on a fraction of the input set of features and then used to classify unknown inputs using the features available.
The classifiers applied were trained with a given percentage of the available data, from 10% to 50%, and the remaining data are then used to test the classifier’s performance and calculate the classification error. This process is repeated 100 times with randomly selected samples to form the training dataset, in order to remove the effect of possible bias in the data used to train the classifier and to test the consistency of its
10 behaviour. The classification error at each repetition is calculated as the ratio of the total number of misclassification events over the total number of samples, and the overall classification error is the average over the 100 repetitions. The results shown in this paper are expressed in terms of percentage classification accuracy, which is simply 100% minus the average error.
Three different approaches of combining multistatic data are used to perform the classification, and their results compared with the use of only monostatic data, as if from a conventional radar system. In the first approach feature samples from all the three radar nodes are processed by a single, centralised classifier that provides the final decision. In the second approach separate classifiers process the feature samples extracted at each radar node and provide partial decisions that are then combined in a voting procedure to reach the final decision (i.e., with a majority of two out of three nodes). The third approach takes into account the level of confidence of each partial decision by setting a threshold. If two nodes agree on a partial decision and both have higher confidence than the threshold, then they will provide the final decision. However, if one of these two nodes has lower confidence than the threshold, and if at the same time the third node has a higher level of confidence than the other two nodes, then the final decision will be provided by the third node. This approach aims at preventing that two nodes with low level of confidence may lead to a misclassification event. The threshold has been set at 65% as the value providing the best classification results after testing values in the interval 55%-75% with the available data. Additional data from further experiments may change the value of this threshold, as well as different deployment geometries of the radar nodes which could cause a particular node to be more or less reliable than the others, hence leading to a different threshold.
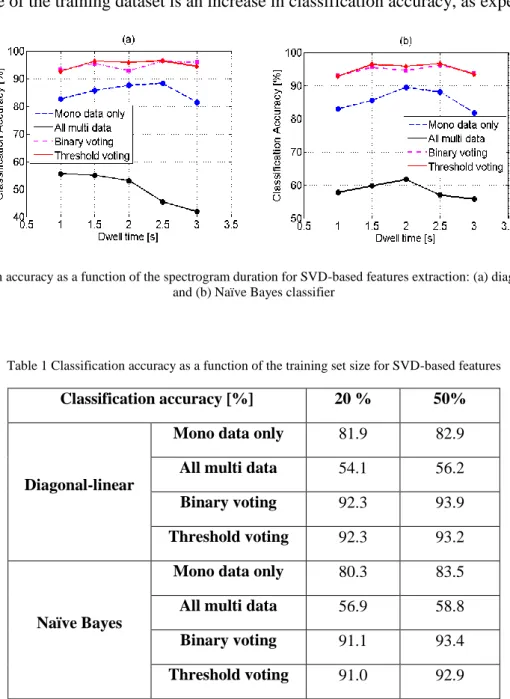
Figure 6 shows the classification accuracy for different duration of the spectrograms used to extract feature samples based on SVD, namely 1, 1.5, 2, 2.5, and 3 seconds (dwell time). The results are reported for the two types of classifier, namely diagonal-linear in Fig. 6a and Naïve Bayes in Fig. 6b, and for different ways of using multistatic information. The size of the training set was 40% of the available data. As a general trend, the classification accuracy increases up to 10% when using multistatic data with voting and separate classification at each node in comparison with the monostatic only case. On average there is a small effect on classification accuracy of the confidence threshold approach with respect to the simple binary voting. It is also interesting to notice that the classification accuracy degrades greatly when the multistatic data are processed by a centralized classifier. This is believed to be related to the differences in micro-Doppler signatures, and consequently in features samples, between the data at each radar node because of the different aspect angle to the micro-drone. Similar results were observed in previous work on different classification problems involving human micro-Doppler [21-22]. This analysis seems to suggest that the use of multistatic data can provide a significant advantage in terms of
11 classification accuracy improvement, provided that the multistatic data are processed separately at each radar node, at least for the features selected in this paper. The classification accuracy does not seem to vary much as a function of the duration of the data used for feature extraction, and values consistently above 92% can be observed when multistatic data are used at separate classifiers for each node. This suggests that successful classification can be achieved even with 1 or 1.5 second of data, hence with fast dwell time on targets.
Table 1 shows the classification accuracy for different sizes of the classifier training dataset, namely 20% and 50%. In this case the duration of the spectrograms used for feature extraction was 1 s. The same trends in the classification accuracy for different ways of using multistatic information can be seen as for Fig. 6, i.e. the advantage of using multistatic data in separate classifiers at each radar node. The effect of increasing the size of the training dataset is an increase in classification accuracy, as expected.
Figure 6 Classification accuracy as a function of the spectrogram duration for SVD-based features extraction: (a) diagonal-linear classifier, and (b) Naïve Bayes classifier
Table 1 Classification accuracy as a function of the training set size for SVD-based features
Classification accuracy [%] 20 % 50%
Diagonal-linear
Mono data only 81.9 82.9
All multi data 54.1 56.2
Binary voting 92.3 93.9
Threshold voting 92.3 93.2
Naïve Bayes
Mono data only 80.3 83.5
All multi data 56.9 58.8
Binary voting 91.1 93.4
Threshold voting 91.0 92.9
12 3.4 Centroid features
Other suitable features for classification of micro-drones fitted with different payloads are based on the Doppler and bandwidth centroid of the micro-Doppler signatures. These features were briefly discussed and tested in our previous work in [15] where only three classes were considered, namely 0 g, 200 g, and 500 g payloads. The Doppler centroid is an estimation of the centre of gravity of the micro-Doppler signature, whereas the Doppler bandwidth provides an estimate of the signature bandwidth around the centroid. These features have also been previously used in [23] when evaluating wind turbine signatures. These parameters can be calculated as in (1) and (2) respectively, where S(i,j) represents the value of the spectrogram at the ithDoppler bin and jth time bin.
f
c(j) =
∑ f(i)S(i,j)i∑ S(i,j)i
(7)
B
c(j) = √
∑ (f(i)−fi c(j))2S(i,j)∑ S(i,j)i
(8)
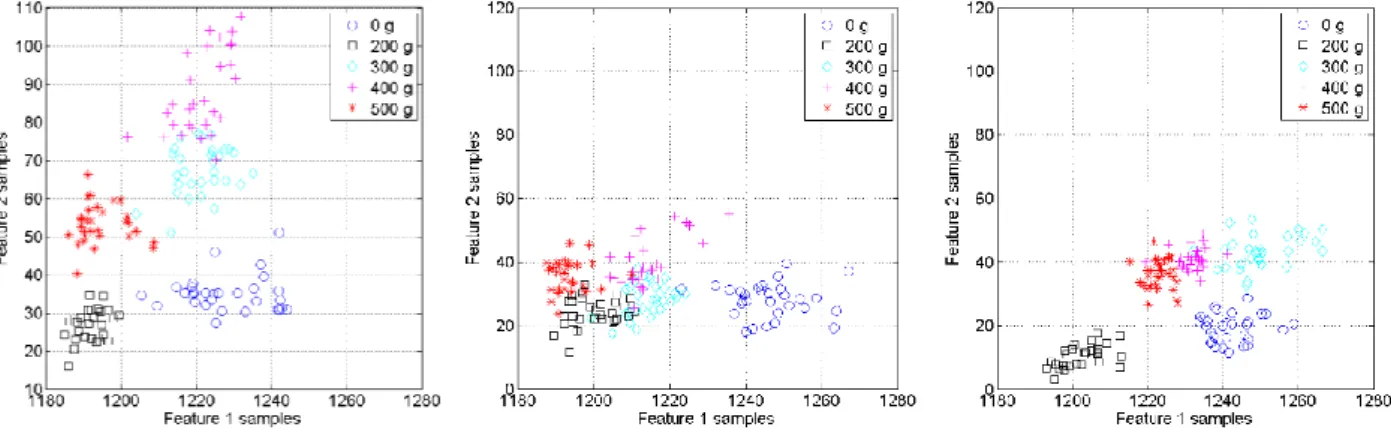
In this work the mean of these two parameters are used as features to perform classification between the five different classes considered. Their effectiveness is then investigated as a function of the size of the training set and duration of the spectrograms used for feature extraction. Figure 7 shows feature space plots for the centroid based features with samples related to the five different classes considered in this paper and extracted from data collected at the three different radar nodes. Clear separation between the five classes can be seen in the data recorded at all three nodes, hence good classification performance is expected using these features, as well as an improvement in comparison with the SVD-based approach.
Figure 7 Feature space plots based on centroid features for data extracted from the three radar nodes and all five classes: (a) Node 1, (b) Node 2, and (c) Node 3
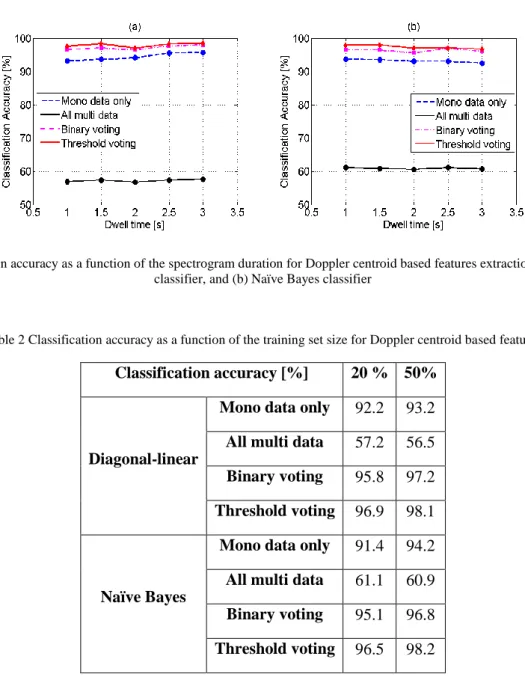
13 Figure 8 shows the classification accuracy for different durations (dwell time) of the spectrograms used to extract feature samples based on the mean of the Doppler centroid and bandwidth. The different durations are the same as in Fig. 6 for SVD based features, as well as the classifier types and different ways of using multistatic information. The size of the training set was 40% of the available data. The trends in classification accuracy are the same as already observed in Fig. 6; i.e., the performance improvement if multistatic data are used at separate classifiers at each radar node and the degradation in accuracy if all the data are processed at a centralised classifier. For these centroid-based features an increase in accuracy can be seen if the confidence threshold approach is used in comparison with simple binary voting, although in some cases this improvement is only approximately 1%. On average the overall classification accuracy is higher for this type of features in comparison with the SVD-based features previously discussed, i.e. a range of values between 92.8% and 96.6% for SVD-based features and between 96.8% and 98% for centroid-based features (considering the voting with threshold approach for the Naïve Bayes classifier). This result is related to the sample separation of the five different classes as shown in Fig. 5 and Fig. 7, with better inter-class separation when centroid-based features are used. Given a classification approach, there is no significant effect of the different spectrogram durations on the performance. Classification accuracy around 98% can be achieved with 1 second or 1.5 second of data, i.e. with fast dwell time.
Table 2 shows the classification accuracy for two different amounts of the available data used as training set for the classifier, namely 20% and 50%. The spectrogram duration for feature extraction was 1s. The trends are similar to those observed for Table 1 related to the SVD-based feature, and as expected larger training dataset help increase the classification accuracy. As already observed, the overall classification accuracy appears to be higher for centroid-based features in comparison with SVD-based features (Table 2 compared with Table 1). For reference, two confusion matrices are reported in Table 3. The results refer to the linear-diagonal classifier trained with 20% of the data and with feature samples extracted from 1 s spectrograms. The classification accuracy is higher for centroid–based features than for SVD-based features. It is interesting to observe that most of the misclassification events happen between different types of payload, mostly between the 300 g and 400 g classes, whereas the no payload case has been correctly classified in 100% of the cases. It is unclear why misclassifications occur mostly for the 400 g payload class. On the one hand it could be that the payload was fitted to the micro-drone in a slightly different way from the other cases. On the other hand, 400 g appeared to be the limit for the micro-drone to fly with its usual dynamics and inertial response. For the heavier payload (500 g) the drone was indeed much laboured in its flight and its response to the flight commands was very different from normal operations. 400 g was a sort of transition point in the micro-drone response to commands to change
14 orientation or altitude, and this could have caused changes in the micro-Doppler pattern that reduced the classification accuracy. More tests are needed to fully investigate this.
Figure 8 Classification accuracy as a function of the spectrogram duration for Doppler centroid based features extraction: (a) diagonal-linear classifier, and (b) Naïve Bayes classifier
Table 2 Classification accuracy as a function of the training set size for Doppler centroid based features
Classification accuracy [%] 20 % 50%
Diagonal-linear
Mono data only 92.2 93.2
All multi data 57.2 56.5
Binary voting 95.8 97.2
Threshold voting 96.9 98.1
Naïve Bayes
Mono data only 91.4 94.2
All multi data 61.1 60.9
Binary voting 95.1 96.8
Threshold voting 96.5 98.2
Table 3 Confusion Matrices for diagonal-linear classifier trained with 20% of the data. The spectrogram duration is 1 s and the feature extracted are centroid-based features and SVD-based features
Centroid-based features SVD-based features
CM 0g 200 g 300 g 400 g 500 g CM 0g 200 g 300 g 400 g 500 g 0 g 100.0 0.0 0.0 0.0 0.0 0 g 100.0 0.0 0.0 0.0 0.0 200 g 0.0 100.0 0.0 0.0 0.0 200 g 0.0 92.9 3.0 4.1 0.0 300 g 0.0 0.0 95.0 5.0 0.0 300 g 0.6 0.1 94.1 1.4 3.9 400 g 0.0 0.0 12.4 84.2 3.4 400 g 0.0 11.1 2.9 81.0 5.0 500 g 0.0 0.0 0.0 0.4 99.5 500 g 0.0 0.0 0.0 6.8 93.2
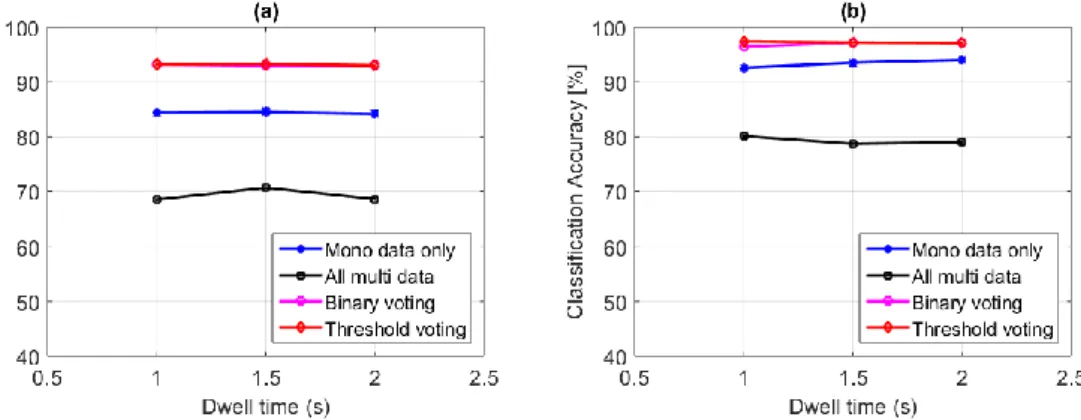
15 Further to the already applied classification models an additional random forest algorithm was used on the data as a comparison. The random forest technique generates numerous logic statements based on the individual features in order to differentiate an overall sample into the various potential categories. This was applied to both the SVD generated features and the centroid based features from the hovering data, as in Fig. 6 and Fig. 8. The same level of training data, 40 %, was used to allow for a direct comparison. The results from the random forest classifier are shown in Fig. 9(a) & (b) for the SVD and Centroid features respectively. In both cases a similar trend from the discriminant analysis and Naïve Bayes is observed, with the centroid features showing slight improvement in accuracy, and the threshold binary voting of 3 independent classifiers being the most effective way to perform this classification, whereas the fusion of all data into a single classifier is the least. These results only cover dwell times from 0.5 s to 2 s of data, as when the dwell times were increased above this the classifier failed to operate successfully because there was an insufficient amount of training data. The same total quantity of data is conserved when varying the dwell time, it is simply the “size” of each individual sample that is increased or decreased as the dwell is changed. From these results it is therefore difficult to state which dwell time is optimum when attempting to classify a payload on the drone, but it is clear that the effectiveness of classification was independent of dwell time in the range of 0.5 of 2 seconds.
Figure 9 Random Forrest classifier results using (a) SVD and (b) Centroid data for varying Dwell times
3.5 Data analysis for flying micro-drone
In this sub-section some results of the analysis of data related to the micro-drone actually flying while carrying different payloads are presented. In each 30 seconds recorded dataset the micro-drone was flying back and forth on an approximate straight line perpendicular to the baseline of the radar nodes (shown as in Fig. 1). Care was taken in trying to keep the flight velocity as regular and constant as possible in
16 different scenarios, compatibly with the unpredictable wind conditions outdoor and the different inertial response of the drone when fitted with the heaviest payload. Three different types of payloads were considered in these tests, namely no payload, 300 g payload which is comparable to the weight of the default cameras on many micro-drones (removed in these tests), and 500 g payload which is the heaviest payload with which this popular model of micro-drone can fly.
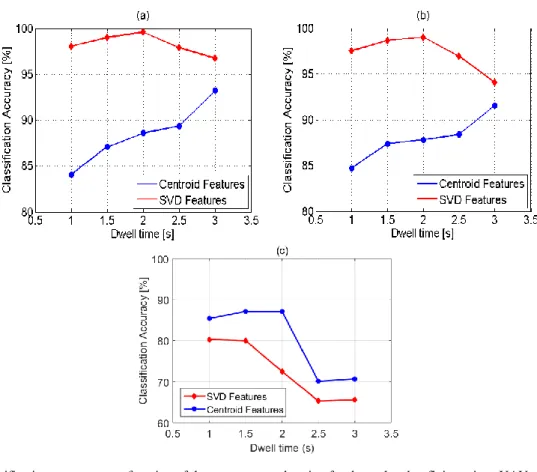
The same features extracted from the micro-Doppler signatures have been used for classification on these data, namely centroid-based features and SVD-based features. Figure 10 shows classification accuracy as a function of the duration of the data to extract features (dwell time), assuming 40% of the available samples to train the classifiers and multistatic data combined using the voting with threshold approach. Results related to the diagonal-linear classifier are shown in Fig. 10a, Naïve Bayes classifier in Fig. 10b and Random Forest classifier in Fig. 10c.
For the first two classifiers the classification accuracy increases when SVD based features are used in comparison with centroid based features, whereas opposite results were obtained for data related to the micro-drone simply hovering in the previous sub-sections. The classification accuracy appears to increase with increasing dwell time when using centroid based featured, whereas an optimal dwell time of 2 s is obtained when using SVD based features, with high accuracy up to approximately 98%. The difference in results using the first two classifiers does not seem to be very relevant, whereas there are some differences with the random forest behaviour. This is thought to be related to the different mathematical approaches used by the classifiers, i.e. diagonal-linear and Naïve Bayes assume Gaussian distributions for the feature samples in each class, whereas the random forest does not. This may yield different performance for different sizes of the feature space as function of dwell time (e.g. here increased accuracy with dwell time for the first two classifiers, but decreased accuracy for the third one). More investigation and additional data are needed to test and validate these preliminary results, investigating whether these features are suitable and exhibit this behaviour for different flying paths of the micro-drone, different shapes and sizes of the payload, and different models of micro-drones. As an example, Table 4 shows the confusion matrix related to the classification problem of micro-drones flying with 0g, 300g, or 500g payloads. In this case the diagonal-linear classifier was trained with 40% of the available data and the voting with threshold approach was used to combine multistatic information. The dwell time on data to extract features was 1 s. As expected from the results in Fig. 9, SVD based features yield higher classification accuracy than centroid based features. The majority of classification mistakes happen between the 300 g and the 500 g class, whereas the 0 g case appears to be correctly classified with very high accuracy (100% of the times when SVD based features were used).
17 Figure 10 Classification accuracy as a function of the spectrogram duration for data related to flying micro-UAV: (a) diagonal-linear
classifier, and (b) Naïve Bayes classifier (c) Random Forest classifier
Table 4 Confusion Matrices for diagonal-linear classifier trained with 40% of the data. The spectrogram duration is 1 s and the feature extracted are centroid-based features and SVD-based features
Centroid-based features SVD-based features CM 0g 300 g 500 g CM 0g 300 g 500 g
0g 95.3 4.6 0.1 0g 100.0 0.0 0.0 300 g 13.1 66.8 20.0 300 g 0.0 95.8 4.2 500 g 2.9 7.1 90.0 500 g 0.0 1.2 98.8
4. Conclusions
This paper has investigated suitable features extracted from multistatic radar data to identify and classify micro-drones hovering and flying while carrying different payloads, which may be an indication of unusual or potentially hostile activities. Three different classifier algorithms were applied, with the Discriminant Analysis and Naïve Bayesian techniques outperforming the Random Forest in the scenarios shown. Successful classification with accuracy above 96-97% for 5 classes of payloads and 1 s of data for feature extraction has been achieved using features extracted from the centroid of the multistatic micro-Doppler signatures. Features based on the SVD decomposition of the spectrograms proved also to be effective for the classification, whereas features based on the radar received power in time domain appeared not to be suitable. It has also been observed that the classification accuracy improves when separate classifiers are used to process the data from the different radar nodes in comparison with the
18 approach of having all the data processed by a centralised, single classifier. This addresses the issue of what level data should be fused at in order to optimise classification performance. Promising results related to micro-drones actually flying while carrying different payloads were also presented, showing high classification accuracy above 95% for SVD features extracted from 1 second of data. Interesting results have been highlighted regarding the suitability of different features for different scenarios, e.g. the fact that SVD based features appear to provide better classification accuracy than centroid based features to classify flying micro-drones, whereas the opposite is true for hovering micro-drones. This seems to suggest that different types of features may be needed for different scenarios and flying/hovering paths in order to maximise the classification accuracy, with the added degree of freedom of different features at different radar nodes of a multistatic radar system.
Future work will aim at validating the suitability of these features for different scenarios, such as different models of drones with different number and configurations of rotor blades or fixed-wing micro-drones, different shapes, size, and materials for the payloads, and different deployment geometries and bistatic angles for the radar nodes to see whether there is an optimal geometry for classification. Data in which the micro-drones are actually flying along more realistic trajectories will also be collected and analysed, possibly with simultaneous presence of loaded and unloaded micro-drones.
Acknowledgement
This work was supported by the IET A. F. Harvey Prize awarded to Hugh Griffiths in 2013 and the Engineering and Physical Sciences Research Council [EP/G037264/1]. The authors would like to thank Colin Horne, Jarez Patel, and Folker Hoffmann for their help in the experiment.
References
[1] “Unmanned aircraft, Requirements for operating in UK airspace”, https://www.caa.co.uk/default.aspx?catid=1995, accessed in January 2016.
[2] “Are drones dangerous or harmless fun?”, http://www.bbc.co.uk/news/uk-england-34269585 , accessed in January 2016.
[3] “Warning over drones use by terrorists”, http://www.bbc.co.uk/news/technology-35280402, Accessed in January 2016.
19 [4] Ritchie, M., Fioranelli F., Borrion H.; ‘Micro UAV Crime Prevention: Can we help Princess Leia?’ In: Preventing Crime Problems around the Globe through Research Innovations in the 21st Century, B. Leclerc and E. Savona (Eds.), Springer. (Accepted).
[5] R. I. A. Harmanny, J. J. M. de Wit, and G. P. Cabic, 'Radar micro-Doppler feature extraction using the spectrogram and the cepstrogram', 2014 European Radar Conference (EuRAD), Rome, Italy, October 2014.
[6] Torvik, B.; Olsen, K.E.; Griffiths, H.D., "X-band measurements of radar signatures of large sea birds," in 2014 International Radar Conference, Lille , France, pp.1-6, 13-17 Oct. 2014.
[7] Torvik, B.; Knapskog, A.; Lie-Svendsen, O.; Olsen, K.E.; Griffiths, H.D., "Amplitude modulation on echoes from large birds," in 2014 European Radar Conference (EuRAD), pp.177-180, 8-10 Oct. 2014.
[8] J. J. M. De Wit, R. Harmanny, and P. Molchanov, "Radar Micro-Doppler Feature Extraction Using the Singular Value Decomposition," 2014 International Radar Conference, Lille, France, October 2014.
[9] J. J. M. de Wit, R. I. Harmanny, and G. Premel-Cabic, ‘Micro-Doppler analysis of small UAVs’, 2012 European Radar Conference (EuRAD), Amsterdam, The Netherlands, October 2012.
[10] P. Molchanov, K. Egiazarian, J. Astola, R. I. Harmanny, and J. J. M. de Wit, ‘Classification of small UAVs and birds by micro-Doppler signatures’, 2013 European Radar Conference (EuRAD), Nuremberg, Germany, October 2013.
[11] D. Tahmoush, ‘Detection of small UAV helicopters using micro-Doppler’, Proc. SPIE 9077 Radar Sensor Technology XVIII, Baltimore, USA, May 2014.
[12] N. Mohajerin, J. Histon, R. Dizaji, and S. L. Waslander, ‘Feature extraction and radar track classification for detecting UAVs in civillian airspace’, 2014 IEEE Radar Conference, Cincinnati, USA, May 2014.
[13] F. Fioranelli, M. Ritchie, H. Griffiths, B. Torvik, ‘Micro-Drone RCS Analysis’, 2015 IEEE Radar Conference, Johannesburg, South Africa, October 2015.
[14] A. Schroeder, M. Renker, U. Aulenbacher, A. Murk, U. Boeniger, R. Oechslin, and P. Wellig, ‘Numerical and experimental radar cross section analysis of the quadcopter DJI Phantom 2’, 2015 IEEE Radar Conference, Johannesburg, RSA, October 2015.
[15] F. Fioranelli, M. Ritchie, H. Borrion, H. Griffiths, ‘Classification of Loaded/Unloaded Micro-Drones Using Multistatic Radar’, Electronics Letters, vol. 51(22), pp. 1813-1815, October 2015.
20 [16] T. E. Derham, S. Doughty, K. Woodbridge, and C. J. Baker, ‘Design and evaluation of a low-cost multistatic netted radar system’, IET Radar, Sonar & Navigation, vol. 1, pp. 362-368, 2007.
[17] Fisher, R.A., 'The use of multiple measurements in taxonomic problems', Annals of Eugenics, 7, (2), pp. 179-188, 1936.
[18] Hastie, T., Tibshirani, R., and Friedman, J., The Elements of Statistical Learning: Data Mining, Inference, and Prediction, (Second Edition), Springer, 2009.
[19] Ho, Tin Kam (1995). Random Decision Forests. Proceedings of the 3rd International Conference on Document Analysis and Recognition, Montreal, QC, 14–16 August 1995. pp. 278–282.
[20] Breiman, L., J. Friedman, R. Olshen, and C. Stone. Classification and Regression Trees. Boca Raton, FL: CRC Press, 1984.
[21] F. Fioranelli, M. Ritchie, and H. Griffiths, ‘Classification of unarmed/armed personnel using the NetRAD multistatic radar for micro-Doppler and Singular Value Decomposition features’, IEEE Geoscience and Remote Sensing Letters, Vol. 12, No.9, pp.1933-1937, September 2015.
[22] F. Fioranelli, M. Ritchie, and H. Griffiths, ‘Performance analysis of centroid and SVD features for personnel recognition using multistatic micro-Doppler’, IEEE Geoscience and Remote Sensing Letters, Vol. 13, No.5, pp.725-729, May 2016.
[23] A. Balleri, A. Al-Armaghany, H. Griffiths, K. Tong, T. Matsuura, T. Karasudani, Y. Ohya, ‘Measurements and analysis of the radar signature of a new wind turbine design at X-band’, IET Radar, Sonar & Navigation, vol. 7(2), pp. 170-177, 2013.