Performance estimation of a cooperative brain-computer
interface based on the detection of steady-state visual
evoked potentials
Hubert Cecotti, Bertrand Rivet
To cite this version:
Hubert Cecotti, Bertrand Rivet. Performance estimation of a cooperative bracomputer
in-terface based on the detection of steady-state visual evoked potentials. IEEE International
Conference on Acoustics, Speech, and Signal Processing (ICASSP 2014), May 2014, Florence,
Italy. Proceedings of ICASSP 2014, pp.2078-2082, 2014.
<
hal-00997854
>
HAL Id: hal-00997854
https://hal.archives-ouvertes.fr/hal-00997854
Submitted on 29 May 2014
HAL
is a multi-disciplinary open access
archive for the deposit and dissemination of
sci-entific research documents, whether they are
pub-lished or not.
The documents may come from
teaching and research institutions in France or
abroad, or from public or private research centers.
L’archive ouverte pluridisciplinaire
HAL, est
destin´
ee au d´
epˆ
ot et `
a la diffusion de documents
scientifiques de niveau recherche, publi´
es ou non,
´
emanant des ´
etablissements d’enseignement et de
recherche fran¸
cais ou ´
etrangers, des laboratoires
publics ou priv´
es.
PERFORMANCE ESTIMATION OF A COOPERATIVE BRAIN-COMPUTER INTERFACE
BASED ON THE DETECTION OF STEADY-STATE VISUAL EVOKED POTENTIALS
Hubert Cecotti
School of Computing and Intelligent Systems
Magee Campus, University of Ulster
Londonderry, UK
Bertrand Rivet
GIPSA-lab UMR5216
CNRS - Grenoble Universities
Saint Martin d’Heres, France
ABSTRACT
To be better suited for the expectations of healthy people, new brain-computer interface (BCI) paradigms should be proposed. To tackle this problem, we investigate the emerg-ing field of cooperative BCIs, which involves several users in a single BCI system. Because combining trials over time improves performance, combining trials across subjects can significantly improve performance compared to a single user. However, cooperative BCIs can only be used in particular settings, and new paradigms must be proposed to efficiently use this approach. To show the advantages of a cooperative BCI based on steady-state visual evoked potentials (SSVEP), we evaluate and compare the performance of combining deci-sions across subjects, and over time. By considering a reliable brain response such as SSVEP responses, this study repre-sents a first evolution for the combination, and the choice of the combination method for creating a cooperative SSVEP based BCI. The results suggest that six people would be enough to obtain a perfect accuracy within one second of EEG signal.
Index Terms— Brain-Computer Interface, Steady-State Visual Evoked Potentials, Cooperative BCI
1. INTRODUCTION
Pioneer works such as the P300 speller [1] have opened the research field of brain-computer interface (BCI). In the last decades, BCIs have always been used as a way to interact with different devices in relation to the subject’s will. The goal is typically to send commands to a computer, e.g.,spelling words [2], and in assistive technologies [3], where it is possi-ble to move a wheelchair or robot. Due to the low signal-to-noise ratio (SNR) in the electroencephalogram (EEG) signal, many strategies have been employed to increase the SNR by enhancing the signal through filtering or by combining sev-eral trials over time [4]. Whereas combining EEG signals over time has been used since the first P300 speller, where the stimuli appearing on the keys of the virtual keyboard are repeated several times, combining EEG signals across sub-jects has not been efficiently used in BCI until recently for
decreasing reaction time [5] and for 2-D pointer control with two users [6]. In this type of BCI, several users are impli-cated for enabling a command. In this study, we propose to evaluate the performance and the number of subjects that are needed for a BCI combining several users, and based on the detection of steady state visual evoked potentials, which is a robust brain response [7, 8, 9].
1.1. Combination strategies
The literature of multi-classifier systems offers a large choice of methods for combining the signals and/or the decisions from the different subjects [10, 11]. Increasing the number of subjects can have a different impact on the performance. By adding more subjects, it is possible to add subjects who have had bad performances: while their single performance does not allow them to use a BCI for a single user, their brain features can still contribute to the global performance. The choice of the combination strategy may depend on how pos-sible it is to find subjects that can complement each other, particularly for adaptive combination methods. In this study, we limit the applications to strategies for binary classification. LetOi denote the output value of a binary classifier for
subject i at a particular trial. Oi represents the confidence
value of assigning the input to one of the two classes. Six classical combination scores overNsub subjects are
consid-ered: the sum of the classifier outputs (Osum =P Nsub
i=1 Oi),
the weighted sum (Ow−sum = w0 + P
Nsub
i=1 wi · Oi),
the product (Oprod = Q Nsub
i=1 Oi), the maximum score
(Omax = max1≤i≤NsubOi), the minimum score (Omin =
min1≤i≤NsubOi), the majority voting (more than half of the
outputs agree for the decision), and the consensus vote (the decision should be the same for all the outputs).
The maximum score (Omax) and the minimum score
(Omin) are related to the notions of OR and AND in logic,
respectively. The maximum score bases its decision with the most relevant subject. On the contrary, the minimum score bases its decision with the less relevant subject (with the low-est individual score): all the subjects have to be relevant to provide a high combined score. In addition, the sum (Osum)
and weighted sum (Ow−sum) scores can be seen as smooth
or weighted OR, whereas the product score (Oprod) can be
considered as a smooth or weighted AND.
1.2. Performance evaluation
To show the relevance and the type of performance that can be expected by combining the decision from several individuals, we report the Area Under the ROC curve (AUC) [12] and the ITR [13] in bits per minute (bpm) defined byIT R= 60
T ·ϑ
where
ϑ =log2(Nout) +P log2(P) + (1−P)log2( 1−P Nout−1)(1)
andPbeing the probability of the good detection,i.e.the ac-curacy,Noutbeing the number of possible different outputs,
andT being the time in seconds of recorded EEG signal that is required to take the decision among theNoutoutputs.
2. EXPERIMENTAL PROTOCOL
SSVEP responses are not time locked to an event; an SSVEP response is evoked when the subject pays attention to a flick-ering visual stimulus. The efficiency of the classification of an SSVEP response depends on the time that is required to detect a response. A challenge is to reduce the time segment for the SSVEP response detection because it allows to decrease the required time for enabling a command. To qualify the effect of combining brain responses from several subjects, we eval-uated the effect of combining several subjects for improving SSVEP response detection with a time segment of 1s.
The experiment consisted of a visual task where 10 healthy subjects (age=27.2 ±2.4 years old, two females) were paying attention to a series of different flickering lights (6.66Hz, 7.50Hz, 8.57Hz, 10.00Hz and 12.00Hz) on a com-puter screen (diagonal size=15.4 inches, vertical refresh rate=60Hz, luminance=180.0cd/m2
, with an estimated con-trast of280 : 1). Subjects were sitting in a comfortable chair at about 60cm from the computer screen, in a non shielded room. Each stimulus had a luminance of about 0.46cd. The experiments were carried out sequentially. The order of the flickering boxes on which the subject had to pay attention was identical across subjects. In this study, we focused on the detection of a single flickering light that was at 7.50Hz. The EEG was recorded with a g.USBamp EEG amplifier from g.tec with a sampling rate of 128Hz. The electrodes were placed onAFZ for ground,CZ for the reference andP O3,
P O4,PZ,O9,O10, andOZ for the input electrodes.
3. SIGNAL PROCESSING AND CLASSIFICATION
An analog bandpass filter between 2 and 30Hz, and a notch filter around 50Hz (main frequency in Europe) were applied directly inside the amplifier during the EEG acquisition. For the classification, we consider the responses corresponding to
the following frequencies: 7.50Hz for the target class, and 6.66Hz, 8.57Hz, 10.00Hz and 12.00Hz, for the non-target class. The frequency corresponding to the target class also corresponds to the frequency of the flickering light. The fre-quencies for the non-target classes are used as frefre-quencies that should not be detected when the subject is looking at the flickering light corresponding to the target. The follow-ing method has been used for the detection of the SSVEP re-sponses [14, 15]. We consider a visual stimulation flickering atf Hz. The signalyi(t)as the voltage between the electrode
iand a reference electrode at a timetis considered as:
yi(t) = Nh X
k=1
ai,ksin(2πkft+ Φi,k) +bi,t (2)
whereNh is the number of considered harmonics. The
sig-nal is divided into two parts: the SSVEP response and the remaining EEG activity, which is considered as noise. The first part corresponds to the evoked SSVEP response signal, which is composed of a number of sinusoids with frequencies in relation to the stimulus frequency and a number ofNh
har-monic frequencies. Each sinusoid is defined by its amplitude and phase:ai,kandΦi,k.bi,t corresponds to the background
EEG activity. The detection of an SSVEP response on an EEG signal requires a time segment ofNt samples of EEG
signal, with a sampling frequency ofFsHz:
yi = Xfai+Bi (3)
whereyi = [yi(1), . . . , yi(Nt)]T contains the EEG signal for
theith
electrode in one time segment. The SSVEP model of the frequencyf,Xf, is contained in a matrixNt×2Nhdefined
by
Xf(t,2k−1) = sin(2πkft) (4)
Xf(t,2k) = cos(2πkft) (5)
with1 ≤ k ≤Nh. The vectorai of size2Nh contains the
amplitudes. ForNyelectrodes, the signal is defined as:
Y = XfAf+B (6)
whereY = [y1, . . . , yNy]contained the sampled EEG signals
from all the electrodes.Afcontains all the amplitudes for all
the expected sinusoids for every electrode signal related the the expected frequency to detect. Spatial filters are used to enhance the SSVEP response in the signal. A spatial filter is represented by a linear combination of the signals measured by different electrodes. We denote bys, a linear combination ofyi, the EEG after a spatial filter:
s =
Ny X
i=1
wiyi =Y w (7)
wherewi is the weight for theith electrode. Several
We noteNsas the number of channels. We first estimate the
background activity by removing the potential SSVEP com-ponents from the signal. It is achieved by projecting the signal onto the orthogonal complement of the SSVEP model matrix (X).
ˇ
Yf =Y −Xf(XfTXf)−
1
XfTY (8)
Spatial filtersWˆfthat maximize the Signal-to-Noise Ratio are
obtained though determining the generalized Rayleigh quo-tient that maximizes the following expression:
ˆ Wf = argmaxW T r(W T YTY W) T r(WTYˇf T ˇ YfW) (9)
We denote byYˆf =XfTYWˆf the signal after spatial filtering.
The power of the expected frequencies and their harmonics are calculated for theNs components. For each frequency,
the evaluation of the SSVEP response is defined by:
R(f) = 1 Ns·Nh Ns X i=1 Nh X k=1 ˆ Yf(i,2k−1) 2 + ˆYf(i,2k) 2 (10)
In the experiment, Ns = 6andNh = 3, the detection of
an SSVEP response is performed by selecting the frequency with the maximum associated valueR(f). The database con-tained 713 trials for each subject (238 for target: when the subjects paid attention to the flickering light at 7.50Hz, 475 for non-target: when the subjects paid attention to other flick-ering lights).
4. RESULTS
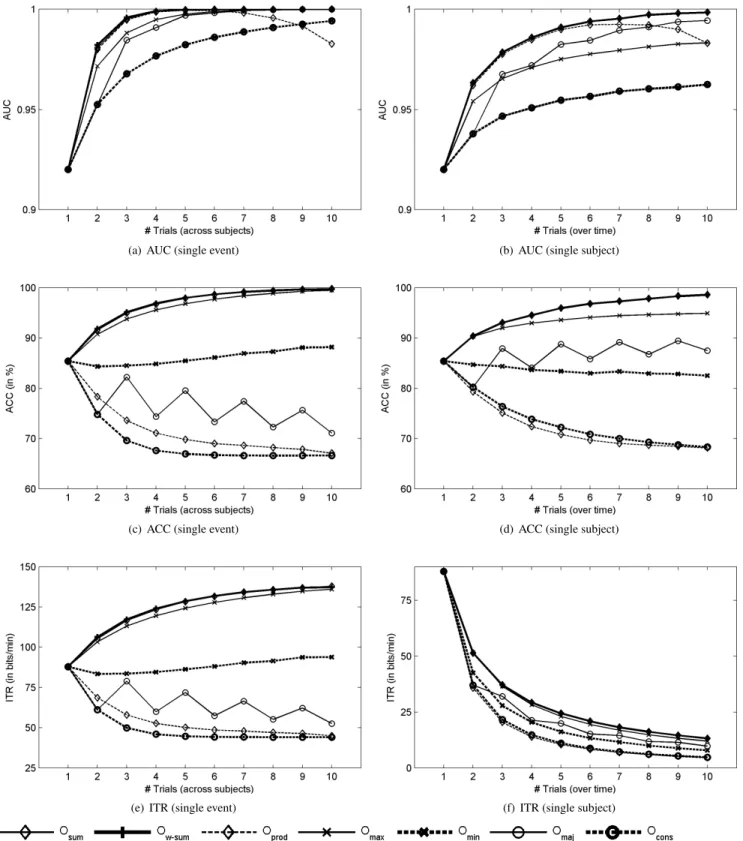
The performances for combining classification results across subjects or across trials are estimated by the AUC, the classi-fication accuracy and the ITR. They are depicted in Figure 1, which represents the mean AUC, accuracy and ITR across all the possible combinations ofnsubjects (Fig. 1(a), 1(c), 1(e)), and across all the possible combinations ofntrials from the same subject (Fig. 1(b), 1(d), 1(f)). For single-event detec-tion, the mean AUC across subjects is0.920±0.079. The re-sults show that combining trials across subjects can improve the AUC. With the sum combined score (Osum), the AUC
increases from about0.92with a single subject to a perfect detection with eight subjects. Yet, the AUC achieved with the product and minimum scores do not monotonically increase with the number of subjects: there is a maximum AUC with about four subjects. These combined scores require that all the individual scores are relatively high to achieve a good de-tection while increasing the number of subjects reduces this probability.
Performance curves present the same behavior depending on the number of combined scores between the evolution of the AUC as a function of the number of subjects (Fig. 1(a)),
and as a function of the number of trials (Fig. 1(b)). For the combination of trials from the same subject and the combi-nation of trials from different subjects, the accuracy starts at about 85.41±7.6% with a single-trial, and increases sub-linearly until around 99.7±0.27% with ten trials and the methodsOsum andOw−sum. Figure 1(e) shows the
theo-retical ITR as a function of the number of subjects that are in-volved in the decision withNout = 5. The best performance
is obtained with the sum method with an ITR of137.93±1.36
bpm. The ITR was estimated based on the choice between five commands and a time of1sfor the selection of a com-mand (T = 1s). The same way that the AUC increases with the number of involved subjects, the ITR also increases for most of the combination methods. The increase of the AUC is directly reflected on the ITR (Fig. 1(e)), while it is not the case when combining trials over time (Fig. 1(f)). The evo-lution of the performance indicates a continuous increase of performance with the addition of new subjects. With only two subjects, it is possible to obtain a performance that is reliable enough for single-event detection.
5. DISCUSSION AND CONCLUSION
Cooperative BCIs involve the creation of new paradigms to be used online. SSVEP-BCIs are known as being fast and reli-able compared to other BCIs [16, 17, 18]. To further improve the performance, we have shown that it was possible to sig-nificantly increase the ITR with simple combination methods by considering the detection of SSVEP responses occurring on a group of six subjects. With cooperative BCIs, it would be more efficient to have several users with relatively cheap systems with few sensors, than to have a single user with a very expensive system,e.g.,with 32 channels. A cooperative BCI system should ideally require six persons to provide opti-mal results in the case of SSVEP based BCI. Therefore, each subject should wear an EEG cap and have a personal ampli-fier. By considering the EEG signals from different users, one issue could be the synchronization the different EEG signals coming from each user. However, with a system based on the detection of SSVEP response based only on the frequency of the stimuli, a jitter would not be an obstacle if the phase is not used [19].
We have shown that combining trials across subjects can be advantageously used in particular BCI applications. Co-operative BCIs represent a fundamental new approach com-pared to current BCI because the user does not interact in-dependently, but he interacts with other people who share the same goal. Moreover, the performance does not depend on a single user, but on the group of users. This promising approach could be successfully implemented in cooperative video games or in other applications involving several peo-ple.
(a) AUC (single event) (b) AUC (single subject)
(c) ACC (single event) (d) ACC (single subject)
(e) ITR (single event) (f) ITR (single subject)
Fig. 1. SSVEP response detection results based on the AUC, the accuracy (ACC), and ITR. Figures 1(a) and 1(b): AUC for single-event detection as a function of the number of subjects and AUC for a single subject as a function of the number of trials, respectively. Figures 1(c) and 1(d): Accuracy for single-event detection as a function of the number of subjects and accuracy for a single subject as a function of the number of trials, respectively. Figures 1(e) and 1(f): theoretical ITR as a function of the number of subjects and the number of trials, respectively.
6. REFERENCES
[1] L. Farwell and E. Donchin, “Talking off the top of your head: toward a mental prosthesis utilizing event-related brain potentials,”Electroencephalogr. Clin. Neurophys-iol., vol. 70, pp. 510–523, 1988.
[2] H. Cecotti, “Spelling with non-invasive brain-computer interfaces - current and future trends,” J. Physiology-Paris, vol. 105, no. 1-3, pp. 106–114, 2011.
[3] J. d. R. Mill´an, R. Rupp, G. R. M¨uller-Putz, R. Murray-Smith, C. Giugliemma, M. Tangermann, C. Vidau-rre, F. Cincotti, A. K¨ubler, R. Leeb, C. Neuper, K.-R. M¨uller, and D. Mattia, “Combining braincomputer in-terfaces and assistive technologies: state-of-the-art and challenges,” Frontiers in Neuroscience, vol. 4, no. 161, pp. 1–15, 2010.
[4] G. Townsend, B. K. LaPallo, C. B. Boulay, D. J. Krusienski, G. E. Frye, C. K. Hauser, N. E. Schwartz, T. M. Vaughan, J. R. Wolpaw, and E. W. Sellers, “A novel P300-based brain-computer interface stimu-lus presentation paradigm: Moving beyond rows and columns,”Clinical Neurophysiology, 2010.
[5] Peng Yuan, Yijun Wang, Wei Wu, Honglai Xu, Xi-aorong Gao, and Shangkai Gao, “Study on an online collaborative BCI to accelerate response to visual tar-gets,” Proc. 34th Int. IEEE EMBS Conf., pp. 1–4, 2012. [6] R. Poli, C. Cinel, A. Matran-Fernandez, F. Sepulveda, and A. Stoica, “Some steps towards realtime control of a space-craft simulator via a brain-computer interface,”
Technical report CES-525, University of Essex., pp. 1– 23, 2012.
[7] E. Lyskov, V. Ponomarev, M. Sandstrom, K.H. Mild, and S. Medvedev, “Steady-state visual evoked poten-tial to computer monitor flicker,” Int. J. Psychophysiol, vol. 28, pp. 285–290, 1998.
[8] F. Vialatte, M. Maurice, J. Dauwels, and A. Cichocki, “Steady-state visually evoked potentials: focus on es-sential paradigms and future perspectives,”Prog Neuro-biol., vol. 90, no. 4, pp. 418–438, 2010.
[9] Y. T. Wang, Y. Wang, and T. P. Jung, “Measuring steady-state visual evoked potentials from non-hair-bearing ar-eas,”Proc. 34th Int. IEEE EMBS Conf., pp. 1806–1809, 2012.
[10] Ludmila I. Kuncheva, Combining Pattern Classifiers: Methods and Algorithms, Wiley, 2004.
[11] Giorgio Fumera and Fabio Roli, “Performance analy-sis and comparison of linear combiners for classifier fu-sion,” Proc. of the Joint IAPR International Workshop
on Structural, Syntactic, and Statistical Pattern Recog-nition, pp. 424–432, 2002.
[12] Tom Fawcett, “An introduction to ROC analysis,” Pat-tern Recognition Letters, vol. 27, pp. 861–874, 2006. [13] C. E. Shannon and W. Weaver, “The mathematical
the-ory of communication,” Urbana, IL: University of Illi-nois Press, 1964.
[14] H Cecotti and B. Rivet, “Effect of the visual signal struc-ture on steady-state visual evoked potentials detection,”
International Conference on Acoustics, Speech, and Sig-nal Processing (ICASSP), pp. 657–660, 2011.
[15] O. Friman, I. Volosyak, and A. Gr¨aser, “Multiple chan-nel detection of steady-state visual evoked potentials for brain-computer interfaces,” IEEE Trans. Biomed. Eng., vol. 54, no. 4, pp. 742–750, 2007.
[16] X. R. Gao, D. F. Xu, M. Cheng, and S. K. Gao, “A BCI based environmental controller for the motion-disabled,” IEEE Trans. Rehab. Eng., vol. 11, no. 2, pp. 137–140, 2003.
[17] G. Bin, X. Gao, Z Yan, B. Hong, and S. K. Gao, “An online multi-channel SSVEP-based braincomputer in-terface using a canonical correlation analysis method,”
Journal of Neural Engineering, vol. 6, 2009.
[18] H. Cecotti, “A self-paced and calibration-less SSVEP based brain-computer interface speller,”IEEE Trans. on Neural Systems and Rehab. Eng., vol. 18, pp. 127–133, 2010.
[19] G. Garcia, “Detection of high-frequency steady state vi-sual evoked potentials using phase rectified reconstruc-tion,” Proc. of the 16th European Signal Processing Conference, 2008.