Institutional Repository
Cost eciency in the
Chinese banking sector: a
comparison of parametric
and non-parametric
methodologies
This item was submitted to Loughborough University's Institutional Repository by the/an author.
Additional Information:
• A Doctoral Thesis. Submitted in partial fulllment of the requirements for the award of Doctor of Philosophy of Loughborough University. Metadata Record: https://dspace.lboro.ac.uk/2134/6099
Publisher: cYizhe Dong Please cite the published version.
This item was submitted to Loughborough’s Institutional Repository (https://dspace.lboro.ac.uk/) by the author and is made available under the
following Creative Commons Licence conditions.
For the full text of this licence, please go to:
Cost Efficiency in the Chinese Banking Sector: A
Comparison of Parametric and Non-parametric
Methodologies
by
Yizhe Dong
A Doctoral Thesis
Submitted in Partial Fulfilment of the Requirements for the Award of
Doctor of Philosophy of Loughborough University
Table of Contents ... i
Abstract ... iv
List of Tables ... vi
List of Figures ... viii
Abbreviations ... ix
Acknowledgments ... xii
Chapter 1 Introduction ... 1
1.1 Introduction ... 1
1.2 Objectives and Motives of the Thesis ... 2
1.3 Research Methodology and Data ... 4
1.4 Structure of the Thesis ... 5
Chapter 2 Efficiency: Meaning, Theory and Measurement ... 9
2.1 Introduction ... 9
2.2 Conventional and Frontier Efficiency Approach ... 10
2.3 The Framework of Efficiency ... 11
2.3.1 Technical, Allocative and Cost Efficiency ... 11
2.3.2 Economies of Scale ... 14
2.3.3 Pure Technical and Scale Efficiency ... 15
2.3.4 Economies of Scope ... 16
2.4 The Economic Theory and Causes of Inefficiency ... 17
2.4.1 Conventional Neoclassical Theory of the Firm ... 18
2.4.2 The Managerial Theories of the Firm ... 19
2.4.3 The Behavioural Theories of the Firm ... 21
2.4.4 The X-efficiency Theory of the Firm ... 22
2.5 The Measurement of Efficiency ... 23
2.5.1 Data Envelopment Analysis ... 24
2.5.2 Free Disposal Hull ... 32
2.5.3 Functional Form for the Parametric Methods ... 33
2.5.4 Stochastic Frontier Analysis ... 36
2.5.5 Distribution Free Approach ... 38
2.5.6 Thick Frontier Approach ... 39
2.5.7 Is There A ‘Best’ Frontier Method? ... 40
2.6 Summary and Conclusion ... 41
Chapter 3 Empirical Studies of Bank Efficiency ... 43
3.1 Introduction ... 43
3.5 The Determinants of Bank Efficiency ... 67
3.5.1 The Impact of Ownership Structure on Efficiency ... 68
3.5.2 The Impact of Deregulation on Efficiency ... 72
3.5.3 The Impact of Market Structure on Efficiency ... 75
3.5.4 The Impact of Size on Efficiency ... 78
3.5.5 The Impact of Market Discipline on Efficiency ... 79
3.6 Summary and Conclusion ... 80
Chapter 4 China’s Banking System and Reforms ... 82
4.1 Introduction ... 82
4.2 The Structure of China’s Banking Sector ... 82
4.2.1 The Banking Authority ... 84
4.2.2 Five Large-scale Commercial Banks ... 85
4.2.3 Policy Banks ... 88
4.2.4 Joint-stock Commercial Banks ... 89
4.2.5 City Commercial Banks ... 92
4.2.6 Rural and Unban Credit Cooperatives ... 94
4.2.7 Foreign Banks ... 94
4.2.8 Non-banking Financial Institutions: ... 96
4.3 China’s Banking Reform ... 96
4.3.1 China’s Banking Reform before 1994 ... 96
4.3.2 China’s Banking Reform between 1994 and 2001 ... 99
4.3.3 Chinese Banking Reform after WTO Entry ... 107
4.4 Summary and Conclusion ... 117
Chapter 5 Methodology ... 120
5.1 Introduction ... 120
5.2 The Stochastic Cost Frontier Function ... 121
5.3 Empirical Specification for SFA ... 130
5.3.1 Inputs and Outputs Variables ... 130
5.3.2 Control Variables ... 132
5.3.3 Environmental Variables ... 134
5.3.4 Specification of Cost Function Models ... 138
5.3.5 Estimation of Scale Economies ... 143
5.4 Utilising DEA to Measure Cost Efficiency ... 144
5.4.1 Traditional Cost DEA ... 144
5.4.2 New Cost DEA ... 146
5.4.3 Second Stage Regression ... 148
5.5 Comparison of SFA and DEA ... 149
5.6 Data ... 150
6.2 Cost Frontier Estimates ... 160
6.3 Key Estimation Results ... 165
6.4 Model Specification Tests ... 167
6.5 Efficiency Level ... 174
6.6 Spearman’s Correlation for Different SFA Models ... 175
6.7 Comparison between SFA and DEA ... 177
6.7.1 Comparison of Efficiency Distributions ... 178
6.7.2 Rank Order Correlation of Efficiency Scores ... 180
6.7.3 Identification of Best Practice and Worst Practice Banks ... 181
6.7.4 Stability of Measured Efficiency Over Time ... 182
6.7.5 Efficiency and Accounting-based Performance Measures ... 184
6.8 Summary and Conclusion ... 185
Chapter 7 Chinese Banking Efficiency and Analysis ... 188
7.1 Introduction ... 188
7.2 Cost Efficiency Based on SFA ... 189
7.3 Cost Efficiency Based on DEA ... 197
7.4 Economies of Scale ... 202
7.5 Determinants of Cost Efficiency ... 206
7.5.1 Effect of Ownership on Efficiency ... 208
7.5.2 Effect of Bank Size on Efficiency ... 210
7.5.3 Effect of Market Discipline on Efficiency ... 211
7.5.4 Effect of Deregulation on Efficiency ... 212
7.5.5 Effect of Market Structure on Efficiency ... 214
7.6 Summary and Conclusion ... 215
Chapter 8 Conclusion and Limitations ... 218
8.1 Introduction and Summary of Findings ... 218
8.2 Policy Implications... 223
8.3 Limitations of the Study and Future Research ... 225
Bibliography ... 228
Appendix 1 ... 274
Since the open door policy was embarked upon in 1979, China’s banking sector has undergone gradual but notable reforms. A key objective of the reforms implemented by the Chinese government is to build an effective, competitive and stable banking system in order to improve its efficiency and reliability. This study employs both parametric stochastic frontier analysis (SFA) and non-parametric data envelopment analysis (DEA) methods to assess and evaluate the cost efficiency of Chinese banks over the period from 1994 until 2007, a period characterised by far-reaching changes brought about by the banking reforms. To this end, we first compare a number of specifications of stochastic cost frontier models to determine the preferred frontier model which are adopted in our efficiency analysis. The preferred model specification for our sample is the one stage SFA model that includes the traditional input prices, the outputs and the control variables (that is, equity, non-performing loans and the time trend) in the cost frontier and the environmental variables (that is, ownership structure, size, deregulation, market structure and market discipline) in the inefficiency term. Moreover, we also employ two cost DEA models (traditional DEA and New DEA) as a complement to the preferred SFA model for methodological cross-checking purposes. Similar to the previous empirical literature, we find that in most cases only moderate consistency across the different techniques.
The cost efficiency of Chinese banks is found to be 91% on average, based on our SFA model, over the period from 1994 until 2007. Based on the results of the DEA and New DEA models, the average cost efficiency for Chinese banks over the sample period is about 89% and 87%, respectively. We find that Chinese banking efficiency has deteriorated after China’s admission to the WTO, suggesting that the significant external environmental changes which arose from China’s WTO entry may have had a negative impact on its banking efficiency. In addition, we find that the majority of Chinese
increasing, to constant, and then to decreasing returns to scale.
Our findings also show that both state-owned banks and foreign banks are more efficient than domestic private banks and larger banks tend to be relatively more efficient than smaller banks. These and other results suggest that in order to enhance Chinese banking efficiency, the government needs to continue with the banking reform process and in particular, to open up banking markets, to improve risk management and corporate governance in Chinese banks and to encourage the expansion of banks.
Keywords: Cost efficiency, Stochastic Frontier Analysis, Data Envelopment Analysis, Chinese Banking Reform.
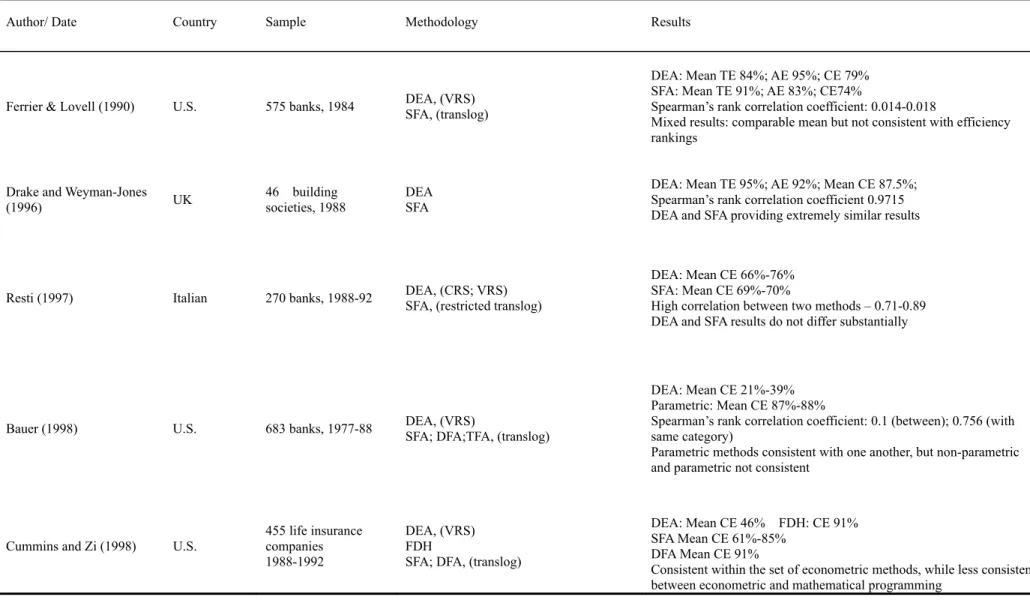
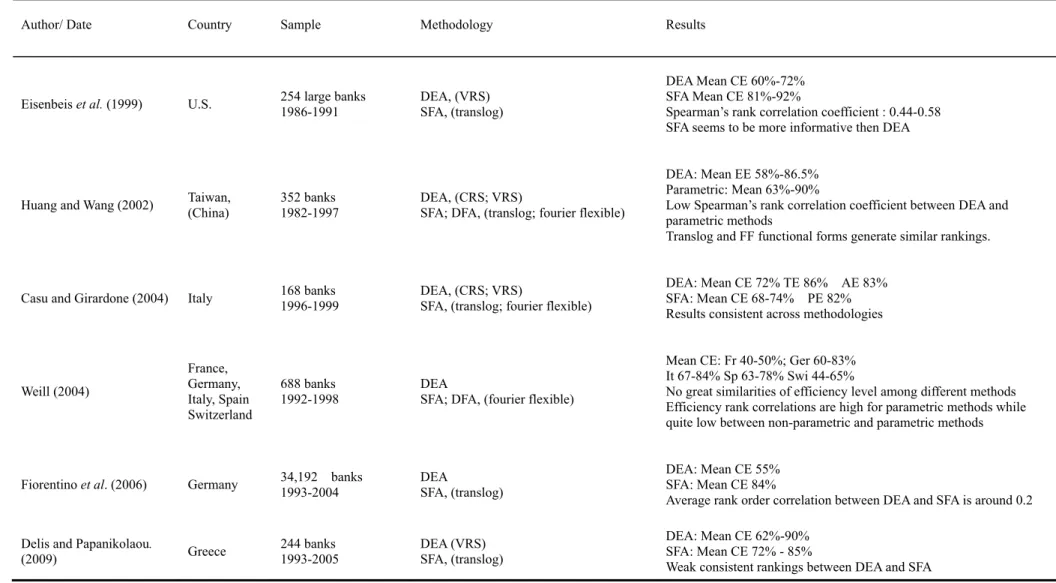
Table 3.1 Summary of the Frontier Efficiency Technique Comparisons ... 52
Table 3.2 Bank Efficiency Studies in Transition and Developing Countries ... 58
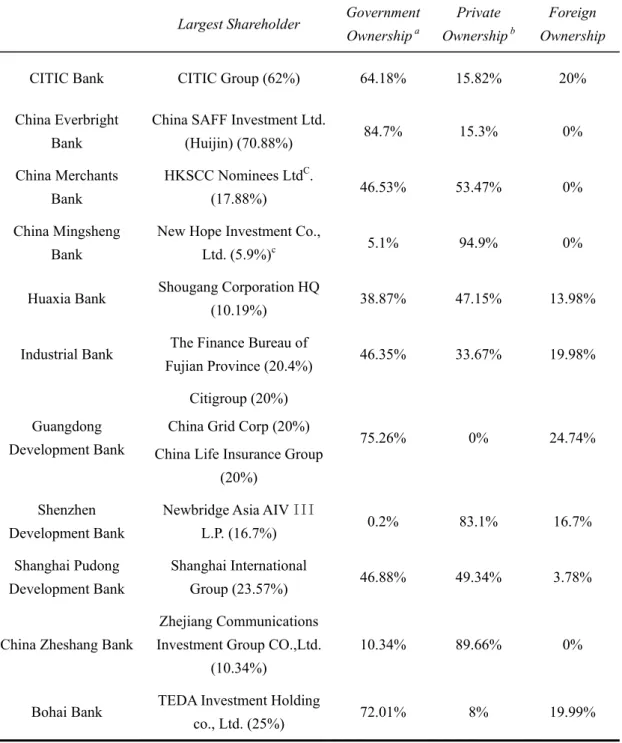
Table 4.1 Ownership Structure of JSCBs (2007) ... 92
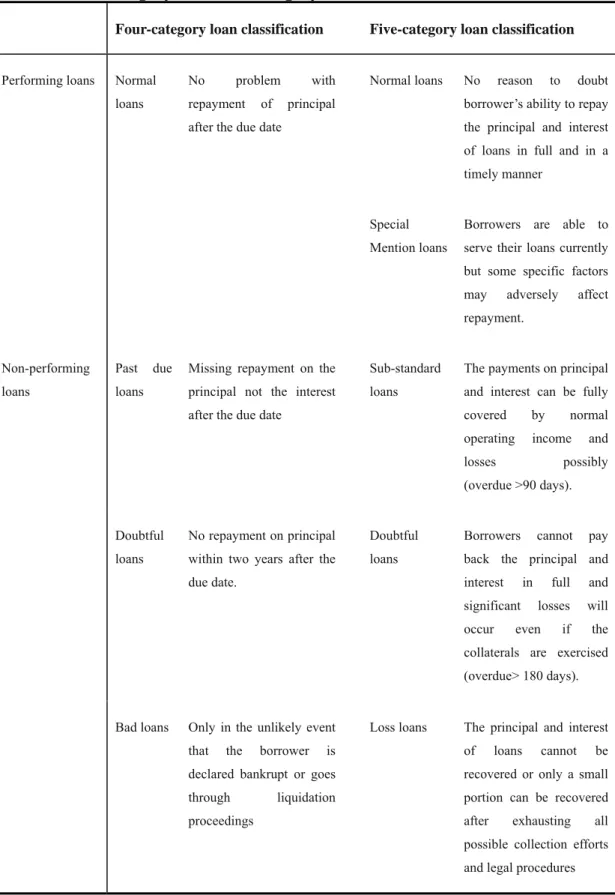
Table 4.2 Four Category and Five Category Loan Classification ... 102
Table 4.3 NPLs Disposals at State-owned Banks ... 104
Table 4.4 Interest Rate Liberalisation Process between 1993 and 2001 ... 105
Table 4.5 Opening of China’s Banking Sector (2001-2006) ... 108
Table 4.6 SOCB’s Capital Injections and Disposal of NPLs since 2003 ... 111
Table 4.7 Financial Restructuring in SOCBs ... 112
Table 4.8 Foreign Investments in Chinese Banks (up to 2007) ... 114
Table 4.9 Publicly Listed Banks since 2005 ... 117
Table 5.1 SFA Model Specifications ... 129
Table 5.2 Descriptive Statistics of Input Price and Output Variables Unit: million RMB ... 154
Table 5.3 Descriptive Statistics of the Bank’s Control and Environmental Variables ... 156
Table 6.1 Maximum Likelihood Parameter Estimates for Stochastic Frontier Cost Functions ... 162
Table 6.2 Key Estimation Results ... 166
Table 6.3 Hypothesis Testing of Cost Function ... 172
Table 6.4 Summary Statistics of the Mean Efficiency Estimates ... 174
Table 6.5 Spearman Rank Correlation between Efficiency Estimates ... 176
Table 6.6 Descriptive Statistics of Cost Efficiency Scores by Different Techniques 179 Table 6.7 Spearman’s Rank Order Correlation by Various Methods ... 181
Table 6.8 Correspondence of Best-practice and Worst-practice Banks across Techniques ... 182
Table 6.9 Persistence of Efficiency – the Correlations of k-year-apart Efficiencies . 183 Table 6.10 Correlations between Frontier Efficiencies and Non-frontier Performance Measures ... 184
Table 7.1 Average Efficiency Scores for Chinese Banks on Basis of SFA ... 189
Table 7.4 Average Cost Efficiency Scores for Chinese Banks on Basis of DEA ... 198
Table 7.5 Average DEA Cost Efficiency Scores by Different Bank Types ... 200
Table 7.6 Average DEA Cost Efficiency Scores by Size Classes ... 202
Table 7.7 Overall Economies of Scale for Chinese Banks on Basis of SFA ... 204
Table 7.8 Returns to Scale of Chinese Banks on the Basis of DEA ... 206
Figure 2.1 Technical, Allocative and Cost Efficiency ... 12
Figure 2.2 Cost Curves and Economies of Scale ... 15
Figure 2.3 Pure Technical and Scale Efficiency... 16
Figure 2.4 Free Disposal Hull (FDH) ... 33
Figure 4.1 Total Assets of China’s Banking Sector (2003-2007) ... 84
Figure 4.2 Market Share by Assets of Chinese Banking Institutions, 2007 ... 84
Figure 4.3 Total Assets and Market Share for Foreign Banks (2001-2007) ... 95
Figure 6.1 Average Efficiency Scores over Time ... 175
Figure 6.2 Average Efficiency Over Time for Different Models ... 179
Figure 7.1 Average SFA Cost Efficiency Scores for Chinese Banks (1994-2007) .... 190
Figure 7.2 Average SFA Cost Efficiency by Different Bank Types ... 193
Figure 7.3 Average Traditional and New Cost Efficiency Measures over Time ... 199
Figure 7.4 Average Traditional DEA Cost Efficiency by Bank Types ... 201
ABC ADBC AE AMC Basel I Basel II BIS BOC BOCOM CAR CBRC CCB CCB CDB CE CITIC COLS CR CRS DEA DFA DMU EXIM FDH FF GDP
Agricultural Bank of China
Agricultural Development Bank of China Allocative efficiency
Asset management company Basel Capital Accord of 1998 New Basel Capital Accord (2004) Bank for International Settlements Bank of China
Bank of Communications Capital adequacy ratio
China Banking Regulatory Commission City commercial Bank
China Construction Bank China Development Bank Cost efficiency
Chinese International Trust and Investment Corporation Corrected ordinary least squares
Concentration ratio Constant returns to scale Data envelopment analysis Distribution free approach Decision making unit Export-Import Bank Free disposal hull Fourier-flexible
HSBC HHI ICBC IMF JSCB LAC LR MES ML NIRS NPL OLS PBC PTE RCC RMB ROA ROAA ROAE ROE SAC SAFE SE SFA SME SOB SOCB SOE
Hong Kong and Shanghai Banking Corporation Herfindahl-Hirschman index
Industrial and Commercial Bank of China International Monetary Fund
Joint-stock commercial bank Long-run average cost curve Log likelihood ratio
Minimum efficient scale Maximum likelihood
Non-increasing return to scale Non-performing loan
Ordinary least squares People’s Bank of China Pure technical efficiency Rural credit cooperatives Renmingbi
Return on total assets Return on Average Assets Return on Average Equity Return on equity
Short-run average cost curve
State Administration of Foreign Exchange Scale efficiency
Stochastic frontier analysis Small and medium enterprises State-owned bank
State-owned commercial bank State-owned enterprise
TC TE TFA UCC VRS WTO Total costs Technical efficiency Thick frontier approach Urban credit cooperative Variable return to scale World Trade Organisation
I would like to express my deepest gratitude to my supervisor, Professor Mark Tippett, for his excellent guidance and supervision and unconditional support, which were crucial in completing this thesis. His support and encouragement are not only in academics but also in my daily life. He also made a lot of effort in checking my writing. Because of him, my awful writing in this thesis is still readable. He has set an example as a supervisor, a teacher, an academician, and a person whose character I will aspire to follow.
I would like to thank my Director of Research, Professor Barry Howcroft, and the independent panel member Dr. Robert Hamilton, for their help and useful comments and for their continuous encouragement and assistance during my research studies. I would like to appreciate Professor Tom Weyman-Jones, for his great assistance and support in explaining a number of technical issues related to my research work.
The support provided by the staff of the China Banking Regulatory Commission is also gratefully acknowledged.
I would also like to extend my gratitude to my dearest friends and colleagues, Meimei ,Waleed, Lan, Weiwei, Xiaozheng, Linna, Aloysius, Lei, Jie, Jia, Zhengwen, Ting, Qianzheng and Maomao, for their friendship, encouragement and support. Because of them, I did not feel lonely when I was struggling with my Ph.D. study. I also learn a lot from them. During my time in the doctoral program, there are so many friends that I want to mention individually, but I can’t because of the space limitations. They have my true appreciation.
encouragement during the last three years and the years to come.
Last but not least, I want to express my deep and sincere gratitude to my parents, who spent their lives paving the way to educate me in a right way, and to whom I dedicate this thesis. I want to thank them for their endless support and infinite sacrifices that made it possible for me to reach this stage of my life without them the road to success would have been much more difficult. I also take this opportunity to express my gratitude to other family members, for their support, love and kindness.
Chapter 1
Introduction
1.1
Introduction
Financial sectors throughout the world have witnessed significant developments over the last thirty years. The change of the environment in which banks operate has had substantial implications for the economic role of banks and their business activities. Deregulation, globalisation, financial innovation and technological progress have gradually reduced the costs of information processing and transmission and have been major forces impacting on the performance of the international banking sector (Girardone, et al, 2004). However, banking systems in developing countries have traditionally been considered as prone to relatively high levels of government control and excessive government intervention and this in turn has inhibited competition and the efficient allocation of resources. Bank performance in developing countries has been relatively poor because of this. Fortunately, in many developing countries regulators and government instrumentalities have gradually become aware of the role banking deregulation plays in promoting competition and efficiency and have therefore implemented a number of reforms which aim to create an effective, competitive, and stable banking sector.
The reforms to the Chinese economic system which began in 1979, have the aim of moving the country from a “planned economy supplemented with some market elements” to a “socialist market economy”. As a part of these national economic reforms, the Chinese government has also liberalised and deregulated the operations of the Chinese banking sector. The liberalisation and deregulation programme applied to the Chinese banking sector includes amongst other things: establishing a two-tier banking system, separating so-called policy lending from commercial lending, removing the credit ceiling on deposits and loans, reducing the systemic risk of the banking sector, gradually privatising state-owned banks, encouraging state-owned banks to seek listing on the stock exchange and relaxing foreign bank entry into the local
market. An officially-stated objective of the liberalisation and deregulation programme is to enhance the efficiency and productivity levels of the Chinese banking sector. Therefore, it is important to investigate the efficiency levels of Chinese banks over the reform period. Assessing the effects of the liberalisation and deregulation programme on Chinese banking efficiency will assist government instrumentalities and banking regulators in policy choice and will also enable bank management to improve the way in which they allocate resources across the various investment opportunities available to them. With this in mind, we outline the objectives of the present study.
1.2
Objectives and Motives of the Thesis
Despite the large empirical literature which exists on the efficiency of the North American and European banking systems and the gradually increasing empirical evidence pertaining to developing countries, only a few empirical studies have been undertaken which investigate efficiency levels in the Chinese banking sector. Therefore, a principal aim of this study is to assess and evaluate the cost efficiency of the Chinese banking sector using both stochastic frontier analysis (SFA) and data envelopment analysis (DEA). We also explore the key determinants of Chinese banking efficiency and provide evidence about the consistency or otherwise of the two efficiency frontier approaches (SFA and DEA) employed in our empirical analysis. In particular, this study seeks inter alia to address the following questions:
1 Is accounting for heterogeneity across banks important for the SFA methodology?
2 Do the SFA and DEA methods provide consistent results?
3 What is the general level of cost efficiency of the Chinese banking sector and how has it varied over time?
4 Have the banking reforms implemented by the Chinese government improved
Chinese banking efficiency?
5 Does cost efficiency vary across different bank types and size categories?
7 Do returns to scale (economies of scale) differ across bank size categories? 8 What are the main determinates of Chinese banking efficiency?
Our study of Chinese banking efficiency is important for a number of reasons. First, to the best of our knowledge, this is the first study to apply both parametric (SFA) and nonparametric (DEA) frontier techniques in the context of Chinese banking efficiency. The choice of which frontier method to use is often dependent on which is seen as the easiest to implement; seldom are any rational arguments given or any optimal criteria specified to justify the chosen frontier method. Given this, we make comparisons between the results from the various frontier methods in order to make assessments about the robustness of the estimated cost efficiency scores obtained from our empirical analysis of Chinese banks. Moreover, to the best of our knowledge this is the first empirical study to estimate banking efficiency using the New DEA model developed by Tone (2002). Second, estimates of banking efficiency can be biased if bank heterogeneity (e.g. output quality, size, ownership structure, etc.) is ignored (Mester, 1997). However, to our knowledge, this is the first study to provide exhaustive empirical evidence on the effects of heterogeneity on Chinese banking efficiency levels. In other words we endeavour to fill an important gap in the literature by comparing a number of well-established stochastic cost frontier specifications which attempt to account for bank heterogeneity in different ways.
Third, this research contributes to the existing Chinese banking efficiency literature by providing the most recent and comprehensive evidence on the impact of the Chinese government’s reform programme on the efficiency of the Chinese banking sector. The sample period investigated by previous Chinese bank studies, as we shall see in Chapter 3, is generally not long enough to shed much light on the impact of the Chinese government’s banking reform programme. In contrast, this study uses a longer sample period (fourteen years) which covers both the second phase of banking reform (1994 -2001) and the third phase of banking reform (2002-2007). Fourth, the existing empirical literature does not provide clear and robust results with respect to the main determinants of Chinese banking efficiency. Hence, this study investigates the impact of the potential determinants of Chinese banking efficiency, such as ownership structure,
size, deregulation, market structure and market discipline - using both the one stage SFA procedure and the two stage DEA procedure. The findings provide important insights into both policy issues and the efficiency with which bank management use the resources available to them.
1.3
Research Methodology and Data
In this study, we use both parametric (SFA) and non-parametric (DEA) frontier methodologies to measure the efficiency of Chinese banks. In order to better estimate the cost efficiency levels of Chinese banks, we employ the so called one stage SFA model and then compare the empirical results we obtain from with four alternative stochastic cost frontier models. This one stage SFA model allows us to simultaneously account for some heterogeneity factors (e.g. the level of equity on issue, asset quality, etc.) which may have an impact cost efficiency frontier and to estimate the effect of a set of environmental variables (e.g. ownership structure, size, deregulation, etc.) on bank efficiency levels. The translog functional form is used to estimate the underlying cost function. Moreover, we also employ two DEA cost efficiency models as a complement to the preferred one stage SFA model to measure Chinese bank efficiency and then we use a variety of methodological cross-checking mechanisms in order to assess the robustness of the results obtained. In addition, in order to investigate the key determinants of Chinese banking efficiency, we employ the so-called two stage DEA procedure. More specifically, we use a Tobit regression model which regresses the efficiency scores obtained from the DEA models on a number of environmental variables such as ownership structure, size, market structure, etc.
Our sample is an unbalanced panel which consists of 41 Chinese banks over the period from 1994 to 2007 and totals 397 observations. The sample comprises the big four state-owned banks, three policy banks, twelve national and regional joint-stock banks, sixteen city commercial banks and six foreign banks. The data are mainly obtained from the Almanac of China’s Finance and Banking (1994-2007) and BankScope. Additional data and double checks are made from other data sources, such as individual banks’ statutory annual financial reports, the China Banking Regulatory Commission’s
database and the China Statistical Yearbook, etc.
1.4
Structure of the Thesis
Our study is organised into eight chapters as fellows:
Chapter 2: Efficiency: Meaning, Theory and Measurement
This chapter first introduces the theoretical framework related to productive efficiency. Efficiency measures deviations in performance from the predicted performance of the “best practice” firms on the efficient frontier. The main types of efficiency include technical efficiency, allocative efficiency, scale efficiency and economic efficiency. Then we briefly discuss various theories of the firm. The traditional neoclassical theory of the firm views the firm as a rational entity which seeks to maximise profit. It seeks to explain how the market works but other than this treats the firm as a black box which transforms resources into saleable goods. The managerial theories of the firm, the behavioural theory of the firm and the X-efficiency theory of the firm highlight the possibility of internal inefficiency in the decision making processes of the firm and can explain why firms may not always operate efficiently. This chapter also reviews the parametric and non-parametric frontier techniques which enable one to estimate the efficiency frontier levels of firms and measure the efficiency of a firm relative to the other firms in the same industry.
Chapter 3: Empirical Studies of Bank Efficiency
This chapter provides a review of the literature on international banking efficiency. It first draws attention to empirical bank efficiency studies which employ two or more frontier approaches using a common set of data for the estimation and assessment of efficiency levels. Here it is important to note that there is no consensus about the existence of a single best frontier approach for measuring efficiency. Rather, the prevailing view is that methodological cross-checking is highly recommended in order to check for consistency across the various frontier approaches. This chapter also reviews empirical studies dealing with the efficiency of the Chinese banking sector as well as other developing countries. These studies mainly focus on investigating the
impact of deregulation and ownership structure on bank efficiency levels. Finally, this chapter also surveys empirical findings on the impact of ownership structure, size, deregulation, market structure and market discipline on the efficiency levels of banks. These factors are generally considered as the key determinants of banking efficiency.
Chapter 4: China’s Banking System and Reforms
This chapter outlines the structural and institutional arrangements which characterise the Chinese banking sector as well as the banking reforms which have been implemented by the Chinese government over the last thirty years. The chapter provides much of the contextual background needed for assessing the empirical results we obtain on the efficiency analysis of the Chinese banking sector in subsequent chapters. Currently the Chinese banking system consists of a variety of institutions. The most notable characteristic of the Chinese banking system is that state-owned commercial banks dominate the banking sector and are the main official source for the financing of companies. As previously noted the Chinese government has implemented a series of banking reforms since 1979 with the aim of creating a safe and sound banking system. These reform measures can be subdivided into three phases and are discussed in detail in this chapter.
Chapter 5: Methodology
This chapter outlines the modelling framework used to measure the cost efficiency and scale economies of Chinese banks. The chapter first discusses five different stochastic cost frontier models which can be used to estimates cost efficiency levels in the Chinese banking sector. The theme running through the chapter is that a comparison between the results of these five models might identify a preferred SFA model for our sample of Chinese banks. Moreover, this chapter also presents two different DEA models as a complement to the SFA model for methodological cross-checking purposes. Then, following the recommendations of Bauer et al. (1998), we introduce five consistency conditions through which to assess the compatibility of the efficiency estimates generated by the SFA and DEA models. Finally, this chapter outlines the variables used in our empirical analysis, the sources from which we obtained our data and
provides a brief description of the data sample.
Chapter 6: Empirical Results: A Comparison of SFA and DEA
Chapter 6 is the first of two chapters that summarise the empirical results relating to the various efficiency methodologies outlined in the preceding chapter as they are applied to our sample of Chinese banks. This chapter first assesses the importance of accounting for heterogeneity across banks by comparing the results of five different stochastic cost frontier models which are used to estimate efficiency levels in the Chinese banking sector. Our analysis is based on log likelihood ratio tests and discusses the effects of bank heterogeneity on key parameter estimates, efficiency levels and efficiency ranks in order to obtain a preferred SFA model. Moreover, this chapter also checks the compatibility of the SFA, DEA and New DEA models using the distributional properties of the efficiency scores obtained under each technique (that is, mean, variance, skewness, maxima and minima, etc.), the correlations of rankings of efficiency scores across the various techniques, identification of the best and worst banks across the various techniques, the stability of efficiency scores over time and the relation between efficiency scores and standard non-frontier performance measures.
Chapter 7: Chinese Banking Efficiency and Analysis
This chapter empirically analyses the cost efficiency of the Chinese banking sector for the period from 1994 until 2007 using the preferred SFA, DEA and New DEA models. The analysis draws attention to how banking efficiency levels have changed as a result of the banking reforms implemented by the Chinese government. It also examines the diversity of the efficiency scores between the different types of bank (that is, big four state-owned banks, state-owned policy banks, joint stock commercial banks and city commercial banks) and size classes (that is, very big, big, medium, small and very small). This chapter also investigates whether scale economies exist for Chinese banks using both the SFA model and the DEA and New DEA models. Our analysis in this chapter seeks to assist bank management and regulatory authorities by tracing the potential sources of banking inefficiency and by exploring the impact that ownership structure, size, deregulation, market structure and market discipline can have on the cost
efficiency levels of Chinese banks.
Chapter 8: Conclusions and Limitations
This chapter summarises the main findings of our study. Policy implications are also discussed. This chapter also draws attention to some potential limitations of our empirical work and points up some avenues for further research
Chapter 2
Efficiency: Meaning, Theory and
Measurement
2.1
Introduction
The main objective of this chapter is to introduce the theoretical framework related to productive efficiency and the measurement of efficiency. Section 2.2 briefly discusses the difference between the conventional and frontier efficiency approaches, which enables us to understand why the frontier efficiency approach is superior to conventional performance ratios. Section 2.3 develops the concepts of efficiency and economies of scale and scope. (In)efficiency will be defined as the departure of the individual firm from a benchmark, which is known as the efficient frontier. Economic efficiency (or cost efficiency) is normally viewed as consisting of two components, technical and allocative efficiency. Economies of scale is a measure of efficiency dealing with the size of the production unit being considered. Founded on the economic concept of economies and diseconomies of scale, technical efficiency can be investigated further and decomposed into pure technical efficiency and scale efficiency. Section 2.4 briefly discusses various theories of the firm. These theories seek to explain how the market works and why firms may not able to utilise their resources in the most efficient way possible.
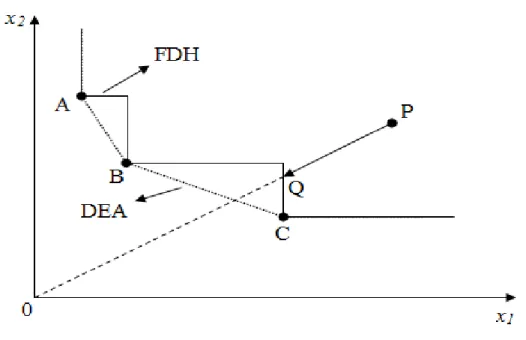
Section 2.5 reviews the main frontier techniques used to measure efficiency. Generally, frontier techniques can be classified into two streams: non-parametric and parametric techniques. Non-parametric techniques refer to the data envelopment analysis (DEA) approach and free disposal hull (FDH) approach. They are mathematical programming approaches to estimating efficiency and represent an empirical implementation of Shephard’s distance function methodology. Parametric techniques refer to the stochastic frontier analysis (SFA), distribution free approach (DFA) and thick frontier approach (TFA). These approaches require a pre-specified functional form for the best-practice frontier (cost, profit or production). A firm is labelled inefficient if its
costs are higher or profits are lower than the best-practice firm after removing random errors. In this section we also discuss the most widely used functional forms in the empirical literature on financial institutions and the main differences between the parametric and non-parametric approaches. Finally, section 2.6 summarises this chapter.
2.2
Conventional and Frontier Efficiency Approach
There are two main ways by which to measure the performance of banks. The first is the classical approach, based on simple profit-cost analysis, which is the simplest and most naive measure of efficiency. This approach is represented by conventional performance ratios which concentrate on examining financial ratios such as ROE, ROA1,
capital asset ratio, growth rate of total revenue, and cost/income ratio all of which are commonly used by regulators, financial institution managers and industry consultants to evaluate performance. However, conventional performance ratios fail to control for the influences of input price, output price and other exogenous market factors, which constrain the standard performance ratios from reaching closer estimations of the true performance. In the last thirty years, academic research has increasingly focused on another approach; named Frontier efficiency (or X-efficiency) approach, to measure the performance of financial institutions. Frontier efficiency measures deviations in performance from that of “best-practice firms” on the efficient frontier, controlling for the effect of a number of exogenous factors such as the prices faced in local markets. In other words, the Frontier efficiency method measures how well the financial institution performs relative to the predicted performance of the best firms facing the same market conditions in the industry. It represents the ability of management to control costs and use resources to produce output. Frontier efficiency measures summarise firm performance in a single statistic (efficiency score) that can control differences among firms in a sophisticated multidimensional framework that has its roots in economic theory (Cummins and Weiss, 2000). Therefore, frontier efficiency appears to be superior to conventional performance ratios and obtains better estimates of the underlying performance of firms.
2.3
The Framework of Efficiency
The primary purpose of this section is to introduce a number of commonly used efficiency concepts which may be employed in this study and to discuss how these measures may be calculated relative to a given frontier. The concept of economic efficiency flows directly from the microeconomic theory of the firm. Based on the ideas of Debreu (1951) and Farrell (1957) who built the standard framework of productive efficiency (production frontier), overall economic efficiency can be decomposed into scale efficiency, scope efficiency, pure technical efficiency and allocative efficiency. Theoretically, a firm is fully efficient if it produces the output level and mix that maximises profits and minimises possible costs.
2.3.1 Technical, Allocative and Cost Efficiency
Farrell (1957) has proposed a method of measuring productive efficiency which uses an “efficient isoquant” estimated as part of the convex hull of the observed points. Farrell proposes an assumption under which the production function is homothetic. A homothetic function is a monotonic transformation of a homogeneous function in which the marginal rate of technical substitution is constant along a ray drawn from the origin. For instance, let a production function f(x1,x2)be homogeneous of the first degree inx1andx2, and assume that the isoquant of this homogeneous production function is an efficient isoquant. An (increasing) monotonic transformation of a homogenous production function yields a homothetic production function in F(X)=g
[
f(x1,x2)]
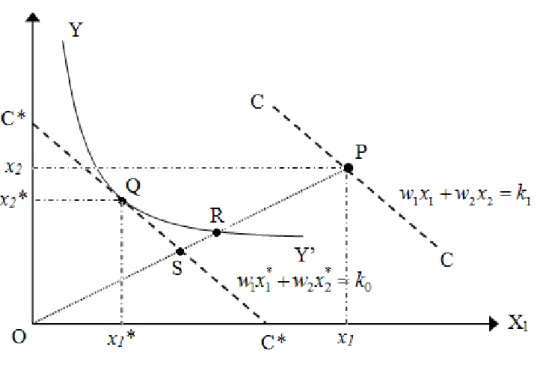
where g is a strictly increasing monotonic transformation. A series of homothetic isoquants can be derived from the original (efficient) isoquant by appropriate scaling up. In other words, a proportional increase or decrease of all inputs should not affect the marginal rate of technical substitution along the isoquants. A comparison between the efficient isoquant and any other isoquant for given output would indicate departure from full efficiency (Clemhout, 1968).The analysis of efficiency carried out by Farrell (1957) can be best illustrated, for the single output and two inputs case in the unit isoquant diagram (Figure 2.1).
Figure 2.1 Technical, Allocative and Cost Efficiency
Source: Cooper et al. (2007, p.258)
Farrell (1957) initially assumes that constant returns to scale (CRS) depicts the efficient production function or the frontier. The technological set is fully described by the unit isoquant YY’ that captures the combination of the inputs (X1, X2) by which the firm can
produce a certain output when it is perfectly efficient. In the other words, YY’ shows minimum combinations of inputs needed to produce a unit of output. Thus, under this framework, every package of inputs along the unit isoquant is considered as technically efficient while any point above and to the right of it, such as point P, is defined as a technically inefficient producer since the input package that is being used is more than enough to produce a unit of output. Hence, the distance RP along the ray OP measures the technical inefficiency of a producer located at point P. This distance (RP) represents the amount by which all inputs can be reduced without decreasing the amount of output. Geometrically, the technical inefficiency level associated with package P can be expressed by the ratio RP/OP and, therefore, the technical efficiency (TE) of the producer under analysis would be given by the ratio OR/OP, which takes a value between zero and one. A value of one implies that the firm is fully technically efficient.
Allocative efficiency (AE) involves the selection of an input mix that allocates factors to their highest value uses and introduces the opportunity cost of factor inputs to the measurement of productive efficiency. Allocative inefficiency can also be derived from the unit isoquant plotted in Figure 2.1. Given information on the market prices of inputs (w1,w2), the isocost line CC through P is associated with w1x1+w2x2 =k1 and
the slope of this line reflect the input price ratio. However, this cost can be further reduced by moving this line in parallel fashion until it is tangential to the isoquant at Q.
The coordinates of CC then give * 0
2 2 * 1
1x w x k
w + = achieving the minimal cost at the
prescribed output level. Now we note that we can similarly determine the relative distances of S and R to obtain the ratio OS/OR. With respect to the least cost combination of inputs given by the point Q, the above ratio indicates the cost reduction that a producer would be able to achieve if it moved from a technically but not allocatively efficient input package (R) to both a technically and allocatively efficient one (Q). Therefore, the allocative efficiency that characterises the producer at point P is given by the ratio OS/OR.
There is another measure that is commonly referred to as cost efficiency or economic efficiency. It can be represented by the ratio of minimal cost (wx*) to actual cost (wx0),
that is, the ratio wx*/wx0 = OS/OP. A cost efficient firm will choose its inputs and
mixes according to their prices so as to minimise total cost. Cost inefficiency may arise from two different sources. One is deficiency in applying the technology (technical inefficiency) and another one is suboptimal allocation of resources (allocative inefficiency). Thus, total overall cost efficiency can be presented as the product of technical efficiency and allocative efficiency:
Overall cost efficiency = allocative efficiency × technical efficiency = OS/OR ×OR/OP = OS/OP
2.3.2 Economies of Scale
Economies of scale (or returns to scale) refers to the rate at which output changes as all factor quantities are varied and measures whether firms with similar production and managerial technologies are operating at an optimal size (Molyneux et al. 1996). Specifically, economies of scale (or increasing returns to scale) exist, over a given mix of outputs, if a proportionate increase in firm’s outputs would lead to a less than proportionate increase in its total costs. Conversely, diseconomies of scale (or decreasing returns to scale) arise if a proportionate increase in a firm’s outputs would lead to a more than proportionate increase in its total costs. Constant returns to scale occur if a proportionate increase in a firm’s outputs would lead to the same proportionate increase in its total costs.
Economies of scale actually are based on the shape of the average cost curve and are explained in Figure 2.2. The Figure shows a series of short-run average cost curves (SACs) and a long-run average cost curve (LAC). Each short-run average cost curve represents the average cost of different-size firms during a short period of time. The firm will choose the size that yields the lowest average cost for that particular level of output. The long-run average cost curve is traced out from the SACs where each point of the LAC is to a point of tangency with a corresponding short run cost curve and it shows the least cost method of production for any level of output. Scale economies appear as the slope of an average cost curve indicating how costs vary with output (Humphrey, 1990). The downward-sloping LAC reflects economies of scale, because average costs of production decline as output increases. This cost characteristic exists only up to a certain firm size known as the minimum efficient scale (MES). A firm achieves the lowest attainable average cost at the point M and experiences constant returns to scale around that point. Beyond point M, the upward-sloping LAC indicates diseconomies of scale, because the average cost of production increase as output increases.
Figure 2.2 Cost Curves and Economies of Scale
Source: Humphrey (1990, p.38).
Notes: SAC: short-run average cost curve; LAC: long-run average cost curve; MES: minimum efficient scale.
2.3.3 Pure Technical and Scale Efficiency
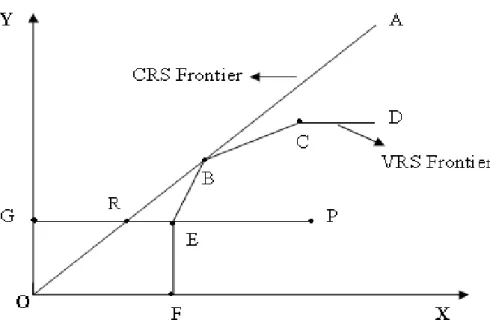
In Figure 2.1, the use of the unit isoquant assumes constant returns to scale (CRS), but this assumption does not always hold. A firm using more of both inputs than the combination represented by R may exhibit variable returns to scale (VRS). Thus, in general, technical efficiency can be further decomposed into measures of pure technical efficiency (PTE) and scale efficiency (SE). In Figure 2.3, assuming the simple case of one input X and one output Y, P represents an existing bank. OA represents the constant returns to scale frontier. Firms can either lie on, or below the frontier but cannot be above it. Therefore, the ratio of GR/GP represents the measure of technical efficiency of bank P which corresponds to OR/OP in Figure 2.1.
Figure 2.3 Pure Technical and Scale Efficiency
The concept of scale efficiency ascertains whether or not the firm operates at an optimum size. In order to measure scale efficiency, the assumption of variable returns to scale replaces that of constant returns to scale. In the above figure, FEBCD represents a variable returns to scale frontier. For the bank at point P, pure technical efficiency (PTE) equals the ratio of GE / GP. Scale efficiency is the ratio of GR / GE or equal to TE divided by PTE. The value of SE is unity when operating under constant returns to scale. Values of less than unity reflect scale inefficiency. Scale inefficiency could be caused by the firm having to operate under increasing returns to scale or decreasing returns to scale. In order to investigate this, the non-increasing returns to scale frontier is developed, represented by OBCD. If SE is not equal to unity and PTE is equal to GR/GP, decreasing returns to scale exists. If PTE is not equal to GR/GP which is based on the frontier OBCD, then the scale inefficiency is due to increasing returns to scale.
2.3.4 Economies of Scope
cost by a single firm than the total cost that is incurred in their independent production
(Molyneux et al., 1996). For banks, this mean that potential cost savings are
achievable through the joint production of financial services. Conversely, diseconomies of scope arise if joint production is more costly than independent production.
To illustrate the concept of economies of scope, we assume that a firm produces two outputs: y1 and y2. If the two outputs are produced independently, their separate cost
function are C(y1,0) and C(0, y2). If the two outputs are produced jointly, the joint cost
of producing is C(y1, y2). Economies of scope exist if the total cost of producing the
two outputs jointly is less than the combined cost of producing the same amounts of each output separately, that is, C(y1, y2) < C(y1,0) + C(0, y2). If the inequality is
reversed, then diseconomies of scope are said to exist. Given this example, the measure of economies of scope can be measured as follows:
SCOPE= y2) C(y1, y2) C(y1, -y2) C(0, C(y1,0)+
where SCOPE > 0 indicates overall economies of scope and SCOPE < 0 diseconomies of scope. The estimation of economies of scope in the banking sector is not an easy task because of the lack of cost data for each output. Therefore, our study will not analyse economies of scope for Chinese banks.
2.4
The Economic Theory and Causes of Inefficiency
Before turning to the review of frontier efficiency methodologies, we briefly discuss various theories of the firm. The aim of this discussion is to link the theory of the firm with the frontier efficiency analysis literature. The discussion will address the question of why firms may not able to utilise their resources efficiently.
2.4.1 Conventional Neoclassical Theory of the Firm
The concepts of efficiency derive their basis from the microeconomic theory of the firm. The neo-classical theory of the firm stems from the static equilibrium framework first developed by Cournot in 1883. The conventional neoclassical theory treats the firm as a black box which transforms resources into saleable goods. This transformation of inputs into outputs is described by a production function or production possibilities set.
The conventional neoclassical theory of the firm assumes that the firm is operating in a perfectly competitive market2. In this market, all firms seek to maximise their profit which is accomplished by simultaneously maximising revenues and minimising costs. Consequently, a competitive general equilibrium is achieved by equating the marginal rates of substitution for all firms between any two economic variables (inputs or outputs) (Cohen and Cyert, 1975). The competitive equilibrium leads all firms to earn only a normal profit. In order words, firms cannot earn any more money than is necessary to cover their economic costs. In the short run, it is possible for some individual firms to make abnormal profits. The existence of abnormal profits will attract other firms to enter the market and compete with incumbent firms. Competition between firms will drive the market price down until all firms are earning a normal profit in the long run. If any firm is unable to make a normal profit due to inefficient operation, then in long run, these inefficient firms will be either acquired by efficient firms or withdraw from the market. Therefore, according to the conventional neoclassical theory of the firm, the firm which can efficiently allocate resources to produce the maximum level of output for given input will survive and the firm which is operating inefficiently will be driven out of the market. In other words, in a perfectly competitive market, any firm that fails to reach the efficiency frontier will be forced out of the market and only efficient firms will remain. Empirical research suggests, however, that not all firms operate on the efficient frontier and a number of firms do not produce at the point where long run average costs are minimised but still survive in the market. Thus, the traditional neoclassical theory fails to explain why inefficient firms survive in the
2 The main characteristics of a perfectly competitive market: 1) a large number of producers and
consumers in the market; 2) Goods and services are perfect substitutes; 3) Perfect and complete information between consumers and firms; 4) All firms are assumed to have equal access to resources and improvements in production technologies; 5) no barriers to entry into or out of the market.
market, and because of this some alternative theories have been developed to supplement the conventional theory of the firm.
Demsetz (1997) noted that the firm in neoclassical theory reflects the imperatives of the price system. If the price system works well, resources are allocated well. But the traditional theory pays little attention to the internal workings of the firm and provides no analysis of the decision-making process and no explanation of the factors that determine business success or failure. Therefore, the neo-classical theory of the firm has been challenged by alternatives such as managerial theories (Baumol 1959, Marris 1964, Williamson 1964), behavioural theories (Simon 1959, Cyert and March 1963), and X-efficiency theory (Leibenstein 1966, 1979). The literature on these theories is vast. Here we can only present a very brief overview of theories that can explain why firms may not always operate efficiently.
2.4.2 The Managerial Theories of the Firm
The conventional theory of the profit-maximising firm has been criticised as being much too unrealistic and narrow in the modern economy where a divorce of ownership and control exists in large organisations. In its place, managerial theories of the firm have been developed. Each of the managerial theories argues that the controlling management group will pursue their own interests and utility, rather than maximising the profit of the firm, although they are always subject to some kind of profit constraint. For example, firm’s managers are most likely to seek those objectives from which they obtain prestige, power and greater personal monetary reward. In so doing, costs may not be minimised and a level of organisational slack would be built into the system (Brewster, 1997).
Baumol (1959) introduces the sales-maximisation model which argues that the managerial objectives (income, power, prestige, etc.) are highly correlated with sales revenue. Thus, Baumol suggests that the prime goal of management would be to maximise sales revenue after achieving some minimum level of profit necessary to satisfy shareholders. Marris (1964) develops a dynamic model of the firm by
assuming that the managerial objective is to concentrate on the maximisation of firm growth over time. Williamson (1964) formulated a more general managerial utility-maximising model in which managers attempt to maximise their own utility rather than to maximise the profit of the firm. He suggests that managers manifest ‘expense preferences’ which means managers achieve their objectives by spending some of the firm’s potential profits for unnecessary purposes thereby increasing managerial satisfaction or utility.
In the 1970’s managerial theories of the firm have developed in terms of principal-agent analysis. This analysis of the firm stems from two main sources. One is the work of Spence and Zeckhauser (1971) and Ross (1973) which is concerned with problems of arranging contracts with imperfect and asymmetric information. Another approach is known as “agency theory” as developed by Jensen and Meckling (1976) and Fama (1980). In principal-agent analysis the firm is considered as a nexus of contracts between a firm, the principal, and its subcontractor, the agent. The principals (shareholders) hire a group of agents (managers) to carry out certain tasks such as to maximise the value of the firm. In the firm, the principals cannot have full knowledge and information about the firm’s operation and performance capabilities. The agents, however, have more information or knowledge than the principals. The existence of asymmetric information and uncertainty leads to a problem of “hidden action” or “moral hazard”. The agents can pursue their own interests such as high salaries, better working conditions, on-the-job leisure, job security, etc. but the principals are unable to fully observe the actions of the agents. In order to monitor the behaviour of the agent, the principal has to spend additional costs, known as agency costs. Jensen and Meckling (1976) describe the costs of agency as the sum of monitoring expenditures incurred by the principal, bonding expenditures incurred by the agent and the value of the lost residual borne by the principal and attributable to the agency problem. The principal also tries to affect and motivate the agent’s behaviour in the interests of the principal by creating an incentive compatible reward structure and remuneration package. Overall, however, the principal-agent problem reduces the firm’s profit and induces inefficiency in the firm.
Principal and agent theory could be relevant particularly to Chinese banking efficiency studies. In China, whenever the state banks (the major components of the Chinese banking sector) run into difficulty, the principal (the state) has to bail them out. The agents (bank managers), knowing that the principal is the ultimate resort of help, lend relentlessly resulting in huge non-performing loans that might never be recovered and leading to operate inefficiently.
2.4.3 The Behavioural Theories of the Firm
The behavioural theory of the firm argues that, in practice, the firm’s ability, need or even desire to optimise (maximise) objectives may be questionable. The business world faced by firms is characterised by uncertainty and the absence of complete information. Under these circumstances, Simon (1959) developed a theory of the firm that emphasises satisficing and bounded rationality in the decision-making process instead of pursuing a maximisation goal3. Individuals or groups in the firm want to act rationally, but they are unable to do so because they possess cognitive limitations in solving complex problems and in processing information (Brewster, 1997). Therefore, bounded rationality exists in the process of decision-making and decision-makers exhibit ‘satisficing’ behaviour which is set in terms of some aspiration level, rather than optimising behaviour. As a consequence, a firm operating this way will not keep costs down to a minimum and this results in productive inefficiency.
Cyert and March (1963) note that, building on the work of Simon (1959), the firm as an organisation is not a unified structure but a coalition of various participants such as owners, managers workers customers and so forth. Each of these groups or individuals will have varying interests and objectives. Moreover, the firm itself has five objectives – production, inventory, sales, market share, and profit. Some of the objectives may be conflicting. Consequently decision-making within the firm is a continual process of bargaining and aspiration level, in which side payments are made to ensure compliance or to entice individuals into some subgrouping. However, there may be a disparity between the resources available to the firm and the payments required to keep factors in
their posts. The difference between total resources and total payments is termed organisational slack. For instance, wages in excess of those required to maintain labour may be paid. This organisational slack will increase unnecessary costs and reduce the overall efficiency of the firm. In a stable environment, the payments may converge towards aspiration levels thereby leading organisational slack to be close to zero. But in practice it is clear that the environment is not stationary. Not only are there business cycles, but there is the onward surge of technological progress, which ensures that firms must continue to strive to maintain themselves on a best-practice frontier. Given this flux, it is possible for inefficient firms to survive in the market (as long as they are not too inefficient) (Dobbs, 2000).
2.4.4 The X-efficiency Theory of the Firm
The X-efficiency theory which links behavioural theory and managerial utility theory was formulated in a succession of Leibenstein’s papers (1966, 1975, 1977, and 1978). X-efficiency describes the general efficiency of a firm (given the resources it uses and the best technology available) in transforming inputs at minimum cost into maximum
outputs. Leibenstein criticises the assumption of neoclassical theory that firms
maximise profit. He claims not only that firms cannot maximise profit but that many of them maximise managerial-utility instead (Demsetz, 1995).
Leibenstein justifies his rejection of neoclassical theory by studies offering evidence of differential performance across firms. Leibenstein argues as follows:
One idea that emerges from this study is that firms and economies do not operate on an outer-bound production possibility surface consistent with their resources. Rather they actually work on a production surface that is well within that outer bound. This means that for a variety of reasons people and organisations normally work neither as hard nor as effectively as they could. In situations where competitive pressure is light, many people will trade the disutility of greater effort, of search, and the control of other peoples’ activities for the utility of feeling less pressure and of better
interpersonal relations. But in situations where competitive pressures are high, and hence the costs of such trades are also high, they will exchange less of the disutility of effort for the utility of freedom from pressure, etc. (Leibenstein, 1966 p 413)
From the evidence, Leibenstein identifies two possible sources of inefficiency. One is a divergence between price and marginal cost, named allocative inefficiency. This divergence may be caused by monopoly, tariffs, and other impediments to competitive output rates. Another is labelled X-inefficiency which stems from the failure of businesses to achieve the lowest possible cost functions for producing their goods and this can account for wasted resources. X-inefficiency seeks to analyse intra-firm behaviour and relations and interactions of people within the firm, rather than the working of the price system. Leibenstein shows that inefficiency deriving from X-inefficiency is significant in comparison to inefficiencies deriving form allocative inefficiency.
Within X-inefficiency theory, Leibenstein (1978) identified non-maximising behaviour as the key idea of X-efficiency. The degree of X-inefficiency is primarily determined by the level of effort of individuals within the firm. The problem of principal–agent relationships is an important source of X-inefficiency. Moreover, due to the feature of incomplete contingent contracts between principals and agents, agents can evade the consequences of cost overruns and have no motivation to keep costs down. Then firms will be more X-inefficient.
2.5
The Measurement of Efficiency
Farrell suggested constructing the efficiency frontier using the observed sample of firms in the industry in question. The firms in the constructed frontier are defined to be efficient. Each firm is compared to a point on the efficient unit isosurface then a relative measure of efficiency is determined. Measuring efficiency and identifying peers by graphical techniques is only possible in simple cases. When a firm has
many inputs and outputs, more sophisticated techniques must be used to solve this problem. In the study of measuring efficiency, there are two separate streams: non-parametric approaches (data envelopment analysis, free disposal hull) and parametric studies (econometric studies, e.g., stochastic frontier, distribution-free). Non-parametric approaches are a linear programming technique for the evaluation of multiple-input/multiple-output firms. Parametric studies aim at improving the standard OLS estimates with the addition of an asymmetric structure for the residuals, so as to account for the distance between empirical observations and the theoretical efficient frontier. In this section, an overview of these frontier efficiency methodologies will be provided and our aim is to give a better understanding of the issues associated with measuring efficiency.
2.5.1 Data Envelopment Analysis
The idea of the non-parametric efficiency approach was originally presented in Farrell’s (1957) seminal paper. However, his empirical work had been limited to the single–output case and did not deal with applications where large data sets with multiple input-outputs are involved. Moreover, this mathematical programming idea did not receive much detailed attention for about two decades, until the paper by Charnes et al (1978) was published. In this classic paper, they proposed a mathematical programming algorithm, termed data envelopment analysis (DEA), for assessing the performance of a set of homogeneous entities called decision making units (DMUs) which convert multiple inputs into multiple outputs. This approach forms an empirical production frontier or envelopment surface and measures and calculates efficiency relative to the constructed frontier. Since the pioneering work by Charnes et al. (1978) numerous papers have appeared which have extended and applied DEA methodology. Seiford (1997) lists over 400 papers in a comprehensive bibliography and Cooper et al. (2007) give over 2000 DEA references. Such rapid growth and widespread acceptance of DEA is testimony to its strengths and applicability.
CCR Model
Here we provide a description of one of the most basic DEA models, the CCR model, which was proposed by Charnes, Cooper, and Rhodes (1978). This model is used to measure the overall technical efficiency of decision making units (DMUs). They introduced a measure of efficiency for each DMU that is obtained as a maximum of a ratio of weighted outputs to weighted inputs. The ratio for every DMU has to be less than or equal to one. Here, it is possible to reduce the multiple-output / multiple-input situation for each DMU to a single virtual output and a single virtual input ratio. This ratio provides a measure of efficiency for a given DMU, which is a function of the weights of the virtual input-output combination- also called a function of the multipliers. Formally the efficiency for each DMU can be obtained by the following mathematical programming approach:
m
i
s
r
v
u
n
j
x
v
y
u
to
subject
x
v
y
u
h
i r m i ij i s r rj r m i i i s r r r,
,
2
,
1
;
,
,
2
,
1
;
0
,
,
,
,
2
,
1
;
1
:
max
1 1 1 0 1 0 0K
K
K
=
=
≥
=
≤
=
∑
∑
∑
∑
= = = = (2.1)where it is should be noted that xij is the observed amount of input of the ith type of the
jth DMU (xij > 0, i = 1,2,…,m, j = 1,2,…,n) and yrj is the observed amount of output
of the rth type for the jth DMU (yrj > 0, r = 1,2,…,s, j = 1,2,…,n). In other words,
jth DMU uses an m-dimensional input vector to produce an s-dimensional output vector. Here, (xi0 , yr0) is the input-output vector of the producer being evaluated. The
objective function h0 tries to maximise the ratio of virtual output to virtual input subject
The variables ur and vi are the weights of output and input which must be non-negative
and are determined by the above programming approach. However, a notable problem with this particular fractional formulation is that it has an infinite number of solutions; if (u*, v*) is optimal, then (αu*,αv*) will also be optimal for non-negative α. Thus Charnes et al. (1978) have transformed the above problem into an equivalent linear
programming problem. They added an additional constraint ∑ =
= m i i i x v 1 0 1 so that the above transformation is achieved and the non-uniqueness problem identified above can be avoided. The notation changes from (u, v) to (μ, ν) to reflect the transformation. The new linear programming problem is equivalent to the equations in (2.1). It can be written:
m
i
s
r
v
x
v
n
j
x
v
y
y
z
i r m i i i m i i ij s r r rj s r r r,
,
2
,
1
;
,
,
2
,
1
;
0
,
1
,
2
,
1
,
0
max
1 0 1 1 1 0 0K
K
K
=
=
≥
∑
=
=
≤
∑
−
∑
∑
=
= = = =μ
μ
μ
μ (2.2)The above equations are known as the multiplier form of the DEA linear programming problem. Because the concept of duality exists in linear programming, the dual for DMU0 can be derived as:
n
j
m
i
x
x
s
r
y
y
to
subject
z
j io CCR n j ij j r n j rj j CCR,
,
2
,
1
,
0
,
,
2
,
1
,
,
,
2
,
1
,
min
0 1 0 1 0 0K
K
K
=
≥
=
≤
=
≥
=
∑
∑
= =λ
θ
λ
λ
θ
λ (2.3)The above problem is referred to as the envelopment form of DEA. Optimal solutions (θ, λ) are obtained for each of the DMUs being evaluated. The value of θ is the efficiency score for the particular DMU0 and this efficiency score is a radial measure of
technical efficiency, according to the Debreu-Farrell definition. A set of constraints assures that the value of θ is always less than or equal to unity and the efficiency score
for each observed DMU is relative to other DMUs. DMUs for which θ = 1 are
identified as the technically efficient while when θ < 1 we have a relatively inefficient
DMU. The optimal λ can identify a project (boundary) point located on the
constructed production frontier when the problem seeks the radial contraction of the input vector. Färe et al. (1994) point out that the CCR model imposes a feasible production set which is closed and convex, and presents constant returns-to-scale and strong disposability of inputs and outputs4. In later sections, some extension DEA models which relax some of its restrictive properties will be discussed.
The above DEA problem yields a piece-wise linear surface and some sections of this surface run parallel to the axes. So this radial efficiency measurement causes a difficulty in that for an efficient point, it is possible to reduce inputs without altering outputs or increase output without altering inputs. These input savings or output expansions are referred to as input or output slacks. Some authors (e.g., Ali and Seiford, 1993; Cooper et al. 2004) develop the following linear programming algorithm to deal with these slack problems:
n
j
s
s
m
i
x
s
x
s
r
y
s
y
to
subject
s
s
i r j io i n j ij j r r n j rj j s i r m i i s si r,
,
2
,
1
,
0
,
,
,
,
2
,
1
,
,
,
2
,
1
,
)
(
min
0 1 0 1 1 1 0 , , ,K
K
K
=
≥
=
=
+
=
=
−
+
−
− + − = + = = + = −∑
∑
∑
∑
+ −λ
θ
λ
λ
ε
θ
λ θ (2.4)Here the sr+,si− are slack variables and