Issues
ISSN: 2146-4138
available at http: www.econjournals.com
International Journal of Economics and Financial Issues, 2016, 6(3), 861-871.
Cost Efficiency of the Egyptian Banking Sector: A Panel Data
Analysis
Hassan Ismail Hassan
1, Ammar Jreisat
2*
1Department of Banking and Finance, College of Business Administrative, Al Ain University of Science and Technology, UAE, 2Department of Banking and Finance, College of Business Administrative, Al Ain University of Science and Technology, UAE. *Email: [email protected]
ABSTRACT
Based on a two stage method this paper investigates the determinants of the cost efficiency (CE) of Egyptian banking sector. Employing data envelopment analysis (DEA). We compare the CE of large, medium and small banks and the CE of foreign and domestic banks using a balanced panel which cover 14 banks operating in Egypt from 1997 to 2013. In the first stage, CE scores are computed using an input-oriented DEA. At the second stage, CE scores are regressed on a set of potential explanatory variables in a logit model. While the CE scores show large improvements in the early and third phases of financial deregulation. Over the entire sample period, CE has declined at the rate of 0.963% per annum. Our finding indicates that age, loan to net
interest margin, return on equity and good management practices positively affects banks CE and number of bank branches negatively affects bank CE.
Keywords: Cost Efficiency, Two-stage Data Envelopment Analysis, Egyptian Banks JEL Classifications: D22, D24, D61, G21
1. INTRODUCTION
Measuring banks’ performance have recently received great attention especially after the banking and financial crisis which started in 2007. Two basic questions in banking are whether banks outperform or underperform their benchmarks and whether superior performance persists? With the Egyptian economy’s slowdown, bank efficiency has become a concern for policymakers and Egyptian banks have had to find creative ways to optimize their cost structures. There is a large body of literature dealing with the measurement of banking efficiency in the developed economies, but studies on banking efficiency relating to Middle Eastern economies are few. Up to our knowledge, there is a no research related directly to the cost efficiency (CE) of banks in Egypt. One of the reasons for the lack of this research is that most Middle Eastern countries including Egypt did not introduce financial and banking sector reforms until the 1990s. Until then, financial systems tended to be heavily regulated and dominated by the public sector (United Nations, 2005). However, over the past two decades, the majority of Middle East countries have gradually moved towards more liberalized financial systems.
This has created interest among policy makers, managers and economists in assessing the efficiency performance of banks in Middle Eastern countries over time. In specific, the banking efficiency is essential for the survival of banks in Egypt as the Egyptian government accrue unprecedented outstanding loans during the last few decades. However, the ultimate ramifications of the high, yet debt-backed growth were uncontrollable inflation and enormous outstanding debts.
banks that will survive and prosper from those that will fail and have problems with competitiveness. The efficiency of banks and other financial institutions is assessed based on summary measures which are technical in nature. These measures are quite crucial to understand and compare the efficiency estimates of banks of different sizes and over time.
The aim of this research is to fill the gap to the existing literature on banking efficiency in Egypt. The era of our sample is very rich with many aspects that influenced the Egyptian banking system, starting with 2003 when the Egyptian government decided to fully liberalize the currency exchange rate where the rate is set according to the market forces. The Egyptian government believed that floating the Egyptian pound against the US dollar will help the economy to be more competitive. In 2004, the Central Bank of Egypt (CBE) started a new program to restructure the banking sector and deal with non-performing loans by encouraging a wave of mergers and acquisitions which enabled large and strong banks to acquire many small banks. The number of banks decreased from 65 banks in 1997 to only 39 banks in 2013. However, the global financial crises and the Egyptian Revolution in 2011 brought about great changes in practices of Egyptian banks from 2009 to 2013. This research will provide a new perspective to the field of banking efficiency in Egypt.
The primary objective of this research is to undertake in-depth evaluation and examination the CE of banks operating in Egypt for a balanced panel which covers 14 banks operating in Egypt (3 large, 5 medium, 3 small and 3 foreign) for the period 1997-2013, by estimating a non-parametric approach data envelopment analysis (DEA). The study compares the CE levels between the foreign banks and domestic banks, between large banks, medium and small banks during the sample period. The empirical results are obtained by running an input-oriented DEA model using the software package, DEAP Version 2.1 (Coelli, 1996).
The paper is organized as follows. Section 2 provide overview on the financial reforms and banking sector in Egypt. Section 3 provide a review of literature on the Egyptian banking efficiency. The concept of CE and its estimation based on DEA approach discusses providing the DEA results in Section 4. Section 5 provide the data as well as input and output variables. Determinants of banks efficiency and the related estimation results are presented in Section 5. Section 6 presents some conclusions.
2. FINANCIAL REFORMS AND BANKING
SECTOR IN EGYPT
The Egyptian banking industry has important achievements at the local and global levels in the last two decades. It played a great role in developing the Egyptian economy through the activation of financial system, providing funds for mega projects in infrastructure and social services and inventing new services and products to move surpluses to sectors which has deficits. The Egyptian economy has changed greatly in the last two decades. The Egyptian government has altered its attitude towards a fully market-oriented economy. The government embarked upon a major
program of economic reform that stimulated banking industry. This new program aimed generally at expanding the private sector’s ownership base, integrating into the global economy, and accelerating the pace of privatization of the public sector (Central Bank of Egypt, 1996). Consequently, the government issued Public Enterprise Companies Law No. 203/1991 to facilitate the implementation of the privatization program. Additionally, in 1992, the government developed the legislations and legal regulations of the Egyptian Stock Exchanges through the passage of capital market law No.95/1992. In specific, this program designed with help of International Monetary Fund and the World Bank to decrease the government’s role in the financial sector, to encourage private sector investments, to introduce market-oriented banking mechanisms, to promote foreign direct investment in Egypt and to enhance competition in the banking sector. However, there was a weak economic growth as a consequence of several economic and political shocks.
3. A REVIEW OF LITERATURE ON THE
EGYPTIAN BANKING EFFICIENCY
The last few decades have witnessed an ever-growing volume of various studies in the field banking efficiency worldwide. However, this study is by no means the first to focus on the CE of the Egyptian banking sector. There have been a number of papers concerned with the CE in developed and developing countries. Ferrier and Lovell (1990) apply parametric stochastic frontier analysis (SFA) and non-parametric DEA on a sample of 575 US banks to estimate CE. Their results suggest both similarities and differences between the approaches. Both techniques broadly agree on the average value of CE: 74% with SFA and 79% with DEA. However, they observe a very different decomposition of cost inefficiencies between technical and allocative inefficiencies: Technical inefficiencies dominate with DEA, while allocative inefficiencies are stronger with SFA. Gulati (2015) investigates the trends of CE of Indian banking sector in response to financial deregulations in the beginning of 1990s. Gulati finds that deregulation programme affected positively on CE and the increase of cost was due to improvements in technical efficiency. He also finds that public and foreign banks are better than private banks. He concluded that the size of banks and off-balance sheet activities are the key drivers of CE. Jaffry et al. (2012) examine the trends in the efficiency levels of Indian and Pakistani commercial banks from 1985 to 2003 after a significant change in regulations in both countries. They find that the efficiency levels has decreased post reform period and then increased gradually. They concluded that banks need a period of initial adjustment after regulations followed by a subsequent correction period. In addition, Chen et al. (2004) examined the cost, technical and allocative efficiency (AE) of 43 Chinese banks covering the deregulation era from 1993 till 2000 by running input oriented DEA approach. They employed the intermediation approach for choosing three inputs prices (price of labor, price of deposits and price of capital) with three outputs (loans, deposits and non-interest income). The study investigated the change in the efficiency of Chinese banks’ after the initiation of a program of deregulation in 1995. It was found that large state-owned banks and smaller banks were more efficient than medium sized Chinese banks. Moreover, Chinese banks during the financial deregulation of 1995 were recorded improvement in CE levels including both technical and AE. Hassan et al. (2004) investigated efficiency of the banking sector in Bahrain based on data for a panel of 31 banks in 1998 and 2000. Their study estimated allocative and technical efficiencies, scale efficiency and overall CE. The model used three inputs, namely, labor, capital, and loanable funds and two outputs, namely, short term loan and long term loans. The input prices were: Price of labor, price of capital, and interest rate on loanable funds. Their result indicated that the average AE was about 73%, whereas the average technical efficiency was about 56%. Recently, Jreisat et al. (2015) examined the CE levels of Jordanian banks during the reform period from 1996 to 2007. They suggest that both the domestic and foreign banks have shown slight improvements over the years of deregulation era and this led to improvement in the efficiency of the Jordanian banking sector. They also investigated whether ownership structure, size, number of
branches and ATM, bad loan and age of the bank significantly affect the CE levels of Jordanian banks. Interestingly, their finding on the effect of number of ATM on the CE is a statistically significant with positive impact on CE in Jordanian banks. In addition, the results reveal that the relationship between bad loan (credit risk) and CE seems to be very strong, in which bad loan is significantly negatively related to CE. AlKhathlan and Malik (2010) investigated both technical and scale efficiencies of Saudi commercial Banks for the period, 2003-2008. Their sample covered ten out of twelve commercial banks. They employed the DEA intermediation approach. The result indicated that the majority of Saudi banks operated at higher levels of efficiency and managed their financial resources adequately.
Jreisat et al. (2015), this paper aims to measure and evaluate the CE for 17 Jordanian banks (2 large, 8 medium, 4 small and 3 foreign) for the period 1996-2007 covering the deregulation era, by employing a parametric estimation approach also known as a SFA. In addition, this paper analyze the sources of the CE method developed by Papke and Wooldridge (1996). The empirical result for the CE are obtained by running an input-oriented SFA model using the computer program, Frontier Version 4.1., developed by Coelli (1996). The paper findings suggest that both the domestic and foreign banks have shown over the years of deregulation era slight improvements and this led to improvement in the efficiency of the Jordanian banking sector. In addition, this paper investigates whether ownership structure, size, number of branches and ATM, bad loan and age of the bank significantly affect the CE levels of Jordanian banks. Results show that differences in ownership structure significantly affect Jordanian banks‟ performance in terms of CE. Another study done by Jreisat and Paul (2010), provided a review of banking efficiency in the Middle East economies with a special emphasis on measuring the efficiency of banking sector in Jordan, they find that majority of studies have used DEA approach; only few have used SFA methodology to compute efficiency estimates. These studies have revealed that banks have achieved some levels of efficiency. Also, they presented a detailed analysis of banking efficiency in Jordan using data for the period 1996-2007. The input oriented DEA methodology is applied to obtain estimates of technical efficiency decomposed into pure technical and scale efficiency. An attempt is also made to check whether banks are operating at most efficient scale size. Their analysis reveals that the Arab bank which is one of the large banks has performed at the highest level of technical efficiency during the sample period. The small banks are found to be more efficient than the medium sized banks. The foreign banks have shown the lowest technical efficiency indicating a large scope for cost reduction.
affecting the level of output. The AE refers to the selection of inputs to produce a certain level of outputs at given input prices such that the cost of production is minimum. CE is defined as the ratio of minimum (optimum) cost to the observed cost for producing a level of output by a firm. If the CE score for a firm is 0.75, then it would mean that the bank could have achieved the same level of output with 75% of its costs. In other words, the firm wastes 25% of its costs relative to the best-practice firm (Berger and Mester, 1997).
Figure 1, reproduced from Coelli et al. (2005. p. 52), explains how CE can be conceptualized and measured using input-oriented measures1. The working of this is explained by Farrell (1957),
who used a simple example of a firm requiring two inputs x1 and x2 for producing one output q, assuming constant return to scale. Let w refer to input price vector and x to the observed vector of inputs used associated with point P; and let ˆx and x* refer to the input vectors associated with the technically efficient point Q and the cost minimizing input vector atQ′ respectively. Thus, CE can
be defined as the ratio of input costs associated with input vectors
x and x∗ associated with pointsP and Q′.
CE= ′ OR OP
′ =
w x w x
*
/ (1)
As shown in Figure 1, the slope of the isocost lineAA′ represents
the proportion of input prices. AE and TE can be calculated as follows:
* w x
ˆ w x ′
= =
′
OR AE
OQ (2)
ˆ w x w x
′
= =
′
OQ TE
OP (3)
Thus, if the firm sets its inputs at the point Q on the isoquant curveSS′, then it can be said that this firm is technically efficient but allocatively inefficient. If the firm wishes to be technically and allocatively efficient it should reduce the production cost represented by the distance RQ, which would occur at the allocatively (and technically) efficient pointQ′, instead of at the technically efficient but allocatively inefficient point Q.
It follows from this that CE can be expressed as the product of technical and AE measures:
TE×AE=(OQ/OP)×(OR/OQ)=(OR/OP)=CE (4)
DEA efficiency scores assign numerical values (between 0 and 1 or 0 and 100%) to the CE level of a DMU relative to others. CE of one represents a fully cost efficient bank; (1−CE) represents the amount by which the bank could reduce its costs and still produce at least the same amount of output. To measure CE, two sets of linear programs are required, one to measure technical efficiency and the other to measure CE. The CE is often called economic efficiency or overall efficiency. The details of linear programming required to estimate CE is provided in Coelli et al. (2005. p. 184) and hence is not repeated here.
1 Coelli et al. (2005) discussed input-oriented and output-oriented measures, for more details see p51-57.
4.1. Choice of Variable for DEA Model
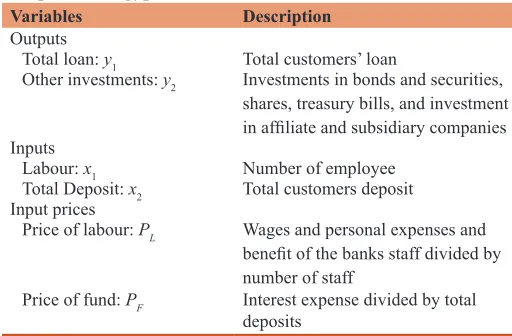
The intermediation approach is quite popular in empirical research particularly based on cross-section data (Colwell and Davis, 1992; Favero and Papi, 1995). In the DEA approach, the number of inputs and outputs is always determined by the number of DMUs (banks in the present context) in the sample. The ability of DEA to distinguish between efficient DMUs and inefficient DMUs depends on a number of inputs and outputs incorporated in the DEA model. It is widely recognized that product of the number of inputs and outputs should not exceed the number of DMUs in the sample (Cooper et al. 2000). This study uses the intermediation approach originally suggested by Sealey and Lindley (1977), in which banks are viewed as intermediaries. In other word, intermediation approach views financial institutions as intermediaries that convert and transfer financial assets from surplus units to deficit units. The estimation of CE requires data not only on real values of inputs and outputs but also on input prices. The inputs and outputs variables used in this paper are listed in Table 1. The input prices for each bank for each year are calculated as follows.
4.2. Data Sources
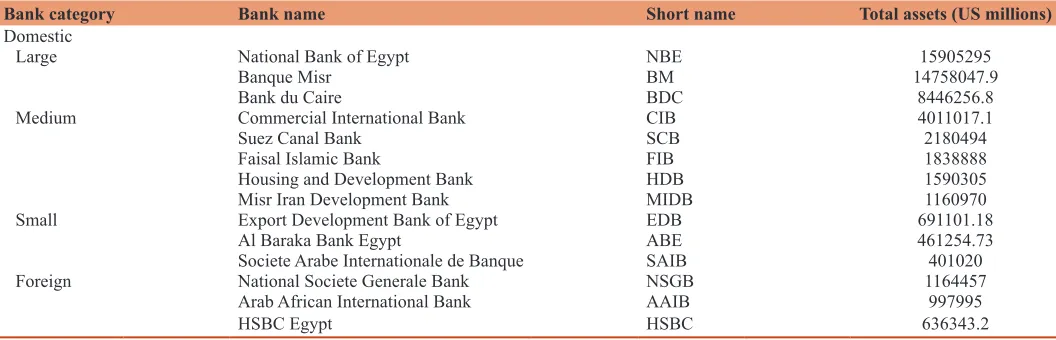
The data used in this study covers 1997-2013 period and are taken from, auditing annual report of individual banks CBE. The data were collected from 14 banks operating in Egypt, 11 domestic banks, and 3 foreign banks. Assets of these banks are given in Table 2.
4.3. Empirical Results on CE
The CE scores of banks are obtained by running an input-oriented DEA model using the software package, DEAP Version
Table 1: Variable definitions banks’ input prices and outputs for Egypt
Variables Description
Outputs
Total loan: y1 Total customers’ loan
Other investments: y2 Investments in bonds and securities, shares, treasury bills, and investment
in affiliate and subsidiary companies
Inputs
Labour: x1 Number of employee Total Deposit: x2 Total customers deposit Input prices
Price of labour: PL Wages and personal expenses and
benefit of the banks staff divided by
number of staff
Price of fund: PF Interest expense divided by total
deposits
2.1 (Coelli, 1996). While the bank specific yearly scores are presented in Appendix Table A1, The sample period mean estimates of cost, allocative and technical efficiencies for the banking sector as a whole as well as for each bank category are presented in Table 3. The CE score of banks is 51.7%, which implies that the banking sector could have reduced the cost of production by 41.7% without affecting the level of output. In other words, banks have wasted 41.7% of resources in producing their levels of output. The AE is quite high (91.1%). This is consistent with the estimates reported for banks in most of the countries. The group of large banks is found to be least efficient in terms of CE as well as in terms of technical efficiency. The CE of foreign banks is found to be the most efficient for the entire groups (64.4%).
The time series estimates of the CE by bank categories presented in Table 4 also reveal that the group of foreign banks has performed better than domestic banks in terms of CE and TE in each year of the sample period. The gap in their efficiency levels has widened, especially from 2008 onwards. The AE of domestic banks is higher than the foreign banks. This implies that in terms of input use in response to input prices, the domestic banks are more efficient than their foreign counterparts. The group of small banks has outperformed all other domestic bank categories in terms of CE in almost all the sample years.
The annual efficiency scores for the banking sector as a whole. The latter are the weighted geometric mean of bank-specific scores where their shares in total output serve as weights. The CE score was low (53.9%) in the beginning of the sample period. The efficiency scores show an improvement trend with some fluctuations till 2000 and a declining thereafter until 2005, the reason for declining the cost and technical efficiency for the period (2000-2005) may be due to firstly, The Egyptian economy faced a serious currency liquidity crisis in 1999 prior to bank privatization. Secondly, in 2003 the Egyptian government decided to float the Egyptian pound against the US$ which increased the banks’ foreign exchange losses, particularly, those that have significant proportion of their investment portfolio in foreign currency. The CE for the whole banking sector showing improvement from 2005 till 2010. However, the CE declined
again from 2011 till 2013 and may be due the revaluation in Egypt in 2011. The highest CE score of 65.1% in the year (2000) of the sample period. While the bank timeline of major financial reforms in Egyptian banks from 1991 to 2013 are presented in Appendix Table A2.
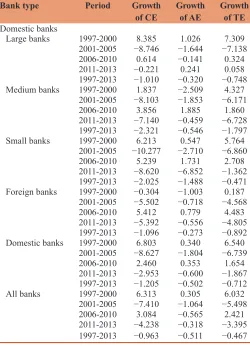
To understand how efficiency has changed over the sub-periods of financial reforms and how changes in allocative and technical efficiencies have contributed to it, we decompose the growth of CE as the sum of the growth of allocative and technical efficiencies using the relationship AE × TE = CE (see Equation 5). The decomposition estimates for broad categories of banks for the full period under study as well as four sub-periods 1997-2000, 2001-05, 2006-2010 and 2011-13, are presented in Table 5. These sub-periods represent the phases of financial deregulation/reform in Egyptian economy.
ln ( ) ln
( )
( )
( )
CE CE
AE AE CRS t
CRS t
VRS t VRS t
− −
= +
1 1
lln ( ) ( )
TE TE
t t−
1
(5)
The banking sector as a whole has experienced a decline in CE at the rate of 7.41% and 4.23% per annum respectively in the second and fourth phases of financial deregulation due to the decision of the Egyptian government to float the Egyptian pound against the US$ which increased the banks’ foreign exchange losses, particularly, those that have significant proportion of their investment portfolio in foreign currency in 2003, and due the revaluation in Egypt in 2011. In the early and middle phases, CE has increased at the rate of 6.31% and 3.08% per annum respectively, two thirds of this improvement from an improvement in technical efficiency.
Table 2: Assets of domestic and foreign banks in Egypt, (1997‑2013)
Bank category Bank name Short name Total assets (US millions)
Domestic
Large National Bank of Egypt NBE 15905295
Banque Misr BM 14758047.9
Bank du Caire BDC 8446256.8
Medium Commercial International Bank CIB 4011017.1
Suez Canal Bank SCB 2180494
Faisal Islamic Bank FIB 1838888
Housing and Development Bank HDB 1590305
Misr Iran Development Bank MIDB 1160970
Small Export Development Bank of Egypt EDB 691101.18
Al Baraka Bank Egypt ABE 461254.73
Societe Arabe Internationale de Banque SAIB 401020
Foreign National Societe Generale Bank NSGB 1164457
Arab African International Bank AAIB 997995
HSBC Egypt HSBC 636343.2
Source: Annual report for each bank 1997
Table 3: Sample period mean CE, AE and TE in Egypt (1997‑2013)
Bank categories CE AE TE
Large 0.457 0.927 0.488
Medium 0.548 0.852 0.636
Small 0.641 0.879 0.722
Foreign banks 0.644 0.862 0.744
Domestic banks 0.490 0.907 0.537
5. DETERMINANTS OF CE
In this section, we identify a set of variables that may affect the CE level of a bank. The potential variables of interest are drawn from a number of recent international studies on banking efficiency (e.g., Cavallo and Rossi, 2002; Hermes and Nhung, 2010; Pasiouras et al. 2009; Casu and Girardone, 2004; and Vu and Turnell, 2011). Our choices of variables may effects on the CE of the banks as follow:
LTD: It is the ratio of loans to deposits. It assesses a bank’s ability to transform deposits into loans. The higher this ratio, the more efficient the process of financial intermediation provided by the bank. For example, Vu and Turnell (2011) found a positive and statistically significant relationship between LTD and CE.
NIETA: It is the ratio of non-interest expense to total assets. NIETA measures the magnitude of administrative expenses. Banks that employ good management practices should be able to achieve lower administrative costs. Thus, it is expected that the higher the NIETA, the lower the CE of a bank.
ROE: It is the return on equity. The higher the return on equity will lead the bank to be more efficient.
NIM: Net interest margin. This variable is defined as the difference between interest income and interest expenses divided by total assets. This variable is expected to have a positive effect on efficiency, that is, the higher the NIM, The higher the NIM, the bank will be efficient.
Branches: Number of branches for each bank refers to network density. A high network density leads to higher structural overheads and thus may lower CE. The increase in the number of
Table 4: Estimates of CE by category of banks and ownership, 1997‑2013
Banks Eff 1997 1998 1999 2000 2001 2002 2003 2004 2005 2006 2007 2008 2009 2010 2011 2012 2013 Mean
Domestic banks
Large CE 0.484 0.504 0.579 0.622 0.579 0.542 0.457 0.419 0.402 0.405 0.395 0.392 0.397 0.414 0.410 0.452 0.412 0.457
AE 0.961 0.964 0.985 0.991 0.984 0.966 0.922 0.891 0.913 0.916 0.895 0.876 0.908 0.906 0.887 0.896 0.913 0.927
TE 0.503 0.523 0.588 0.627 0.587 0.558 0.492 0.470 0.439 0.441 0.435 0.436 0.424 0.446 0.452 0.498 0.447 0.488
Medium CE 0.649 0.751 0.767 0.686 0.642 0.575 0.490 0.442 0.458 0.471 0.494 0.430 0.479 0.555 0.575 0.568 0.448 0.548
AE 0.950 0.929 0.923 0.881 0.893 0.847 0.802 0.795 0.803 0.830 0.830 0.765 0.796 0.883 0.849 0.864 0.871 0.852
TE 0.678 0.808 0.830 0.772 0.713 0.668 0.598 0.553 0.567 0.567 0.592 0.551 0.593 0.622 0.659 0.642 0.508 0.636
Small CE 0.746 0.695 0.884 0.899 0.851 0.738 0.514 0.500 0.538 0.590 0.587 0.631 0.697 0.699 0.553 0.463 0.540 0.641
AE 0.941 0.941 0.950 0.957 0.920 0.908 0.885 0.885 0.835 0.871 0.875 0.867 0.909 0.911 0.810 0.773 0.742 0.879
TE 0.779 0.730 0.913 0.926 0.909 0.802 0.576 0.568 0.657 0.681 0.663 0.709 0.752 0.753 0.677 0.584 0.723 0.722
Foreign
banks CE 0.737 0.749 0.700 0.730 0.670 0.593 0.496 0.447 0.554 0.546 0.651 0.791 0.720 0.727 0.663 0.675 0.618 0.644 AE 0.891 0.896 0.914 0.864 0.894 0.835 0.816 0.817 0.834 0.882 0.872 0.882 0.862 0.867 0.837 0.846 0.853 0.862
TE 0.830 0.837 0.763 0.834 0.742 0.705 0.605 0.551 0.664 0.622 0.746 0.887 0.831 0.831 0.790 0.794 0.719 0.744
Domestic
banks CE 0.528 0.564 0.630 0.647 0.605 0.558 0.467 0.428 0.420 0.428 0.425 0.416 0.442 0.476 0.465 0.487 0.435 0.490 AE 0.958 0.956 0.971 0.968 0.962 0.937 0.894 0.868 0.884 0.895 0.880 0.851 0.878 0.900 0.871 0.877 0.884 0.907
TE 0.550 0.592 0.651 0.669 0.628 0.594 0.519 0.494 0.478 0.481 0.479 0.479 0.494 0.519 0.524 0.547 0.490 0.537
ALL
banks CE 0.539 0.574 0.634 0.651 0.608 0.560 0.469 0.450 0.449 0.454 0.469 0.487 0.499 0.524 0.508 0.521 0.462 0.517 AE 0.955 0.953 0.968 0.963 0.959 0.932 0.890 0.907 0.913 0.917 0.898 0.865 0.880 0.888 0.864 0.871 0.880 0.911
TE 0.564 0.605 0.656 0.676 0.634 0.600 0.524 0.522 0.514 0.510 0.531 0.557 0.564 0.580 0.582 0.592 0.524 0.570 CE: Cost efficiency; AE: Allocative efficiency; TE: Technical efficiency
Table 5: Average annual growth rates of CE by bank category in sub periods
Bank type Period Growth
of CE Growth of AE Growth of TE
Domestic banks
Large banks 1997-2000 8.385 1.026 7.309 2001-2005 −8.746 −1.644 −7.138 2006-2010 0.614 −0.141 0.324 2011-2013 −0.221 0.241 0.058 1997-2013 −1.010 −0.320 −0.748
Medium banks 1997-2000 1.837 −2.509 4.327
2001-2005 −8.103 −1.853 −6.171 2006-2010 3.856 1.885 1.860 2011-2013 −7.140 −0.459 −6.728 1997-2013 −2.321 −0.546 −1.797
Small banks 1997-2000 6.213 0.547 5.764 2001-2005 −10.277 −2.710 −6.860 2006-2010 5.239 1.731 2.708 2011-2013 −8.620 −6.852 −1.362 1997-2013 −2.025 −1.488 −0.471
Foreign banks 1997-2000 −0.304 −1.003 0.187 2001-2005 −5.502 −0.718 −4.568 2006-2010 5.412 0.779 4.483
2011-2013 −5.392 −0.556 −4.805 1997-2013 −1.096 −0.273 −0.892
Domestic banks 1997-2000 6.803 0.340 6.540 2001-2005 −8.627 −1.804 −6.739 2006-2010 2.460 0.353 1.654 2011-2013 −2.953 −0.600 −1.867 1997-2013 −1.205 −0.502 −0.712
All banks 1997-2000 6.313 0.305 6.032 2001-2005 −7.410 −1.064 −5.498 2006-2010 3.084 −0.565 2.421
2011-2013 −4.238 −0.318 −3.395 1997-2013 −0.963 −0.511 −0.467 CE: Cost efficiency; AE: Allocative efficiency; TE: Technical efficiency
branches also enables the banks to use their branch network as a barrier against the entry of new banks, which may lead to higher profit. Thus the effect of this variable on efficiency could be in either direction depending on the effectiveness of service provided to the consumers. In their dataset, for medium sized bank Maudos et al. (2002) find a negative and significant relationship between number of branches and CE. At the same time, for all other bank categories, they find that the number of branches does not have any significant effect on CE. Also there is a correlation between total assets (proxy for bank size) and number of branches. In other word, size of the bank can be known from the number of branches.
Age: The age of the bank is used to reflect the maturity of bank. We expect that ceteris paribus, more mature banks would be more efficient than the younger or newly opened banks.
5.1. The Model and Estimation Strategy
Consider a random sample of i=1,…, N banks observed over a duration of T consecutive years with time index t=1,…, T years and let CE be represented by CE, the fractional variable of interest, 0≤CE≤1, and x= (LTA, LTD, NIETA, ROE, NIM, BRANCHES) be a vector of six covariates discussed above. Let β be the vector of parameters to be estimated and f CE x( | ,β)denote the conditional
density of CE.
Many applied economists assume a linear conditional mean model for CE:
E CE x( / )=xβ (6)
However, given that the dependent variable CE is strictly bounded from above and below, it is not reasonable to assume that the effect of any explanatory variable is constant throughout its entire range. Further, the linear specification does not automatically guarantee that the predicted values of CE lie between 0 and 1 without severe constraints on the range of x or arbitrary modifications to fitted values outside the unit interval.
In order to tackle this problem empirical economist use logistic relationship:
E CE x e
e x x ( / )= + β β 1 (7)
Since it ensures that 0 <E CE x( / )<1. However Equation (7) is
not directly estimated but it is transformed into log-odds model,
E CE
CE x x
ln 1−
= β (8)
And then the estimation is done using OLS. There are two major shortcomings of the above model; (i) Recovering E CE x( / )
from (8) is not straight foreword (see Papke and Wooldridge, 1996 on p. 620 for details) and (ii) Equation (8) is not well defined for boundary values 0 and 1 of CE. Since the DEA based frontier estimator always classifies at least one firm to be fully efficient (with CE=1), Equation (8) cannot be used in this case.
Some authors use two-limit Tobit model in order to restrict the predicted efficiency scores to be between 0 and 1. However, this
model can only be applied if observations are available for both limits, which is often not the case2 in most efficiency studies. Furthermore, the Tobit model imposes restrictive assumptions on the dependent variable. That is, it assumes normality and homoskedasticity of the dependent variable, prior to censoring.
For fractional dependent variables, Papke and Wooldridge (1996) have developed a simple estimation methodology. Their methodology does not require manipulating the dependent variable, when it takes the extreme value of zero or one. The conditional expectation of dependent variable given the independent variables can be estimated in a straightforward manner. Furthermore, the predicted values of the dependent variable always lie between zero and one.
Papke and Wooldridge (1996) use the following Bernoulli log-likelihood function:
lit( )β ≡CEitlogG x
(
itβ)
+ −(
1 CEit)
log1−G x(
itβ)
(9)Where 0 < G(.) < 1 is a logit function. The estimates3 for the
parameter β can be obtained by maximizing the log-likelihood for the entire sample of 14 Egyptian banks covering the deregulation period 1996-2007. In other word, the maximization problem can be written as:
max ( )
β lit β
i t=
∑
=∑
1 17 1 12 (10)The estimated variance-covariance matrix is given by
1 1
ˆ ˆ
ˆ= − ˆ −
V A BA where A and B are given by
1 2 ' 1
1 1
ˆ ( )− ˆ [ (1ˆ ˆ )]−
= =
= ×
∑∑
N T it it it it − iti t
A N T g x x G G and
1 2 2 ' 2
1 1
ˆ ˆ
ˆ ( )− ˆ ˆ [ (1 )]−
= =
= ×
∑∑
N T it it it it it − it i tB N T u g x x G G
respectively, Where Gˆit =G x( itβˆ), gˆit =g x( itβˆ), g x( β)= ∂G x( β) ∂xβ and uit =CEit−CE^it.
5.2. Results
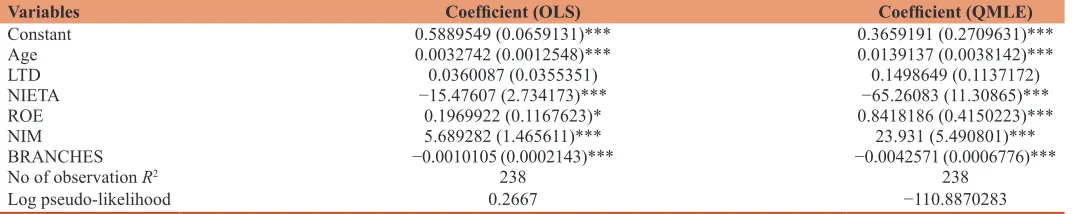
The regression estimates obtained using method developed by Papke and Wooldridge (1996). Presented in Table 6 are the regression coefficients obtained from OLS and quasi-maximum likelihood estimator based on Equation (9).
The coefficient of age is estimated to be positive and significant, indicating that more mature banks would be more efficient than the younger or newly opened banks. The negative and significant coefficient of NIETA implies that higher administrative cost leads to a decrease in CE.
2 In the efficiency studies where DEA estimator is used to compute the efficiency scores, at least one would be classified to be fully efficient. However, in most DEA based efficiency studies, one rarely comes across a firm whose estimated efficiency score is 0.
The positive and significant sign of ROE suggests that banks which are more profitable are more cost efficient. At the first instance this result means that higher the ROE, the more cost efficient the bank is. ROE indicates how well bank management is using the investors’ capital. However, it turns out, that a bank can grow earnings faster than its current ROE without raising additional cash. That is, a bank that now has a 5% ROE can increase its earnings faster than 5% annually without borrowing funds or selling more shares.
Further, as expected the positive and significant sign of NIM indicates that banks which are more profitable are more cost efficient. Finally, a negative and significant coefficient on Branches suggests banks with a bigger network of branches are relatively cost inefficient possibly due to higher structural overloads.
6. CONCLUSIONS
Our research adopt two-stage approaches, in which CE scores are estimated in the first stage using input oriented DEA, and in the second stage we study the potential determinants of CE. We estimate the level of CE in 14 Egyptian banks using annual data for 1997-2013. The CE is decomposed into allocative and technical efficiency levels.
The CE score was (53.9%) in the beginning phase of the sample period. The efficiency scores show an improvement trend with some fluctuations till 2000 and a declining thereafter until 2005, the reason for declining the cost and technical efficiency for the period (2000-2005) due to the serious currency liquidity crisis faced by Egyptian economy in 1999 prior to bank privatization, in the other hand, the Egyptian government decided to float the Egyptian pound against the US$ in 2003 which increased the banks’ foreign exchange losses, particularly, those that have significant proportion of their investment portfolio in foreign currency. The CE for the whole banking sector showing improvement from 2005 till 2010. However, the CE declined again from 2011 till 2013 and may be due the revaluation in Egypt in 2011. The highest CE score of 65.1% in the year (2000) of the sample period. While the bank timeline of major financial reforms in Egyptian banks from 1991 to 2013.
In the second stage we further analyze the factors rolling critically in shaping the CE of Egyptian banks. The results reveal that net interest margins and bank branches are the main determinants cost efficiencies of Egyptian banks. Thus, the policy implications for the banking sector to improve CE are: (a) To
minimize administrative and the overhead cost, (b) to develop an understanding of the forces affecting the net interest margin in order to avoid major surprises.
REFERENCES
Jreisat, A., Barghouthi, S. (2015), ‘An Investigation into the determinants of cost efficiency in the Jordan Banks’ journal of Arts Science & Commerce, 6(1), 73-87.
AlKhathlan, K., Malik, S. (2010), Are Saudi banks efficient? Evidence using Data Envelopment Analysis (DEA). International Journal of Economics and Finance, 2(2), 53-58.
Badreldin, A., Kalhoefer, C. (2009), The effect of mergers and acquisitions
on bank performance in Egypt. German University in Cairo, Faculty
of Management Technology Working Paper No. 18. Egypt, Cairo:
German University in Cairo.
Berger, A.N., Mester, L.J. (1997), Inside the black box: What explains differences in the efficiencies of financial institutions? Journal of Banking and Finance, 21, 895-947.
Casu, B., Girardone, C. (2004), Financial conglomeration: Efficiency,
productivity and strategic drive. Applied Financial Economics, 14, 687-696.
Cavallo, L., Rossi, S.P.S. (2002), Do environmental variables affect the performance and technical efficiency of European banking systems?
A parametric analysis using the stochastic frontier approach. European Journal of Finance, 8, 123-146.
Central Bank of Egypt, editor. (1996), Annual Report 1995/1996. Cairo:
Central Bank of Egypt.
Central Bank of Egypt, editor. (2001), Annual Report 2000/2001. Cairo:
Central Bank of Egypt.
Central Bank of Egypt, editor. (2005), Annual Report 2004/2005. Cairo:
Central Bank of Egypt.
Central Bank of Egypt, editor. (1996), Annual Report 2009/2010. Cairo:
Central Bank of Egypt.
Central Bank of Egypt, editor. (2014), Annual Report 2013/2014. Cairo:
Central Bank of Egypt.
Chen, X., Skully, M., Brown, K. (2004), Banking efficiency in China: Application of DEA to pre- and post-deregulation eras: 1993-2000. China Economic Review, 16, 229-245.
Coelli, T. (1996), A Guide to DEAP Version 2.1: A Data Envelopment Analysis (Computer) Program, CEPA Working Paper, 96/08.
Department of Economics, University of New England, Australia.
Coelli, T.J., Prasada Rao, D.S., O’Donnell, C.J., Battese, G.E. (2005), An Introduction to Efficiency and Productivity Analysis. 2nd ed.
New York: Springer. p366.
Colwell, R., Davis, E. (1992), Output and productivity in banking.
Scandinavian Journal of Economics, 94, 111-129.
Cooper, W.W., Seiford, L.M., Tone, K. (2000), Data Envelopment
Analysis: A Comprehensive Text with Models, Applications,
Table 6: Estimates of regression model
Variables Coefficient (OLS) Coefficient (QMLE)
Constant 0.5889549 (0.0659131)*** 0.3659191 (0.2709631)***
Age 0.0032742 (0.0012548)*** 0.0139137 (0.0038142)***
LTD 0.0360087 (0.0355351) 0.1498649 (0.1137172)
NIETA −15.47607 (2.734173)*** −65.26083 (11.30865)***
ROE 0.1969922 (0.1167623)* 0.8418186 (0.4150223)***
NIM 5.689282 (1.465611)*** 23.931 (5.490801)***
BRANCHES −0.0010105 (0.0002143)*** −0.0042571 (0.0006776)***
No of observation R2 238 238
Log pseudo-likelihood 0.2667 −110.8870283
References and DEA-Solver Software. Boston: Kluwer Academic
Publishers.
Farrell, M.J. (1957), The measurement of productive efficiency. Journal of the Royal Statistical Society, 120, 253-281.
Favero, C.A., Papi, L. (1995), Technical efficiency and scale efficiency
in the Italian banking sector: A non-parametric approach. Applied
Economics, 27, 385-395.
Ferrier, G.D., Lovell, C.A.K. (1990), Measuring cost efficiency in
banking: Econometric and linear programming evidence. Journal
of Econometrics, 46, 229-245.
Hassan, M., Al-Sharkas, A., Samad, A. (2004), An empirical study of relative efficiency of the banking industry in Bahrain. Studies in Economics and Finance, 22, 40-69.
Hermes, N., Nhung, V.T. (2010), The impact of financial liberalization on bank efficiency: Evidence from Latin America and Asia. Applied Economics, 42, 3351-3365.
Jafrry, S., Ghulam, Y., Cox, J., (2013), Trends in efficiency in response to
regulatory reforms: The case of Indian and Pakistani banks. European
Journal of Operational Research, 226, 122-131.
Jreisat, A., Barghouthi, S., Othman, M. (2015), Measuring cost efficiency
in the Jordanian banks: A comparison of SFA and DEA. International
Research Journal of Finance and Economics, 133, 145-149.
Jreisat, A., Paul, S. (2010), Banking efficiency in the middle East: A survey
and new result for Jordanian banks. International Journal of Applied
Business and Economic Research, 8(2), 191-209.
Maudos, J., Pastor, J.M., Perez, F., Quesada, J. (2002), Cost and profit efficiency in European banks. Journal of International Financial Markets, Institutions and Money, 12, 33-58.
Papke, L.E., Wooldridge, J.M. (1996), Econometric methods for fractional response variables with an application to 401(K) plan participation rates. Journal of Applied Econometrics, 11(6), 619-632.
Pasiouras, F., Tanna, S., Zopounidis, C. (2009), The impact of banking regulations on banks Cost and profit efficiency: Cross-country evidence. International Review of Financial Analysis, 18, 294-302.
Reda, M. (2013), The Effect of Mergers and Acquisitions on Bank Efficiency: Evidence from Bank Consolidation in Egypt. Working Paper 770, The Egyptian Center for Economics Studies.
United Nations. (2005), Economic Trends and Impacts, Banking Sector Lending Behaviour and Efficiency in Selected. Paper Presented at the ESCWA, New York. p3.
Table A1: DEA estimates of cost efficiency for domestic and foreign banks of Egypt, 1997‑2013
Bank Eff 1997 1998 1999 2000 2001 2002 2003 2004 2005 2006 2007 2008 2009 2010 2011 2012 2013 Mean
Large
NBE TE 0.559 0.59 0.714 0.768 0.71 0.652 0.575 0.547 0.515 0.553 0.575 0.57 0.49 0.50 0.489 0.529 0.465 0.571
AE 0.992 0.992 0.992 0.999 0.999 0.998 0.974 0.896 0.944 0.926 0.934 0.941 0.996 0.984 0.988 0.963 0.992 0.971
CE 0.554 0.585 0.708 0.767 0.709 0.65 0.56 0.49 0.486 0.512 0.537 0.536 0.488 0.492 0.483 0.51 0.462 0.554
BM TE 0.385 0.414 0.478 0.499 0.47 0.455 0.413 0.379 0.328 0.279 0.28 0.255 0.233 0.256 0.306 0.365 0.35 0.352
AE 0.951 0.964 0.993 0.978 0.97 0.942 0.885 0.90 0.898 0.91 0.848 0.798 0.737 0.732 0.633 0.732 0.736 0.852
CE 0.366 0.40 0.474 0.488 0.455 0.429 0.365 0.341 0.294 0.254 0.237 0.203 0.172 0.187 0.193 0.267 0.257 0.300
BDC TE 0.61 0.587 0.508 0.529 0.464 0.496 0.449 0.462 0.463 0.495 0.445 0.54 0.575 0.579 0.507 0.529 0.494 0.511
AE 0.913 0.905 0.955 0.997 0.969 0.918 0.864 0.85 0.861 0.886 0.912 0.877 0.831 0.84 0.771 0.788 0.778 0.875
CE 0.557 0.531 0.485 0.527 0.45 0.456 0.388 0.393 0.399 0.438 0.406 0.473 0.478 0.486 0.391 0.417 0.384 0.447
Medium
CIB TE 0.851 1.00 1.00 0.94 0.797 0.698 0.651 0.637 0.64 0.649 0.639 0.521 0.594 0.676 0.703 0.707 0.501 0.704
AE 0.997 0.942 0.924 0.885 0.888 0.839 0.795 0.766 0.77 0.805 0.791 0.675 0.745 0.851 0.866 0.891 0.793 0.833
CE 0.849 0.942 0.924 0.831 0.707 0.586 0.517 0.488 0.492 0.522 0.506 0.352 0.442 0.575 0.609 0.63 0.397 0.586
SCB TE 0.749 0.781 0.853 0.867 0.899 0.899 0.805 0.683 0.677 0.706 0.551 0.56 0.609 0.524 0.544 0.474 0.436 0.667
AE 0.99 0.977 0.989 0.98 0.972 0.952 0.945 0.924 0.93 0.866 0.798 0.818 0.811 0.831 0.745 0.807 0.795 0.886
CE 0.741 0.763 0.844 0.85 0.873 0.856 0.761 0.631 0.63 0.611 0.44 0.458 0.494 0.436 0.405 0.382 0.346 0.591
FIB TE 0.49 0.69 0.692 0.568 0.53 0.493 0.389 0.371 0.39 0.367 0.518 0.496 0.539 0.548 0.611 0.576 0.508 0.507
AE 0.89 0.907 0.875 0.753 0.819 0.759 0.701 0.752 0.725 0.822 0.794 0.72 0.856 0.974 0.955 0.876 0.909 0.825
CE 0.436 0.626 0.606 0.428 0.434 0.374 0.273 0.279 0.282 0.302 0.411 0.357 0.461 0.534 0.583 0.504 0.462 0.418 HDB TE 0.442 0.469 0.528 0.557 0.509 0.514 0.486 0.455 0.447 0.523 0.61 0.569 0.38 0.327 0.302 0.278 0.27 0.438
AE 0.995 0.988 0.99 0.993 0.968 0.942 0.907 0.876 0.938 0.911 0.986 0.975 0.676 0.723 0.579 0.585 0.59 0.844
CE 0.439 0.463 0.523 0.553 0.492 0.484 0.441 0.399 0.419 0.477 0.601 0.554 0.257 0.236 0.175 0.163 0.16 0.370
MIDB TE 0.639 0.698 0.678 0.633 0.543 0.635 0.613 0.668 0.78 0.68 0.711 0.868 1.00 1.00 0.988 0.994 0.885 0.751
AE 0.355 0.388 0.444 0.436 0.427 0.382 0.416 0.571 0.757 0.802 0.995 0.996 0.953 1.00 0.999 0.999 0.985 0.645
CE 0.227 0.271 0.301 0.276 0.232 0.242 0.255 0.381 0.591 0.545 0.708 0.864 0.953 1.00 0.987 0.993 0.871 0.485
Small
EDB TE 0.874 0.738 1.00 1.00 1.00 0.851 0.537 0.463 0.494 0.541 0.547 0.58 0.593 0.59 0.604 0.539 0.521 0.652
AE 0.982 0.985 1.00 1.00 0.952 0.956 0.986 1.00 0.973 0.998 0.764 0.685 0.789 0.784 0.695 0.71 0.708 0.871
CE 0.858 0.726 1.00 1.00 0.952 0.813 0.529 0.463 0.48 0.54 0.418 0.397 0.468 0.463 0.42 0.383 0.369 0.567
ABE TE 0.868 0.89 0.892 0.919 0.902 0.917 0.843 0.853 0.868 0.92 0.982 1.00 0.995 1.00 0.745 0.404 0.911 0.862
AE 0.964 0.973 0.983 0.991 0.994 0.935 0.881 0.875 0.882 0.917 0.936 1.00 0.995 0.997 0.749 0.714 0.735 0.908
CE 0.836 0.866 0.877 0.91 0.897 0.858 0.743 0.746 0.766 0.843 0.919 1.00 0.99 0.997 0.558 0.288 0.669 0.783
SAIB TE 0.384 0.503 0.576 0.604 0.535 0.573 0.464 0.497 0.71 0.651 0.532 0.631 0.745 0.753 0.712 0.769 0.83 0.604
AE 0.794 0.775 0.71 0.722 0.718 0.746 0.553 0.643 0.598 0.669 0.945 0.991 0.978 0.992 0.981 0.891 0.782 0.781
CE 0.305 0.39 0.409 0.436 0.384 0.428 0.257 0.32 0.425 0.435 0.502 0.625 0.729 0.746 0.699 0.685 0.649 0.471
Foreign
NSGB TE 0.813 0.81 0.751 0.781 0.668 0.602 0.522 0.529 0.606 0.577 0.626 0.767 0.713 0.718 0.758 0.767 0.674 0.681
AE 0.985 0.984 0.988 0.901 0.979 0.842 0.718 0.66 0.83 0.89 0.892 0.792 0.823 0.803 0.746 0.741 0.76 0.837
CE 0.801 0.797 0.742 0.704 0.655 0.508 0.375 0.349 0.503 0.513 0.559 0.608 0.587 0.577 0.565 0.568 0.512 0.570
AAIB TE 0.859 0.85 0.723 0.756 0.654 0.691 0.543 0.484 0.722 0.637 0.899 1.00 0.918 0.928 0.829 0.817 0.771 0.757
AE 0.769 0.757 0.708 0.69 0.602 0.721 0.921 0.983 0.878 0.934 0.912 1.00 0.969 0.981 0.998 0.981 0.948 0.858
CE 0.661 0.644 0.512 0.522 0.394 0.498 0.50 0.476 0.635 0.595 0.82 1.00 0.89 0.911 0.828 0.802 0.731 0.649 HSBC TE 0.796 0.863 0.816 1.00 0.888 0.845 0.773 0.667 0.69 0.725 0.763 0.923 0.931 0.914 0.805 0.834 0.778 0.820
AE 0.972 0.955 0.999 0.986 0.971 0.918 0.841 0.803 0.778 0.768 0.759 0.846 0.796 0.848 0.84 0.944 0.989 0.879
CE 0.774 0.824 0.815 0.986 0.862 0.776 0.651 0.536 0.536 0.556 0.578 0.78 0.741 0.775 0.676 0.788 0.769 0.720 CE: Cost efficiency; AE: Allocative efficiency; TE: Technical efficiency, NBE: National Bank of Egypt, BM: Banque Misr, BDD: Bank du Caire, CIB: Commercial International Bank, SCB: Suez Canal Bank, FIB: Faisal Islamic Bank, HDB: Housing and Development Bank, MIDB: Misr Iran Development Bank, ABE: Al Baraka Bank Egypt, SAIB: Societe Arabe Internationale de Banque, NSGB: National Societe Generale Bank, AAIB: Arab African International Bank, HSBC: HSBC Egypt
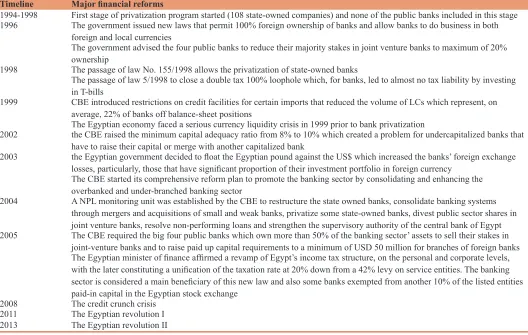
Table A2: Timeline of major financial reforms in Egypt from 1994 to 2013
Timeline Major financial reforms
1994-1998 First stage of privatization program started (108 state-owned companies) and none of the public banks included in this stage
1996 The government issued new laws that permit 100% foreign ownership of banks and allow banks to do business in both
foreign and local currencies
The government advised the four public banks to reduce their majority stakes in joint venture banks to maximum of 20%
ownership
1998 The passage of law No. 155/1998 allows the privatization of state-owned banks
The passage of law 5/1998 to close a double tax 100% loophole which, for banks, led to almost no tax liability by investing
in T-bills
1999 CBE introduced restrictions on credit facilities for certain imports that reduced the volume of LCs which represent, on
average, 22% of banks off balance-sheet positions
The Egyptian economy faced a serious currency liquidity crisis in 1999 prior to bank privatization
2002 the CBE raised the minimum capital adequacy ratio from 8% to 10% which created a problem for undercapitalized banks that have to raise their capital or merge with another capitalized bank
2003 the Egyptian government decided to float the Egyptian pound against the US$ which increased the banks’ foreign exchange losses, particularly, those that have significant proportion of their investment portfolio in foreign currency
The CBE started its comprehensive reform plan to promote the banking sector by consolidating and enhancing the overbanked and under-branched banking sector
2004 A NPL monitoring unit was established by the CBE to restructure the state owned banks, consolidate banking systems
through mergers and acquisitions of small and weak banks, privatize some state-owned banks, divest public sector shares in
joint venture banks, resolve non-performing loans and strengthen the supervisory authority of the central bank of Egypt
2005 The CBE required the big four public banks which own more than 50% of the banking sector’ assets to sell their stakes in joint-venture banks and to raise paid up capital requirements to a minimum of USD 50 million for branches of foreign banks The Egyptian minister of finance affirmed a revamp of Egypt’s income tax structure, on the personal and corporate levels, with the later constituting a unification of the taxation rate at 20% down from a 42% levy on service entities. The banking sector is considered a main beneficiary of this new law and also some banks exempted from another 10% of the listed entities
paid-in capital in the Egyptian stock exchange
2008 The credit crunch crisis
2011 The Egyptian revolution I
2013 The Egyptian revolution II