Zhichun Li, Anup Goyal, and Yan Chen Northwestern University, Evanston, IL 60208
{lizc,ago210,ychen}@cs.northwestern.edu
1 Introduction
With the increasing importance of Internet in everyone’s daily life, Internet security poses a serious problem. Nowadays, botnets are the major tool to launch Internet-scale attacks. A “botnet” is a network of compromised machines that is remotely controlled by an attacker. In contrast of the earlier hacking activities (mainly used to show off the attackers’ technique skills), botnets are better organized and mainly used for the profit-centered endeavors. For example, the attacker can make profit through Email spam [16], click fraud [6], game accounts and credit card numbers harvest, and extortion through DoS attacks.
Although thorough understanding and prevention of botnets are very important. Currently, the research community gains only limited insight into botnets.
Several approaches can help to understand the botnet phenomena:
Source code study is to examine the botnets’ source code, given that the most
fa-mous bot sources are under GPL. This can give us an insight about all the mali-cious activities that can be achieved by the botnet. However, there are different versions of botnets and major versions have different variants. It is hard to study all their source codes, given many of them might not be obtained in the first place. Another problem is that this approach only gives us the static features of botnets, but not the dynamic features, such as the size of botnets, the geological distribution of the bots, etc.. However this study can give us some insight into their current functionalities and how they achieve that.
Command and Control study is the study of IRC traffic or other communication
protocols that botnets use for communication. Potentially, this approach can be used to observe the global view, if the traffic of IRC command and control chan-nel can be sniffed. However, the trend has moved towards using private IRC servers or other communication protocols, such as WEB or P2P. Moreover, a more fundamental problem is that botnets may encrypt their command and con-trol channels. The covert channel detection could be extremely difficult.
Controlling botnet is to gain the control of the botnet, so that we can have a global
view and study its behavior. Usually, researchers limited their approach to either set up or buy a botnet. Another way is to hijack the botnets’ DDNS entries [5]. However, this is dependent on whether the DDNS vendors are willing to coop-erate and whether the DDNS names can be detected.
Behavior study is the study of the botnet by observing their behaviors. For example,
botnet scanning, botnet based DoS attack, botnet based spam, botnet based click fraud etc.. This study usually can capture dynamic features and measurements become easier.
We are interested in developing a general technique which has a minimum mon-itoring overhead for observing botnet behavior, and hard to evade by botnets. There-fore, people from any corner around the world can easily adopt it to measure the characteristics of the botnet behavior. If we could aggregate the measurements, po-tentially we can get a more accurate global picture of the botnets. After carefully analyzing the above behavioral list, we found that the botnet scanning behavior is ingrained to the botnet because this is the most effective way for them to recruit new bots. Therefore, we believe in near future, the botmaster will not give up scanning. Moreover, monitoring scanning is relatively easy. With a honeynet installed people can easily get the botnet scanning traffic.
With this motivation, we designed a general paradigm to extract botnet related scanning events and analyzing methods. We further analyzed one year honeynet traf-fic from a large research institution to demonstrate the methods.
In [15], three types of scanning strategies of botnets have been introduced: local-ized scanning, targeted scanning and uniform scanning. Locallocal-ized scanning is that each bot chose the scanning range based their own IP prefixes. Targeted scanning is that the botmaster specified a particular IP prefix for bots to scan. The uniform scan-ning is the botnet scanscan-ning the whole Internet. Here, we call the targeted scanscan-ning and the uniform scanning as global scanning, since usually it is hard to determine the scanning range of a botnet. In the honeynet, the global scanning events can be easily identified since it usually related to large number of sources. However, the localized scanning is quite hard to identify. It is hard to differentiate whether it is a single scanner or it is part of a large botnet.
In this chapter, we mainly studied the botnet scanning behaviors, and use its scanning behavior to infer the general properties of botnets. Scanning is the major tool for recruiting new bots. In our study we found out that 75% of the successful botnet scanning events followed by the malicious payloads. Understanding the bot-net scanning behavior is very important since it will help us to understand how to detect/prevent botnet propagation. Moreover, we can gain insight into the general properties of botnets through this study. Because of the prevalence of botnet scan activities, we believe that scan based botnet property inference is also very general.
In this book chapter we mainly wanted to answer the following questions.
• How to use botnet scan behavior to infer the general properties of the botnets?
• How to extract the botnet scan events?
• What are the different scan strategies used by the botnets and how these related to dynamic behavior of the bots?
In this book chapter, we demonstrated that the botnet scan traffic can be very useful in terms of inferring the general properties of the botnets. We developed a general paradigm for botnet scan event extraction. Based on it we analyzed one year honeynet traffic. In our study, we found that the bot population is highly diverse. Al-though, 41% of bots come form top 20 ASes, but the total population is from 2860 ASes. But the bot population is pretty concentrated in certain IP ranges, which con-firmed the conclusion from botnet spamming study [16]. The IP range distributions have high variance from botnets to botnets. This implies the IP blacklist might not always be effective for different botnets. In most cases, the scan arrival follows a Poisson process and the inter arrival time follow an exponential distribution. This suggested that the bots scan randomly and the scan range is much larger than the sensor size. We found there are two clear modes for bots to arrive. They either arrive mostly at the very beginning or they are pretty evenly distributed in the whole scan event duration. This might due to different scan strategies the botmasters used. We also found some very complex scan strategies used by the botmasters.
The rest of this book chapter is organized as follows. We discussed the related work in Section 2. Section 3 described the design of the general botnet scan event ex-traction paradigms. Section 5 discussed our findings of analyzing botnet scan events extracted from one year honeynet traffic from a large research institution. Finally, Section 6 stated the conclusions.
2 Related Work
Currently, most botnet studies leverage on two approaches: IRC channel monitor-ing [3, 15] and DNS hijackmonitor-ing [5, 16]. If the botnet uses an IRC based command and control mechanism and does not encrypt the channel, potentially a faked bot can be inserted into the channel to monitor the botnet behavior. To be really useful, this fur-ther requires the botnet IRC channel allows message broadcasting, so that a bot can hear the information of other bots. Obviously, this approach can get the botnet be-havior from a “insider’s perspective”. However, given the trend of botnet command and control mechanisms are changing towards WEB [14] or P2P [7] based approach. This approach might bias the study towards the characteristics of IRC based botnets. If we can know the domain name of a botnet’s command and control server, and we can convince the domain name service provider to redirect the domain name to another system, potentially we can hijack the botnet and control it by ourselves. In this way, we can fully control the botnet and study its behavior. However, usually to find the domain name and convince the DNS service provider to redirect the do-main name for us is not always easy, especially when the botnet use a DNS service provider in a foreign country.
Botnets have been used for cyber-crimes for quite some time, but studies on bot-net detection are sparse. Known techniques for botbot-net detection includes honeybot-nets
and IDS system with signature detection. Honeynets [12] or darknets can be proved useful in studying botnet behavior, but cannot track the actual infected host. Signa-ture matching and behavior of existing botnet can be used for detection. An open-source system like Snort [8] can be used for detection of known botnets. Signature matching has its own disadvantage that it can be easily fooled by smart bots and also fails for new botnets. [2] has suggested an anomaly-based detection method, which combine an IRC mesh detection component with a TCP scan detection heuristic for detecting botnet attacks. However, this system suffers from false positive and could be evaded by simple encoding of IRC channel. Another interesting work for finding botnet membership is by using DNSBL Counter-Intelligence [17]. This method is limited to the detection of spamming botnets and it is computationally expensive and memory intensive.
As [3] firstly suggested that botnet propagation and attack behavior can be an-other way to study the botnets. We mainly studied the scan behavior of botnets and through it we inferred the general properties of botnets. We argue this also is a very important angle, since most botnets leverage on scanning and exploiting the vulnera-ble hosts to recruit new bots. Therefore, it is a very common behavior of the botnets. Understand it better will help us improve the botnet detection/prevention. Since the botnet scanning activities are prevalence, it is also a general way to infer the proper-ties of botnets. In [19], they mainly infer the difference between the botnet scanning event with worm propagation and misconfigurations. Here, we focused on using the scanning events to understand the botnet scan behavior and botnet proprieties in gen-eral.
Most general honeynet [1, 13, 20] and honeyfarm [4, 18] approach can be used to monitor the botnet scanning behavior. A large continuous IP space is good for mon-itoring the botnet global scan, i.e., scan a given IP prefix which is different from the bots’ IP prefix. A distributed honeynet/honeyfarm can be better in terms of monitor-ing local scan activities in which case each bot scan their local prefixes.
3 Botnet Scanning Event Identification
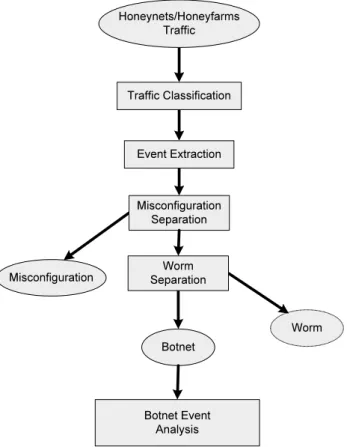
Figure 1 shows the botnet event extraction and analysis paradigm. To understand the botnet scanning behavior, we first extract coordinated scanning events from the honeynet traffic. A botnet scan event is a large scale coordinated scanning event which normally has to employ large number of bots. We use the large number of unique sources contacting the honeynet as an indicator of the botnet scanning. Then, we separate the misconfiguration and worm cases from botnet cases. We focus on the analysis of botnet events
3.1 Honeynet and Data Collection
Traffic sent to unused Internet addresses (“darknets”) can reflect a variety of activity. We cannot determine the nature of the activity by simply watching it passively as probes arrive because the specifics of most forms of activity only manifest after the
Misconfiguration Botnet Worm Misconfiguration Separation Honeynets/Honeyfarms Traffic Traffic Classification Event Extraction Worm Separation Botnet Event Analysis
Fig. 1. Botnet event extraction and analysis paradigm
source establishes a connection (or, sometimes, a whole set of connections compris-ing a session) with the destination. As a general approach, we can take traffic sent to unresponsive darknets and channel it to a honeypot system that will respond in some fashion. Such a combination is often referred to as a honeynet. Honeynet sys-tems can employ low- or medium-interaction honeypots [1, 13], which provide fake responses of varying detail, and thus can elicit a range of possible activity from the sender. Going further, one can employ high-interaction honeypots (full, infectible systems, often running inside virtual machines), which when coupled with a hon-eynet is termed as a honeyfarm [4, 18].
Our analysis is based on one year (2006) honeynet data from a large research in-stitution. The honeynet has ten continuous class C networks. The half of the sensor is dark which means no response to any incoming packets and the second half accom-panied with Honeyd responder which simulate most popular protocols and respond the SYN/ACK packets to the unknown protocols. The configuration is similar to the ones used in [10, 19]. We also adapt the source-destination filtering [10].
3.2 Traffic Classification
Some attack traffic can have complex session structures involving multiple applica-tion protocols. For example, the attacker can send an exploit to TCP port 139 which, if successful, results in opening a shell and issuing a http download command. In general, the application protocol contacted first is the protocol being exploited, so we label the entire session with the first protocol used. This also provides consistent labeling for those connection attempts in which the honeynet did not respond and we observe only the initial SYN packet. We aggregate the connections to sessions using an approach similar to the first step algorithm by Kannan et al [9]. We consider all those connections withinTaggreg of each other as part of the same session for a
given pair of hosts. We used the same threshold,Taggreg= 100seconds, as Kannan
et al [9], and found that this grouped the majority of connections between any given pair of hosts.
For application protocols which are not commonly used, the average back-ground radiation noise is low and thus port numbers are used to separate event traffic. However, noise is usually quite strong for more popular protocols, thus requiring further differentiation. Assuming that we observe at least one success-ful session from each sender, we can use the payload analysis of that session to separate it from other traffic. We use a similar approach for the Radiation-analy summaries proposed in [19], which further classify the traffic within one application protocol or one application protocol family by rich semantic anal-ysis. We analyzed the semantics of 20 common and backdoor protocols based on Bro’s application semantic analysis [11], and generated a session summary for each session (e.g.,445/tcp/[exploit] (NAMED PIPE:"\\<dst-IP>\IPC$ \wkssvc"; RPC request (4280 bytes))). Based on the session summary we can further classify the traffic within one protocol family.
3.3 Event Extraction
We found for the traffic of all the port number or protocol semantics, the traffic con-sists of a steady background noise with some large spikes. The large spikes usually are corresponding to the botnet scanning events. We found to extract the big spikes is similar to the traditional signal detection problem. Signal strengthS is defined as the peak of unique source count arrival, and the typical unique source count when there are no events is defined as noise strengthN. Noise strength is calculated as the median of unique source counts of every time interval forTN days before the event.
If the event occurrence time is less thanTN/2, then noise strength is the median of
the time windowTN. We define the signal to noise ratio asSN R=NS, and examine
only those events with largeSN R. We useTN = 30(30 days) since we never see
an event last more than two days. The thresholds we use areSN R≥50.
We calculate the unique source count of every pre-defined time interval for a given protocol. Event extraction is done using time series analysis. While many gen-eral statistical signal detection approaches might be applied here, we currently ex-tract the events semi-manually. We first automatically exex-tract potential events using
the following algorithm: for any given time interval, we calculate the median of the previousTNintervals and theSN R. For those spikes which exceed ourSN R
thresh-old, we extend the range untilS ≤ωN whereωis a tunable parameter controlling the amount of the signal tail to include in the event.
After an event is extracted, we might refine the event by re-scaling it into smaller time intervals and recalculating the unique source counts. We use manual analysis and visualization techniques at this point, since re-scaling might make the shape of events more complex.
3.4 Misconfiguration and Worm Separation
Events with a large number of sources are usually misconfigurations, botnets and worms [19]. We separate misconfigurations from worms or botnets based on the ob-servation that botnet scans and worms contact a significant range of the IP addresses in the sensor, whereas events with few hotspots target are caused by misconfigura-tions. We use two metrics to separate misconfiguations from other events. The ad-dress hit ratio,NE/ND, whereNE is the number of destination addresses involved
in the event andNDis the number of destination addresses in the honeynet, should
be much smaller for misconfigurations than for botnet sweeps or worms. Secondly, the average number of sources per destination address should be much larger for mis-configurations. If the first metric is below given threshold while the second crosses a given threshold, we consider the event to be a misconfiguration; otherwise it is classified as a worm or botnet event.
Worm behavior and botnet probes are quite similar: both scan and send exploits to the address range in a similar manner. However, usually the number of sources for worms grows much more quickly than botnets, and events also last longer for worms. But if botnets scans the entire Internet, with new infected bots continuing to join the scan activity, then there is no observable difference from worms. Hence it is difficult to define a strict distinction between botnet sweeps and worms. In this paper, we treat all events with an exponential growing trend in the number of sources as worms [22], and the other events as botnet sweeps. We use the Kalman filter based exponential trend detection proposed in [22] to differentiate botnet and worm events.
4 Botnet Scanning Event Analysis
In our one year honeynet traffic, we found 43 botnet global scan events. We first ana-lyzed the overall sender (bot) characteristics of the all the senders. Then, we anaana-lyzed each event individually and compare the characteristics among different events.
In this book chapter, we focused on the following characteristics of botnet scan-ning behavior.
• Bot IP distribution and AS distribution
• Bot operating system characteristics
• Botnet scan arrival behavior
• Bot observed local scan rate behavior
• Botnet scanning source and destination relationship
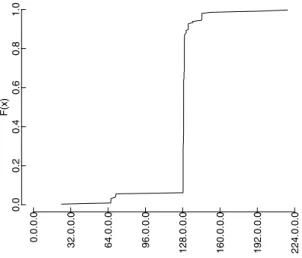
0.0 0.2 0.4 0.6 0.8 1.0 0.0.0.0 32.0.0.0 64.0.0.0 96.0.0.0 128.0.0.0 160.0.0.0 192.0.0.0 224.0.0.0 F(x)
Fig. 2. The number of all unique source IP addresses, as a function of IP address space. On
the x-axis, IP address space is binned by /24.
4.1 Source Characteristics of Bots
We observed thousands of senders in most of the events. In 43 events, we totally ob-served 63,851 unique senders. Figure 2 shows the number of senders (bots) obob-served over all the events, as a function of IP address space. The overall trend is very similar to the spamming IP distribution in [16]. From the figure we knew, most bots are from 60.* – 90.* and 193.* – 222.* and some are from 24.* (cable modem provider). The figure illustrated that the bots mostly come from quite concentrated IP ranges. This result confirmed the result from the bot spamming behavior study [16].
We also analyzed the IP space distribution for every event. We found for most events we got the similar IP space distribution as figure 2. However, there are some events whose IP space distributions are far from the total distribution. Figure 3 and Figure 4 shows a few such examples. Since different events might be corresponding to different botnets, this implies the IP space distributions of different botnets can be quite different. Therefore, the coarse grain IP range based botnet filtering or detect might not work well in practice.
In our study, we found most bots are from a relative small number of ASes. More than 22% of bots are from the five ASes, and 41% of the bots from 20 ASes. In
0.0 0.2 0.4 0.6 0.8 1.0 0.0.0.0 32.0.0.0 64.0.0.0 96.0.0.0 128.0.0.0 160.0.0.0 192.0.0.0 224.0.0.0 F(x)
Fig. 3. The number of all unique source IP addresses for the event on TCP port 2967 on
2006-11-26, as a function of IP address space. On the x-axis, IP address space is binned by /24. 0.0 0.2 0.4 0.6 0.8 1.0 0.0.0.0 32.0.0.0 64.0.0.0 96.0.0.0 128.0.0.0 160.0.0.0 192.0.0.0 224.0.0.0 F(x)
Fig. 4. The number of all unique source IP addresses for the event on TCP port 5000 on
2006-8-24, as a function of IP address space. On the x-axis, IP address space is binned by /24.
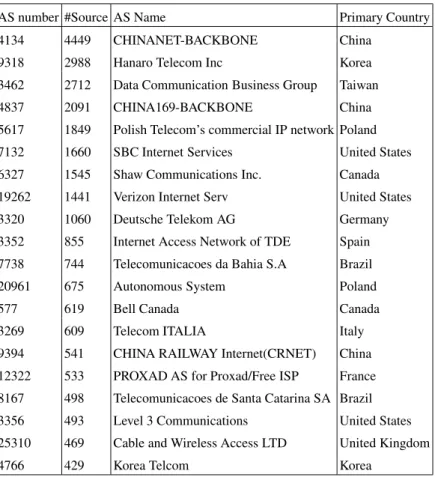
Table 1, we showed the top 20 ASes and the corresponding number of bots for each AS. From the analysis of the top 20 ASes, we found about 21% of the bots are Asia, mainly from China, Korea and Taiwan. Europe and North America (Unite States and Canada) have similar amount of bots 9.5% and 9% respectively. Surprisingly there are also about 2% bots coming from Brazil. The bot population is from 2860 ASes in total. Although our honeynet detection sensor is in Unite States but the bots indeed
AS number #Source AS Name Primary Country
4134 4449 CHINANET-BACKBONE China
9318 2988 Hanaro Telecom Inc Korea
3462 2712 Data Communication Business Group Taiwan
4837 2091 CHINA169-BACKBONE China
5617 1849 Polish Telecom’s commercial IP network Poland
7132 1660 SBC Internet Services United States
6327 1545 Shaw Communications Inc. Canada
19262 1441 Verizon Internet Serv United States
3320 1060 Deutsche Telekom AG Germany
3352 855 Internet Access Network of TDE Spain 7738 744 Telecomunicacoes da Bahia S.A Brazil
20961 675 Autonomous System Poland
577 619 Bell Canada Canada
3269 609 Telecom ITALIA Italy
9394 541 CHINA RAILWAY Internet(CRNET) China 12322 533 PROXAD AS for Proxad/Free ISP France 8167 498 Telecomunicacoes de Santa Catarina SA Brazil
3356 493 Level 3 Communications United States
25310 469 Cable and Wireless Access LTD United Kingdom
4766 429 Korea Telcom Korea
Table 1. Amount of scan received from botnet scanning in the top 20 ASes.
come from all over the world. The overall result are similar to the result from [16]. The difference between our result and the result from [16] is mainly that we observed more hosts from Europe than them.
4.2 Operating Systems of Bots
We also investigated the prevalence of operating system among the bots. We used p0f [21] tool to identified the operating system versions. P0f is a passive OS fin-gerprinting tool which mainly uses the TCP options within the TCP SYN packets to identify the operating system versions. For each bot, we might observe multiple SYN packets. Sometimes, the different SYN packets from a bot might be given different OS results by p0f. We used the following priorities to solve the potential conflict. We think the other OS types have higher priority than Windows, and Windows has higher priority than Unknown. The rule is to favorite the non-Windows operating systems
Operating System Clients Windows 58797 (92%) -Windows 2000 or XP 58028 (90.8%) -Windows 98 404 (0.63%) -Windows NT 329 (0.51%) -Windows 2003 25 (<.1%) -Windows 95 11 (<.1%) Linux 9 (<.1%) Novell 23 (<.1%) HP-UX 1 (<.1%) Unidentified 5021 (7.8%) Total 63851
Table 2. The operating system distribution for unique senders of received scan, as determined
by passive OS fingerprinting.
and to try to avoid assigning Unknown. Table 2 shows the operating system distri-bution we found. We found 92% of the bots are identified as Windows machines by p0f [21]. And among the Windows machines, 90.8% of the bots are Windows 2000 or XP. This result supported the conventional wisdom that botnet army are mainly comprised Windows machines.
We also did the similar analysis at per event level. We found for all the 43 events the dominated operating system are Windows. We did not observe any events which mainly consist of other types of machines. Although, there are some rumors that some botnets are Linux or Unix based, based on our finding, we believe the percent-age of non-Windows based botnets in the botnet population are really low.
4.3 Scan Arrival Characteristics
For all the botnet events, we analyzed how the scan sessions arrive in time. We found for most events the very beginning and the very end of the events have complex ar-rival behavior. However, for most events in the middle part, the scan arar-rival speeds are quite constant, and the more than half of the events’ inter-arrival time follows exponential distributions. This suggested that the scan arrivals follow a Poisson dis-tribution. One plausible explanation for this is based on the law of rare events. Usu-ally the botnet scans a large IP scope, and the sensor is only a tiny portion of it. If the botnet uses random scanning, for each scan session there is a small probability pto arrive the honeynet detection sensor. According the law of rare events, the ob-served scan sessions in a given time interval will follow a Poisson distribution and the inter arrival time will follow an exponential distribution. Among the 43 events,
0 200 400 600 800 UTC Time Cumulative Arrivals 12:00 16:00 20:00 00:00
Fig. 5. The cumulative scan session arrival process of the event on TCP port 8888 on
2006-02-06, which corresponding to a backdoor shell.
0 100 200 300 400 500 600 −3.0 −2.5 −2.0 −1.5 −1.0 −0.5 0.0
Interarrival time (seconds)
Log(1−F(x))
Fig. 6. The inter-arrival time log scale CDF of the event on TCP port 8888 on 2006-02-06,
which corresponding to a backdoor shell.
about 25 (58%) events the inter-arrival time follows an exponential distribution. This suggested most botnets indeed use a random scan strategy. An example of the scan arrival and scan inter arrival time is shown in Figure 5 and Figure 6 respectively.
4.4 Source Arrival and Departure
We also investigated for each event when the bots are observed. We defined, for a given bot, the time it begins to scan as its true source arrival time, and the time it
0 500 1000 1500 2000 2500 3000 UTC Time Cumulative # of sources 04:00 06:00 08:00 10:00 12:00
Fig. 7. The arrival process of the event on TCP port 1433 on 2006-01-22 (from 2006-01-22
21:00 to 2006-01-23 07:00), which corresponding to a MS SQL Server vulnerability.
0 500 1000 1500 2000 2500 UTC Time Cumulative # of sources 02:00 04:00 06:00 08:00
Fig. 8. The arrival process of the event on TCP port 1433 on 2006-08-24, which corresponding
to a MS SQL Server vulnerability.
stops to scan as its true source departure time. We cannot measure the true arrival time and departure time of the bots, since the botnet might scan a large range and the honeynet sensor can only observe a small sample of the scans. Instead, we defined the time of the first scan we seen from a given bot as its observed arrival time, and the time of the last scan we seen from the same bot as its observed departure time. For random scanning, we can assume the scans we observed are a random sampling from the total scan population. Certainly the sampling errors will influence the results. The
number of scan between the first scan sent out by a bot and the first scan we observed from that given bot follows a geometry distribution. If we assume the scan speed is close to constant, the time difference of the first scan sent out by a bot and the first scan we observed from that bot will also follow a geometry distribution. We can make the similar argument to the true departure time of the bot and the departure time we observed. For the long lived events usually we can use the observed arrival and departure time as good approximation of the true arrival and departure time. For the short lived event the observed arrival and departure time might not be able to present true arrival and departure time.
For the long lived events, we found there are two types of source arrival pro-cesses. In some events, most bots arrived at the beginning part of the events, but on some other events bots arrivals distributed over the whole period of the event dura-tion. Figure 7 and Figure 8 showed such two representative cases respectively.
In Figure 7, most bots arrived at the beginning part of the events. This might cor-respond to the case that after the botmaster typed the scan command in the command and control channel, immediately the bots in the channel received the scan command and began to scan. The true source arrival times of bots are same, so the observed source arrival time follows a geometry distribution.
In Figure 8, the bot arrive uniformly in the event duration, which indicate the true source arrival time of different bots are different and also should be uniformly dis-tributed in time. There are two possibilities to make this happen. One possibility is that every bot defer to execute the scan command by random seconds uniformly. The other possibility is that the scan command is the default channel topic [15]. There-fore, after a bot join the channel, it will get the scan command and start scanning. From the data we cannot separate these two cases.
In the departure process, we found, in all the long-lived events, many bots depart before the events end.
For the events most bots arrived at the beginning part of the events, we observed at the end of event, the bot departure rate increased sharply. We analyzed several botnet source code genres and found in most case the botmaster asks the bot to scan a fixed amount of time. If that is the case, it makes sense that at the end of the time specified by the botmaster all the remaining bots end the scanning.
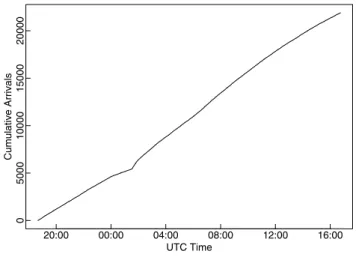
There is one event different from other events, in which the bots arrived in groups, but the total scan arrivals are still linear in time. In Figure 9 we can see there are four major groups of bots arrived in batch. But in Figure 10 the number of scan arrivals is still linear in time. Through further analysis we found, after the first group of bots departed, the second group of bots arrived immediately. This is also true for other consecutive groups of bots. Obviously, the botmaster intentionally divide the bots in four groups to do the scanning one after another.
We also studied the observed bot scan duration, i.e., the time between the first scan observed from a given bot and the last scan observed from the given bot. An example CDF of the scan duration is shown in Figure 11. However, we found the scan duration varies from events to events. There is no clear pattern can be found.
0 200 400 600 800 1000 1200 UTC Time Cumulative # of sources 20:00 00:00 04:00 08:00 12:00 16:00
Fig. 9. The bot arrival process of event on TCP port 139 from 2006-08-24 13:40 to 2006-08-25
11:04, which corresponding to a Netbios-SSN scan.
0 5000 10000 15000 20000 UTC Time Cumulative Arrivals 20:00 00:00 04:00 08:00 12:00 16:00
Fig. 10. The scan arrival of event on TCP port 139 from 2006-08-24 13:40 to 2006-08-25
11:04, which corresponding to a Netbios-SSN scan.
4.5 Observed Local Scan Rate
We calculated the local scan rate of a given bot as the number of scans we observed minus one over its observed scan duration. The idea behind is that we can think after the first scan arrives we started the timer, and in the observed scan duration we will observed the scans except the first one. We will not define the local scan rate for the senders from which only one scan is observed.
0 5000 10000 15000 20000 25000 30000 0.0 0.2 0.4 0.6 0.8 1.0
Scan duration (seconds)
F(x)
Fig. 11. The CDF of observed scan duration of bots of event on TCP port 1433 on 2006-08-24,
which corresponding to a MS SQL Server vulnerability.
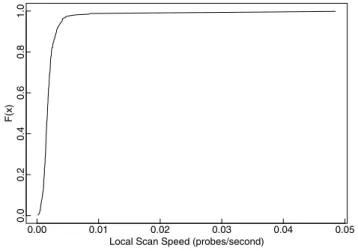
0.00 0.01 0.02 0.03 0.04 0.05 0.0 0.2 0.4 0.6 0.8 1.0
Local Scan Speed (probes/second)
F(x)
Fig. 12. The CDF of local scan rate distribution of the event on TCP port 5900 on 2006-09-26,
which corresponding to a VNC vulnerabilty.
We first looked at the CDF of local scan rate of different events. In four cases, the numbers of bots which send more than one scans are very small, so the CDF is not very representative. For the remaining cases, we found most bots have similar local scan rate with a few bot with very high local scan rate. We further analyzed the bots with very high local scan rate, and find they are not necessarily the bots which send most scans. Many of such cases are due to they have very short observed scan duration. Figure 12 shows an example of such a CDF distribution.
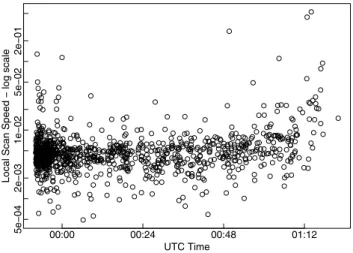
We further investigated whether the local scan speed have any correlation with the bot arrival and departure time. We did not find any obvious trend. We believe in most case, the bot arrival and departure time might not have strong correlation with their local scan speed. However they might have certain weak correlation and which can be buried into the random noises in the data. Figure 13 and Figure 14 show an example of this analysis.
5e−04 2e−03 1e−02 5e−02 2e−01 UTC Time
Local Scan Speed − log scale
00:00 00:24 00:48 01:12
Fig. 13. The scatter plot of the source observed arrival times and their corresponding observed
scan rate of the event on TCP port 1025 on 2006-09-19.
4.6 Scan Source Destination Relationship
We also analyzed source destination relationships. We mainly studied two distribu-tions: how many sources target a destination address in the honeynet sensor, and how many destinations are contacted by a source.
We found in all the events, the distribution of how many sources a destination contacts is close to the binomial distribution with only very few exceptions. This implies that the source usually choose the destination uniform randomly. Figure 15 is such an example.
The distribution of how many destinations a source targets is more complex. Sometimes it has multiple modes. The conjecture is that it can be explained as a multiplex of multiple binomial distributions, due to different bots might have differ-ent scan speeds and durations. In Figure 16 we showed an example which clearly has this pattern.
5e−04 2e−03 1e−02 5e−02 2e−01 UTC Time
Local Scan Speed − log scale
00:00 00:24 00:48 01:12
Fig. 14. The scatter plot of the source observed departure times and their corresponding
ob-served scan rates of the event on TCP port 1025 on 2006-09-19.
0 50 100 150 200 250 # of SIPs/DIP Count of destinations 5 11 17 23 29 37 44 59 97
Fig. 15. The distribution of number of sources a destination contacted of the event on TCP
port 1433 on 2006-08-24, which corresponding to a MS SQL Server vulnerability.
5 Conclusion
Botnets have become the most serious threats to the Internet security. Many cyber-crimes are botnet related. Measuring and understanding the botnet will help us gain more insight to the botnet phenomenon, and further help us design better detection and prevention systems.
0 10 20 30 40 50 60 # of DIPs/SIP Count of sources 1 3 5 7 9 12 15 18 21 24 27 30 33 39
Fig. 16. The distribution of number of destinations a source touched of the event on TCP port
2967 on 2006-11-27, which corresponding to a backdoor shell.
In this book chapter, we proposed a general framework to extract botnet global scanning events. Based on one year honeynet traffic from a large research institution we studied the six different botnet scanning characteristics. We found botnets al-though mainly from a small number of ASes but indeed spread out all over the world from totally 2860 ASes. There are two different botnet arrival/departure patterns: all together and gradually. We conjecture this is related to different scan strategies. We also found the scan arrivals are linear in time and inter-arrival time follows a expo-nential distribution, which might imply the scans are random scanning and the scan range is much larger than the detection sensor.
References
1. M. Bailey et al. The Internet motion sensor: A distributed blackhole monitoring system. In Proc. of NDSS, 2005.
2. James Binkley and Suresh Singh. An algorithm for anomaly-based botnet detection. In Proceedings of Steps to Reducing Unwanted Traffic on the Internet Workshop (SRUTI ’06), 2006.
3. E. Cooke, F. Jahanian, and D. McPherson. The zombie roundup: Understanding, detect-ing, and disrupting botnets. In Proceedings of USENIX Workshop on Steps to Reducing Unwanted Traffic on the Internet, July 2005.
4. W. Cui et al. GQ: Realizing a system to catch worms in a quarter million places. Technical Report TR-06-004, ICSI, 2006.
5. D. Dagon, C. Zou, and W. Lee. Modeling botnet propagation using time zones. In Pro-ceedings of the 13th Network and Distributed System Security Symposium (NDSS’06), 2006.
6. Neil Daswani, Michael Stoppelman, the Google Click Quality, and Inc Security Teams, Google. The anatomy of Clickbot.A. In USENIX First Workshop on Hot Topics in Un-derstanding Botnets (HotBots), 2007.
7. Julian Grizzard, Vikram Sharma, Chris Nunnery, Brent ByungHoon Kang, and David Dagon. Peer-to-peer botnets: Overview and case study. In USENIX First Workshop on Hot Topics in Understanding Botnets (HotBots), 2007.
8. Christopher W. Hanna. Using snort to detect rogue irc bot programs, Oct 2004.http://www.giac.org/certified_professionals/practicals/ gsec/4095.php.
9. J. Kannan et al. Semi-automated discovery of application session structure. In Proc. of ACM IMC, 2006.
10. R. Pang et al. Characteristics of Internet background radiation. In Proc. of ACM IMC, 2004.
11. V. Paxson. Bro: A system for detecting network intruders in real-time. Computer Net-works, 31, 1999.
12. The Honeynet Project and Research Alliance. Know your enemy: Tracking botnets. http://honeynet.org/papers/bots, March 2005.
13. N. Provos. A virtual honeypot framework. In Proc. of USENIX Security, 2004.
14. Niels Provos, Dean McNamee, Panayiotis Mavrommatis, Ke Wang, and Nagendra Modadugu. The ghost in the browser: Analysis of web-based malware. In USENIX First Workshop on Hot Topics in Understanding Botnets (HotBots), 2007.
15. Moheeb A. Rajab, Jay Zarfoss, Fabian Monrose, and Andreas Terzis. A multifaceted approach to understanding the botnet phenomenon. In Proc. of ACM/USENIX IMC, 2006. 16. Anirudh Ramachandran and Nick Feamster. Understanding the network-level behavior
of spammers. In Proceedings of ACM SIGCOMM ’06, September 2006.
17. Anirudh Ramachandran, Nick Feamster, and David Dagon. Revealing botnet member-ship using DNSBL counter-intelligence. In Proceedings of Steps to Reducing Unwanted Traffic on the Internet Workshop (SRUTI ’06), 2006.
18. M. Vrable et al. Scalability, fidelity, and containment in the potemkin virtual honeyfarm. In Proc. of SOSP, 2005.
19. V. Yegneswaran, Paul Barford, and Vern Paxson. Using honeynets for Internet situational awareness. In In Proc. of ACM Hotnets IV, 2005.
20. V. Yegneswaran et al. On the design and use of Internet sinks for network abuse monitor-ing. In Proc. of RAID, 2004.
21. Michal Zalewski. the new p0f.http://lcamtuf.coredump.cx/p0f.shtml. 22. Cliff C. Zou et al. Monitoring and early warning for Internet worms. In Prof. of ACM