Phys. Med. Biol.49(2004) 5347–5356 PII: S0031-9155(04)85063-2
Tracking errors in a prototype real-time tumour
tracking system
Gregory C Sharp1, Steve B Jiang1, Shinichi Shimizu2and Hiroki Shirato2 1Department of Radiation Oncology, Massachusetts General Hospital and Harvard Medical
School, Boston, MA 02114, USA
2Department of Radiation Medicine, Hokkaido University School of Medicine, Sapporo, Japan
E-mail: [email protected]
Received 16 August 2004, in final form 18 October 2004 Published 19 November 2004
Online atstacks.iop.org/PMB/49/5347
doi:10.1088/0031-9155/49/23/011
Abstract
In motion-compensated radiation therapy, radio-opaque markers can be implanted in or near a tumour and tracked in real-time using fluoroscopic imaging. Tracking these implanted markers gives highly accurate position information, except when tracking fails due to poor or ambiguous imaging conditions. This study investigates methods for automatic detection of tracking errors, and assesses the frequency and impact of tracking errors on treatments using the prototype real-time tumour tracking system. We investigated four indicators for automatic detection of tracking errors, and found that the distance between corresponding rays was most effective. We also found that tracking errors cause a loss of gating efficiency of between 7.6 and 10.2%. The incidence of treatment beam delivery during tracking errors was estimated at between 0.8% and 1.25%.
(Some figures in this article are in colour only in the electronic version)
1. Introduction
Modern radiation therapy is capable of highly conformal treatments that deliver a lethal
dose to a tumour while sparing surrounding healthy tissue. When dose conformality is
reduced because of tumour motion during treatment, motion compensation methods can be used to reduce motion and restore conformality. One promising technique for motion compensation is respiratory gated treatment, which reduces tumour motion during beam-on
time by limiting radiation exposure to a portion of the breathing cycle (Mageras and Yorke
2004). This can be implemented using an external respiratory signal to infer the tumour
position (Oharaet al 1989, Kubo and Hill 1996, Ramseyet al 1999a, 1999b, Kuboet al
2000,Minoharaet al2000,Vedamet al2001,Keallet al2002), by fluoroscopic tracking of
implanted radio-opaque markers (Shiratoet al1999,Shimizuet al2000, 2001,Shiratoet al
2000a, 2000b,Haradaet al2002) or by magnetic tracking of implanted markers (Seileret al
2000, Hummelet al 2002). Another motion compensation technique is beam tracking,
or following the target dynamically with the radiation beam (Murphy 2004). This was
first implemented in a robotic radiosurgery system (Adleret al1999,Ozhasogluet al2000,
Schweikardet al 2000,Murphy 2002, Murphyet al 2003), and has been proposed for use
with a dynamic multileaf collimator (MLC) (Keallet al2001, Neicuet al2003, Suh et al
2004).
Both gating and beam tracking require knowing the exact 3D position of the moving tumour in real time. This knowledge can be obtained through real-time x-ray imaging of
fiducial markers during the treatment (Shiratoet al1999,2000b, 2003, Shimizuet al2001,
Murphy 2002,Berbecoet al2004). A radio-opaque seed is surgically implanted in or near the tumour, and the position of the seed is tracked throughout the treatment session. Tracking is performed using specialized pattern recognition software that runs in real time. While most pattern recognition methods are quite capable of isolating a high contrast target from the background, they can fail when the signal quality is poor, or when background clutter mimics the target. Therefore, a clinical tracking system must anticipate the possibility that tracking will fail, and provide tools for the detection of and response to tracking failures.
The prototype real-time tumour-tracking radiation therapy (RTRT) system at Hokkaido University implements an on-line tracking failure detection algorithm that compares tracking statistics against four user-controlled thresholds in real time. Two classes of errors are detected:
recoverableerrors andunrecoverableerrors. A recoverable error is a temporary or intermittent error for which automatic recovery is expected. An unrecoverable error refers to an error for which tracking must be manually reinitialized. The purpose of having these two error levels is to improve treatment efficiency while maintaining treatment safety. When a recoverable error occurs, the treatment is temporarily halted by the linac beam hold-off mechanism. Treatment resumes automatically when the recoverable error condition is cleared. In contrast, when an unrecoverable error occurs, a tracking interlock is enabled and the treatment beam permanently halted. The therapist must correct the tracking failure and clear the interlock to resume treatment.
This work is an analysis of how tracking errors affect the efficiency and reliability of treatment using real-time tumour tracking. We have analysed the log files captured by the RTRT system during treatment, estimated the frequency of tracking errors, and quantified the loss of efficiency. In addition, we have examined the frequency of treatment beam delivery during tracking errors. Finally, we examine the effectiveness the tracking error detection system.
2. Methods and materials
In this section, we describe and analyse methods for tracking error detection. First, we introduce a set of indicators that can be used to detect errors. The relative merit of each indicator is evaluated against a set of examples from the RTRT log files. Next, we combine these indicators using a neural network classifier, and identify tracking errors over a large set of tracking data. This classification is used to estimate how often tracking errors occur during treatment, and their effect on treatment efficiency and accuracy. Finally, the detected tracking errors are post-processed to distinguish recoverable errors, lasting less than 1.5 s, from unrecoverable errors, lasting longer than 1.5 s. The detection rate for unrecoverable errors is thereby estimated.
2.1. Indicators for tracking errors
Several indicators can be used to detect the occurrence of a tracking error. We will evaluate indicators based on the quality of the pattern recognition, the quality of the triangulation and the stability of the recovered signal.
The first indicator we consider is the pattern recognition score, or PRS. The PRS is
a measure of the certainty with which the tracking software could find the target within a single image. In the RTRT system, this score is computed using normalized cross-correlation (Shiratoet al2000b), but other systems may use other metrics. This score is, in essence, a measure of the quality of the match, and the pixel with the highest PRS is assumed to be the location of the target. When doing stereo tracking, the correlation score is computed for both images, but we need only consider the image with the lower score. This simplification is justified because 3D accuracy is generally limited by the imager which is tracking more poorly.
The second indicator we consider is thedistance between rays, or DBR. The DBR is a
measure of consistency of tracking between the two imagers. Once the image location of the marker has been determined, the marker is known to lie on a corresponding ray in 3D space. Therefore, when the location is known in both images, the three-dimensional position of the marker is reconstructed by intersecting two corresponding 3D rays. Usually the two rays do not intersect exactly; instead there is a gap. The DBR refers to this gap between the rays, and it is small when the marker is being tracked properly in both images, but may become large when one or both imagers have identified the wrong location for the marker. Thus, a large DBR is an indication of poor tracking.
The last indicators we consider are theinstantaneous velocity, or IV, and theinstantaneous
acceleration, or IA. The IV and IA are measures of tracking stability over a short period of time. Poor localization of the target within an image often causes sudden jumps in the computed target location whereas we expect the motion of the markers to vary smoothly during good
tracking. For off-line processing, we compute the velocityvt and accelerationat at time t
using positionsxt−1throughxt+1. Neglecting terms due to the sampling rate, this is given as
vt =|
xt+1−xt|+|xt−xt−1|
2 (1)
at = |xt+1−2xt+xt−1|. (2)
Or, during on-line processing, the velocity and acceleration can be computed as
vt = |xt−xt−1| (3)
at = |xt−2xt−1+xt−2|. (4)
An example of these indicators are shown in figure1. This figure compares the motion of a
marker in the left–right (L–R), superior–inferior (S–I) and anterior–posterior (A–P) directions,
against the four indicators described above. At an approximate time t = 92 s, the pattern
matching software loses track of the implanted marker. As a result the DBR increases, the PRS falls and the IV and IA values increase. Note that IV and IA do not reflect the gross motion of the tumour. Because they are computed over a small time interval from unfiltered measurements, they instead reflect the stability of the measurement.
The Mitsubishi tracking system implements recoverable and unrecoverable tracking error detection by comparing four configuration parameters against the DBR and PRS signals. These parameters are the DBR threshold, hard PRS threshold, soft PRS threshold and the maximum allowed soft PRS errors. At each image frame, if the PRS is less than the hard PRS
75 80 85 90 95 100 105 Time (secs) Motion (L-R) Motion (S-I) Motion (A-P) Distance Between Rays (DBR) Pattern Recognition Score (PRS) Instantaneous Velocity (IV) Instantaneous Acceleration (IA)
Figure 1.Four indicators that can be useful in detecting tracking errors.
threshold, or if the DBR is less than the DBR threshold, an unrecoverable error is immediately signalled. If the PRS is less than the soft PRS threshold, then a recoverable error is immediately signalled. The recoverable error signal is subsequently cleared when the PRS exceeds the soft PRS threshold. However, if the PRS remains less than the soft PRS threshold for a continuous duration greater than the maximum allowed soft PRS errors, a hard error is signalled and treatment is interrupted.
2.2. Off-line error detection
To evaluate the performance of the tracking system, and to understand the effects of tracking errors on the clinical treatment, we first need to decide what constitutes a tracking error. Our approach has four stages:
(i) identify examples of good and bad tracking to be used as training data, (ii) train a neural network classifier using the training data,
(iii) run the neural network classifier at different detection rates to generate a set of classified traces,
(iv) identify unrecoverable error regions from the classified traces.
The first stage identifies regions within the file that have or do not have tracking errors, and is necessary for training the classifier. The regions are obtained from the tracking log files using the tracking interlock information. The tracking interlock is enabled through automatic detection by the RTRT software, or through manual detection by the therapist. Therefore, we conclude that the interval immediately preceding the interlock usually contains a tracking error. Similarly, tracking is corrected by the therapist before the interlock is cleared, and therefore we conclude that the interval immediately following the cleared interlock is usually
error free. As shown in figure2, 1 s of bad tracking is taken before each interlock enable, and
4 s of good tracking is taken after each interlock clear.
Given this set of training data, we may evaluate the effectiveness of the indicators described
in section2.1on identifying tracking errors. A threshold is used on each indicator to classify a
data point as either tracking error or good tracking. Changing the detection threshold on each indicator increases or decreases the detection rate and false alarm rate. In addition, we evaluate
58 60 62 64 66 68 70 72 74 Time (secs) Motion (L-R) Motion (S-I) Motion (A-P) Interlock Signal
Good tracking = 4 secs Bad tracking = 1 sec
Figure 2.An interval of 1 s previous to each tracking interlock is assumed to be a tracking error, and an interval of 4 s after the interlock is cleared is assumed to be error free.
the effectiveness of using all four indicators together by building an artificial neural network
classifier (Bishop 1995). The neural network uses a fully connected multilayer perceptron
architecture, with four input units five hidden units and one output unit. The network is trained to produce an output of +1 when the inputs were associated with a tracking error, and produce
an output of−1 when the inputs were associated with good tracking. Training was done
off-line using a conjugate gradient optimizer. The relative performance of this neural network
is evaluated using 10-fold cross-validation (Dudaet al2001). A tradeoff between detection
rate and false alarm is achieved by changing the threshold on the neural network output.
The results of this comparison are shown in figure3. It is seen that DBR is the most
powerful indicator for detecting tracking errors. PRS, IV and IA are somewhat weaker cues, but detection efficiency can be boosted somewhat by using them in conjunction with DBR.
The next stage is to use the neural network classifier to identify tracking errors across the entire set of patient log files. Depending on the setting of the detection threshold, the classifier
becomes more or less sensitive. In figure4(left), we see that by setting the threshold to a false
alarm rate of 5% (FAR=0.05), a tracking error beginning at around timet =43 s is detected
accurately with relatively few false alarms, while setting the threshold to a false alarm rate of
10% (FAR=0.10) causes significant regions to be mislabelled as errors. In contrast, consider
figure4(right), which shows the motion trace of a patient with a small tumour motion, and
sudden jumps in motion caused by loss of track. We see that at FAR=0.05 these errors are
not detected, but at FAR=0.10 these errors are correctly identified. These examples illustrate
the difficulty in setting the detection sensitivity. Therefore, in the remaining analysis we have
chosen to make two estimates of tracking errors, one at FAR=0.05 and one at FAR=0.10,
with the understanding that the true classification is probably within these bounds.
The final stage is the identification of unrecoverable errors. We define an unrecoverable error as a tracking error that lasts longer than 1.5 s. The duration of 1.5 s is based on an empirical observation that tracking errors lasting longer than this duration generally do not correct themselves. An example of the identification of unrecoverable errors is shown in
0.5 0.6 0.7 0.8 0.9 1 0.00 0.05 0.10 0.15 0.20
Error Detection Rate
False Alarm Rate
DBR only PRS only IV only IA only All Cues
Figure 3.Estimated detection rates for finding tracking errors with different inputs.
28 30 32 34 36 38 40 42 44 15 20 25 30 35 Motion (L-R) Motion (S-I) Motion (A-P) Distance Between Rays (DBR) Tracking Errors (FAR=0.05) Tracking Errors (FAR=0.10)
Figure 4.Detecting errors with a false alarm rate (FAR) of 0.05 and 0.10.
and preceding each interlock is relatively long duration of tracking errors. Note that the unrecoverable error at the beginning of the trace is the time required to initiate tracking, and is treated separately in our analysis. Note further that the irregular breathing motion between 75 and 95 s is the real tumour motion, not a tracking error.
2.3. On-line error detection
On-line detection of unrecoverable tracking errors is needed to stop treatment until the therapist has corrected the problem. In this section, we will evaluate how well the prototype RTRT tracking system identifies unrecoverable errors. We define a correct detection as a detection that is made between 1 s prior to the beginning of the error, and 1 s after the beginning of the error. Errors that are not detected within this interval will be considered detection failures. Detections that occur during good tracking, and more than 1 s before the start of an unrecoverable error will be considered to be a false alarm.
The detection rate for the prototype RTRT system at identifying unrecoverable errors is
0 20 40 60 80 100 120 140 160 Motion (L-R) Motion (S-I) Motion (A-P) Tracking Errors Interlock Signal Unrecoverable Errors Time (secs)
Figure 5.Identification of unrecoverable errors from tracking log files.
50 % 60 % 70 % 80 %
55.6 min 27.8 min 18.5 min 13.9 min 11.1 min FAR = 0.05 FAR = 0.10
Mean time to false alarm
Detection Rate
Figure 6.Estimated detection rates for unrecoverable errors on the prototype RTRT system.
and therefore we present detection rate curves for FAR values of 0.05 and 0.10. The actual detection rate is expected to fall between these two curves.
3. Results and discussion
Although it would seem that tracking errors can be identified to some degree, there is clearly
a tradeoff between detection rates and false alarms. Nevertheless, from figure3it can be seen
that DBR is the most important of the indicators. One reason for this is that a high DBR
always means that tracking is incorrect, while a low PRS or high IV/IA are simply correlated
45 50 55 60 65 Time (secs) Motion (L-R) Motion (S-I) Motion (A-P) Gating Signal Tracking Errors A A B
Figure 7.Tracking errors while the MV beam is delivering treatment.
Table 1.Analysis of errors with respect to kV beam-on time. FAR=0.05 FAR=0.10 Kilovoltage beam-on time 34.0 h 34.0 h Initial setup time 67.5 min (3.3%) 67.5 min (3.3%) Hard errors 119.2 min (5.8%) 172.4 min (8.5%) Error recovery time 36.4 min (1.8%) 36.4 min (1.8%) Loss of efficiency due to errors 2.59 h (7.6%) 3.48 h (10.2%) Soft errors 24.0 min (1.2%) 64.0 min (3.1%)
One clinical implication of tracking errors is a loss of efficiency in treatment. We
have evaluated this impact using lung tumour motion data from 40 patients treated on the
prototype RTRT system between 2000 and 2001 (Shiratoet al2000b). This analysis has been
summarized in table1. We define the loss of efficiency due to tracking errors to be the time
when there were unrecoverable errors, plus the time needed to correct these errors. Loss of efficiency was estimated to be between 7 and 11% of the total kV beam-on time.
Another clinical implication is the possibility of treatment beam delivery during an undetected tracking error. If treatment persists when the position of the tumour is not known reliably, this will result in a loss of conformality. To estimate this effect, the gating signal was
compared with the tracking errors detected in section2.2. An example is shown in figure7,
where it can be seen that sometimes the gating signal is on, and also our classifier detected a tracking error. We separate these incidents into two groups: ‘type A’ errors, which indicate that the signal quality is poor but the tumour appears to be within the gating window, and ‘type B’ errors, which indicate that the tumour position is unknown, and may not be within the gating window. Although it is not possible to know with certainty whether a given incident is type A or type B, we estimated their relative frequency by manual inspection of 100 randomly
selected incidents at FAR=0.05 and FAR =0.10. If a conclusive classification was not
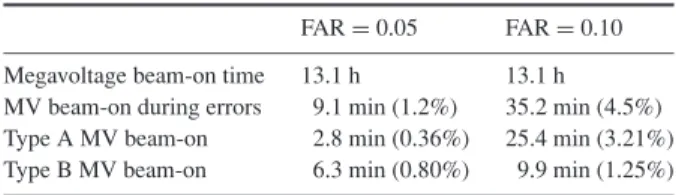
Table 2.Analysis of errors with respect to MV beam-on time. FAR=0.05 FAR=0.10 Megavoltage beam-on time 13.1 h 13.1 h MV beam-on during errors 9.1 min (1.2%) 35.2 min (4.5%) Type A MV beam-on 2.8 min (0.36%) 25.4 min (3.21%) Type B MV beam-on 6.3 min (0.80%) 9.9 min (1.25%)
It is seen that there is approximately a 1% occurrence of MV treatment beam delivery while the position of the tumour is unknown.
4. Summary
Because tracking errors cannot always be avoided, automatic tracking error detection is an essential component of imaging systems that perform real-time motion compensated radiotherapy. Four indicators useful in detecting tracking errors have been evaluated, and the distance between rays (DBR) was found to give the best detection accuracy. The efficiency of error detection for the prototype RTRT system was evaluated, and we found that approximately 60% of unrecoverable tracking errors could be detected within 1 s. The loss of efficiency due to tracking errors was found to be approximately 7 to 10% of kV beam-on time. The effect of tracking errors on treatment beam delivery was analysed, and it was found that the tumour position was unknown during approximately 1% of MV beam delivery.
References
Adler J R Jr, Murphy M J, Chang S D and Hancock S L 1999 Image-guided robotic radiosurgeryNeurosurgery 441299–306 (discussion 1306–7)
Berbeco R I, Jiang S B, Sharp G C, Chen G T Y, Mostafavi H and Shirato H 2004 Integrated radiotherapy imaging system (IRIS): design considerations of tumor tracking with linac gantry-mounted kV x-ray systemsPhys. Med. Biol.49243–55
Bishop C 1995Neural Networks for Pattern Recognition(Oxford: Oxford University Press) Duda R O, Hart P E and Stork D G 2001Pattern Classification(New York: Wiley)
Harada T, Shirato H, Ogura S, Oizumi S, Yamazaki K, Shimizu S, Onimaru R, Miyasaka K, Nishimura M and Dosaka-Akita H 2002 Real-time tumor-tracking radiation therapy for lung carcinoma by the aid of insertion of a gold marker using bronchofiberscopyCancer951720–7
Hummel J, Figl M, Kollmann C, Bergmann H and Birkfellner W 2002 Evaluation of a miniature electromagnetic position trackerMed. Phys.292205–12
Keall P J, Kini V R, Vedam S S and Mohan R 2001 Motion adaptive x-ray therapy: a feasibility study.Phys. Med. Biol.461–10
Keall P J, Kini V R, Vedam S S and Mohan R 2002 Potential radiotherapy improvements with respiratory gating Australas. Phys. Eng. Sci. Med.251–6
Kubo H D and Hill B C 1996 Respiration gated radiotherapy treatment: a technical studyPhys. Med. Biol.4183–91 Kubo H D, Len P M, Minohara S and Mostafavi H 2000 Breathing-synchronized radiotherapy program at the
University of California Davis Cancer CenterMed. Phys.27346–53
Mageras G S and Yorke E 2004 Deep inspiration breath hold and respiratory gating strategies for reducing organ motion in radiation treatmentSemin. Radiat. Oncol.1465–75
Minohara S, Kanai T, Endo M, Noda K and Kanazawa M 2000 Respiratory gated irradiation system for heavy-ion radiotherapyInt. J. Radiat. Oncol. Biol. Phys.471097–103
Murphy M J 2002 Fiducial-based targeting accuracy for external-beam radiotherapyMed. Phys.29334–44 Murphy M J 2004 Tracking moving organs in real timeSemin. Radiat. Oncol.1491–100
Murphy M J, Chang S D, Gibbs I C, Le Q T, Hai J, Kim D, Martin D P and Adler J R Jr 2003 Patterns of patient movement during frameless image-guided radiosurgeryInt. J. Radiat. Oncol. Biol. Phys.551400–8
Neicu T, Shirato H, Seppenwoolde Y and Jiang S B 2003 Synchronized moving aperture radiation therapy (SMART): average tumour trajectory for lung patientsPhys. Med. Biol.48587–98
Ohara K, Okumura T, Akisada M, Inada T, Mori T, Yokota H and Calaguas M J 1989 Irradiation synchronized with respiration gateInt. J. Radiat. Oncol. Biol. Phys.17853–7
Ozhasoglu C, Murphy M J, Glosser G, Bodduluri M, Schweikard A, Forster K M, Martin D P and Adler J R 2000 Real-time tracking of the tumor volume in precision radiotherapy and body radiosurgery—a novel approach to compensate for respiratory motionProc. 14th Int. Conf. on Computer Assisted Radiology and Surgery (CARS 2000) (San Francisco, CA)ed H U Lemke, M W Vannier, K Inamura, A G Farman and K Doi pp 691–6 Ramsey C R, Cordrey I L and Oliver A L 1999a A comparison of beam characteristics for gated and nongated clinical
x-ray beamsMed. Phys.262086–91
Ramsey C R, Scaperoth D, Arwood D and Oliver A L 1999b Clinical efficacy of respiratory gated conformal radiation therapyMed. Dosim.24115–9
Schweikard A, Glosser G, Bodduluri M, Murphy M J and Adler J R 2000 Robotic motion compensation for respiratory movement during radiosurgeryComput. Aided Surg.5263–77
Seiler P G, Blattmann H, Kirsch S, Muench R K and Schilling Ch 2000 A novel tracking technique for the continuous precise measurement of tumour positions in conformal radiotherapyPhys. Med. Biol.45N103–N110 Shimizu S, Shirato H, Kitamura K, Shinohara N, Harabayashi T, Tsukamoto T, Koyanagi T and Miyasaka K 2000
Use of an implanted marker and real-time tracking of the marker for the positioning of prostate and bladder cancersInt. J. Radiat. Oncol. Biol. Phys.481591–7
Shimizu S, Shirato H, Ogura S, Akita-Dosaka H, Kitamura K, Nishioka T, Kagei K, Nishimura M and Miyasaka K 2001 Detection of lung tumor movement in real-time tumor-tracking radiotherapyInt. J. Radiat. Oncol. Biol. Phys.51304–10
Shirato H, Shimizu S, Shimizu T, Nishioka T and Miyasaka K 1999 Real-time tumour-tracking radiotherapyLancet 3531331–2
Shirato Het al2000a Four-dimensional treatment planning and fluoroscopic real-time tumor tracking radiotherapy for moving tumorInt. J. Radiat. Oncol. Biol. Phys.48435–42
Shirato Het al2000b Physical aspects of a real-time tumor-tracking system for gated radiotherapyInt. J. Radiat. Oncol. Biol. Phys.481187–95
Shirato Het al2003 Feasibility of insertion/implantation of 2.0-mm-diameter gold internal fiducial markers for precise setup and real-time tumor tracking in radiotherapyInt. J. Radiat. Oncol. Biol. Phys.56240–7 Suh Y, Yi B, Ahn S, Kim J, Lee S, Shin S, Shin S and Choi E 2004 Aperture maneuver with compelled breath (AMC)
for moving tumors: a feasibility study with a moving phantomMed. Phys.31760–6
Vedam S S, Keall P J, Kini V R and Mohan R 2001 Determining parameters for respiration-gated radiotherapyMed. Phys.282139–46