59 | P a g e
STRATIFIED SAMPLING VOXEL CLASSIFICATION
FOR SEGMENTATION OF OCT IMAGES USING
NORMALIZED GRAPH CUT SEGMENTATION WITH
MFCM CLUSTERING
Archanaa. S
1, Usha. A
21,2
Dept of ECE, Easwari Engineering College
ABSTRACT
One of the ocular disorder is age related macular degradation(AMD) which is a factor caused mainly due to
ageing or glaucoma. OCT images provides a non-invasive and contactless method which provides access to
monitor the progression of disease. Automated detection is implemented only for accurate segmentation. This
paper provides an improvised algorithm for automated detection of retinal detachment thereby enabling easier
diagnosis. The main problem with OCT images is that it is corrupted by speckle noise which makes the analyse
difficult. In our algorithm, pre-processing use Adaptive median filter for denoising followed by image
enhancement. Modified fuzzy-c means clustering (MFMC)graph cut is used for segmentation the abnormalities
can be obtained from the datasets enabling automated evaluation. Classification is executed using texture,
thresholding, and morphological operation. This approach reduces the false positives and increases the
accuracy.
Keywords: Age related macular degradation, Modified fuzzy C-means clustering, Optical coherence
tomography, retinal detachment.
I. INTRODUCTION
Around the world about 3 million people are affected by ocular disease. One of such disease is age related
macular degradation(AMD). This may be mainly due to glaucoma or aging which can lead to blindness of the
victim. AMD results in retinal detachment or swollen retinal layer. In such case, the retinal fluids enter beneath
the affected area resulting is poor eyesight. The affected area is diagnosed by surgery or laser treatment. In laser
treatment, the detached layers are subjected to head and a bond made between the layers recovering the original
position. OCT image provides a non-invasive imaging technique with microscopic resolution. The main
problem in OCT is that it is affected by speckle noise which degrades the image contrast with grainy and low
intensity features [1] and [6]. In order to remove speckle noise several filters such as median filter [2] and [3],
anisotropic diffusion filter [4], bilateral filter [5] have been used. Pre-processing involves denoising and image
enhancement. Most of the algorithm use filter window which suppresses the speckle noise level in homogeneous
60 | P a g e
reduction is to remove the noise without losing much detail contained in an image. However, due to thepresence of the speckle noise, imaging contrast is reduced making the boundaries between highly scattering
structures in tissue difficult to differentiate. As a result, this inevitably affects human interpretation of the
images as well as the future development of computer assisted OCT techniques for accurate quantification.
II. METHODOLOGY
2.1 Pre-Processing
The Pre-Processing stage equalizes the uneven illumination associated with OCT images and also removes noise
present in the image. Segmentation stage clusters the image into two distinct classes (blood vessel) while the
Disease Classifier stage was used to distinguish between candidate blood vessel and other information. In this
paper, adaptive median filter is used for denoising of the image. The simplest and best investigated diffusion
method for smoothing images is to apply a linear diffusion process. We shall focus on the relation between
linear diffusion filtering and the convolution with a Gaussian and analyse its smoothing properties for the image
as well as its derivatives and look over the fundamental properties of the Gaussian scale-space which is induced
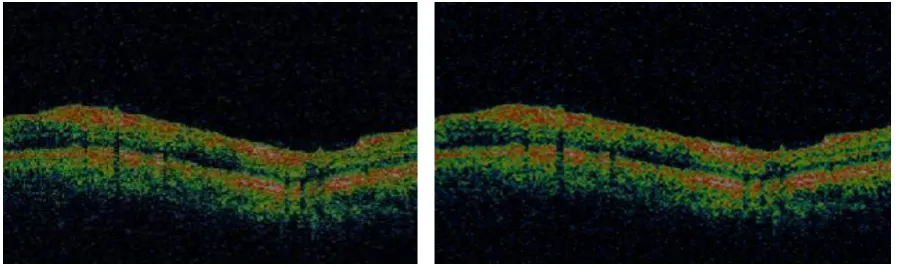
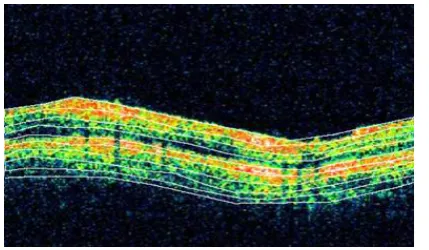
by linear diffusion filtering. The OCT input is shown in Fig 1.1.
Fig 1.1. Input Image Fig 1.2 Adaptive Median Filter Output
The image is denoised by means of adaptive bilateral filter as shown in Fig 1.2
III. IMAGE ENHANCEMENT
In general, to improve the contrast of the image adaptive histogram equalization(AHE) is used. It is a
computerized technique. In this technique, several histograms are computed which are different sections of the
image. These images are used to redistribute the enhanced pixel values of the image. Hence, the local contrast of
the image is increased along with improvised property detail of the image. The main problem with AHE is that
it overamplifies the homogeneous regions of the image. To overcome this problem contrast limited adaptive
histogram equalization(CLACHE) technique is used which prevents overamplification. It is important to
preserve the boundary properties of the image since the region of interest should be highlighted and it is used to
find the difference between the normal and abnormal retinal layers. For inner and outer boundary detection
61 | P a g e
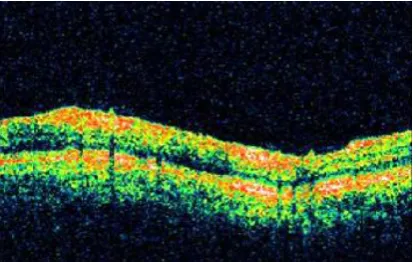
thresholding based enhancement is used. This focuses mainly on every pixel which holds the information whichis obtained from the filtered output.
Fig 2.1 Enhanced Image
IV. SEGMENTATION
Eyes with abnormalities have changes in the structure of blood vessel. Segmentation of blood vessels in OCT
image[10] enables diagnosis at early stage.by automating this process the subjectivity can be minimised. This
also avoids the painstaking procedure converts the tedious task into a simpler one. Previous approaches provides
better result hence, improvising the techniques to be a quicker and easier is the main goal of image processing.
Abnormalities in blood vessels cause discontinuities in boundaries of the retinal layers. The robustness of the
algorithms in the presence of blood vessel artifacts[11],[12,[13] can decrease the quality of the image. The
gradient of an image measures how it is changing. It provides the magnitude and direction of the image. The
magnitude of the gradient shows how fast the image is changing, while the direction of the gradient shows the
direction in which the image is changing most rapidly. To illustrate this, assume the image as like a terrain, in
which at each point we are given a height instead of intensity. Any point in the terrain is the direction of the
gradient that would be the direction uphill. For a small step, uphill, the magnitude of the gradient would tell us
how rapidly our height increases. Since the gradient has a direction and a magnitude, the information can be
encoded in a vector. The length of this vector provides the magnitude of the gradient, while its direction gives
the gradient direction. The gradient may be different at different location so, we represent it with a different
vector at every image location. Initially the computation of the gradient at an image location is shown. Then the
computation which actually encodes the gradient direction and magnitude is shown. The gradient vector can be
formed by combining the partial derivatives of the image along the x and y direction. We can represent this as:
To have a clear idea, we review the partial derivatives. When we consider the partial derivative of I with respect
to x, then the rapid change of image intensity with respect to changes in x can be determined. The direction of
62 | P a g e
Image gradients are commonly used for edge detection. After the computation of gradient image, the pixel withlarge gradient value is assigned to be the edge pixel. The direction of the edges is perpendicular to that of the
gradient and hence can be traced. In this paper, we use canny edge detector for edge detection. A graph-based
approach makes use of efficient solutions of the maxow/mincut problem between source and sink nodes in
directed graphs. The set of nodes is equal to the set of pixels in the image. Every pixel is connected with its
neighbourhood pixel. A directed or undirected graph is partitioned to disjoint sets which is known as normalised
graph cut segmentation. By associating energy to each cut the concept of optimality of the cuts is introduced.
Based on the degree of variability of neighbouring group of pixels in the image, the segmentation criterion can
be adjusted. Hence it is an adaptive technique but cannot be used for small contours efficiently. Nevertheless,
ever since it became apparent that many low-level vision problems can be posed as finding energy minimizing
cuts in graphs these techniques have received a lot of attention in the computer vision community. Image
restoration, texture synthesis and image segmentation are some of the areas where graph cut method has been
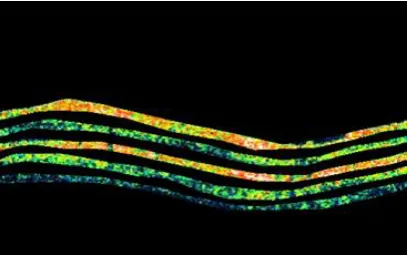
successfully implemented. We can segment the retinal layers of the OCT image as shown in fig 3.1
Fig 3.1 Normalised Graph Cut Segmentation
Its simplicity and speed enables it to run on large datasets. Pixels are represented as nodes in graph and edges
are formed between the nodes with weights corresponding to two similar pixels. The pixels within a smaller and
pre-determined neighbourhood N are considered for reducing the number of edges in the graph. The two
terminal nodes are represented as object and background where the source the sink are not related to any pixel
in the image. Object and background models are used to determine the corresponding weights. Edges are formed
between the source and sink and all other non-terminal nodes. This segmentation should have a partition such
that the similar pixels are which are close to each other belong to the same partition depicting the image pixel
resemblance.
4.1. CLUSTERING
A clustering method such as k-means clustering is used to form clusters as shown in the fig 4.1. The distances
are calculated using Mahalanobis and Euclidean distance. K means algorithm is an iterative technique which is
used to segment the image into k clusters. By using the grayscale intensity of each pixel, the K-Means
63 | P a g e
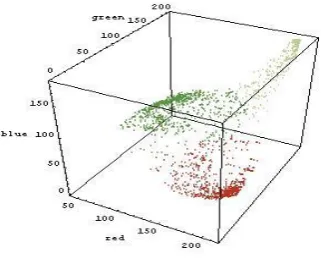
partitions. In order to increase the number of results available and to study the effects due to variation of theparameter the number of partitions used are varied as that of in colour image segmenting setup.
Fig 3.2 Colour Based Clustering
For this case, the same initial partitions as used in the colour segmentation along with K-Means were used in
order to make the comparison of results more meaningful. The initial random assignment is an important factor
sine the resulting cluster depends on it and so the result is not the same for each run which is a drawback. It
minimizes the intra-cluster variance but does not ensure that the result has a global minimum of variance. The
k-means clustering algorithm is commonly used in computer vision as a form of image segmentation. The results
of the segmentation are used to aid border detection and object recognition. In this context, the standard
Euclidean distance is usually insufficient in forming the clusters. Instead, a weighted distance measure utilizing
pixel coordinates, RGB pixel color and/or intensity, and image texture is commonly used. To access the
diameter and tortuosity of blood vessels manual planimetry methods were used. To segment blood vessels and
optic disc curvelet transforms, contourlet transforms, watershed segmentation, were used. Efficient pixel
segmentation is not possible. Vessel tracking is not implemented in the existing system. Thin vessel pixels
cannot be segmented properly due to the low illumination and brightness. They are not fit for noisy medical
image edge detection because noise and edge belong to the scope of high frequency.
4.2. Modified Fuzzy C Means Clustering
In case of retinal disorders the characteristics of the blood vessels in the retina have some variation.
Segmentation of blood vessels is a tedious task in oct image. This paper presents an improvised algorithm for
such segmentation. Fuzzy c means algorithm [7] has robust characteristics for ambiguity. Hence it can retain
more information. Different textures are separated by edges which acts as boundaries. The separation in image
intensity from one pixel to another are also known as edges. Edges are important characteristics of an image
since it denotes a higher frequency. By highlighting the edges of the image, process such as image
segmentation, data compression and reconstruction can be done easily. This algorithm uses texture for edge
detection and provides the first and second order derivatives of the image. Thereby providing even small details
64 | P a g e
Fig 3.3 FCM Based Normalised Graph Cut Segmented ImageV. CONCLUSION
We reported a fluid-associated abnormality detection and segmentation method in this manuscript. Detection
and segmentation of fluid-associated abnormalities in clinical data is a challenging problem in several aspects.
Patients might have different severity of disease, which makes the size, location, and shape of fluid regions
unpredictable. Moreover, simultaneously improving true positives and controlling false positives is clinically
important. We have introduced a layer-dependent stratified sampling strategy [14]to solve the problem. This
method reduces the smoothing effect and preserves the property of the edges of the image. The accuracy is
relatively higher when compared to other algorithms.
REFERENCE
[1] D. Huang, E. A. Swanson, C. P. Lin, J. S.Schumann, W. G. Stinson, M. Chang, M. R. Hee, T. Flotte, K.
Gregory, C. A. Puliafito, and J. G. Fujimoto, “Optical coherence tomography,” Science, vol. 254, pp.
1178–1181, 1991.
[2] Dara Koozekanani1, Kim Boyer2, Cynthia Roberts1,3, “Retinal Thickness Measurements in Optical
Coherence Tomography Using a Markov Boundary Model” 1Biomedical Engineering Program 2Signal
Analysis and Machine Perception Laboratory 3Department of Ophthalmology, IEEE 2000
[3] A. Loannidis, D. Kazakos, and D. D. Watson, “Application Of Median Filtering On Nuclear Edicine
Scintigrams Images,” in Proc. 7th Conf. Pattern Recognition, 1984, pp. 33–36.
[4] D. C. Fernández, “Delineating Fluid-Filled Region Boundaries In Optical Coherence Tomography
Images Of The Retina,”IEEE Trans. Med. Imag., vol. 24, no. 8, pp. 929–945, Aug. 2005.
[5] Gary R. Wilkins, Odette M. Houghton, and Amy L. Oldenburg, “Automated Segmentation of
Intra-retinal Cystoid Fluid in Optical Coherence Tomography”, IEEE Transactions On Biomedical
Engineering, Vol. 59, No. 4, April 2012
[6] J. M. Schmitt, S. H. Xiang, and K. M. Yung, “Speckle in optical coherence tomography,” J. Biomed.
Optics, vol. 4, pp. 95–95, 1999.
[7] Stelios Krinidis and Vassilios Chatzis ” A Robust Fuzzy Local Information C-Means Clustering
65 | P a g e
[8] Lu Zongqing Liao Qingmin Yang Fan “A Variational Approach To Automatic Segmentation Of Rnfl On
Oct Data Sets Of The Retina” , The Graduate School at Shenzhen, Tsinghua University, Tsinghua
Campus, the University Town, Shenzhen, Guangdong Province, 518055
[9] Yu-ping Wang, Qiang Chen, Sheng-tao Lu “Quantitative Assessments of Cup-to-disk Ratios in Spectral
Domain Optical Coherence Tomography Images for Glaucoma Diagnosis” Yu-ping Wang, Qiang Chen,
Sheng-tao Lu School of Computer Science and Engineering Nanjing University of Science and
Technology Nanjing, China
[10] Jinming Duan_, Christopher Tenchy, Irene Gottlobz, Frank Proudlockz, Li Bai “Optical Coherence
Tomography Image Segmentation” School of Computer Science, University of Nottingham, UK,Medical
School, University of Nottingham, UK, Ophthalmology Department, University of Leicester, UK.
[11] Yang Q, Reisman CA, Wang Z, Fukuma Y, Hangai M, Yoshimura N, et al.” Automated layer
segmentation of macular OCT images using dual-scale gradient information.” Opt
Express. 2010;18:21294–307.
[12] Kafieh R, Rabbani H, Abramoff MD, Sonka M. “Intra-Retinal Layer Segmentation Of 3d Optical
Coherence Tomography Using Coarse Grained Diffusion Map”, submited in Medical Image
Analysis. 2012
[13] Hood DC, Fortune B, Arthur SN, Xing D, Salant JA, Ritch R, et al. “Blood Vessel Contributions To
Retinal Nerve Fiber Layer Thickness Profiles Measured With Optical Coherence Tomography”.
Glaucoma. 2008;17:519–28. [PMC free article] [PubMed]
[14] Xiayu Xu, Kyungmoo Lee, Li Zhang, Milan Sonka, and Michael D. Abràmoff “Stratified Sampling
Voxel Classification for Segmentation of Intraretinal and Subretinal Fluid in Longitudinal Clinical OCT