The auditory cortex of the bat
Phyllostomus
discolor
: Functional organization and
processing of complex stimuli.
Dissertation der Fakultät für Biologie der Ludwig- Maximilians Universität
München
Vorgelegt von Susanne Hoffmann
Contents
ZUSAMMENFASSUNG___________________________________________________________ V
SUMMARY ___________________________________________________________________ VII
GENERAL INTRODUCTION _____________________________________________________ 1
1. PSYCHOPHYSICAL AND NEUROPHYSIOLOGICAL HEARING THRESHOLDS IN THE BAT PHYLLOSTOMUS DISCOLOR____________________________________________ 5
1.1 ABSTRACT__________________________________________________________________ 5
1.2 INTRODUCTION______________________________________________________________ 6
1.3 METHODS __________________________________________________________________ 7
1.3.1 PSYCHOPHYSICS____________________________________________________________ 7
1.3.1.1 Experimental animals_______________________________________________________ 7 1.3.1.2 Experimental setup_________________________________________________________ 7 1.3.1.3 Acoustic stimuli ___________________________________________________________ 8 1.3.1.4 Training procedure_________________________________________________________ 8 1.3.2 NEUROPHYSIOLOGY _________________________________________________________ 9
1.3.2.1 Surgery__________________________________________________________________ 9 1.3.2.2 Recording procedure ______________________________________________________ 10 1.3.2.3 Data analysis ____________________________________________________________ 10
1.4 RESULTS __________________________________________________________________ 11
1.4.1 PSYCHOPHYSICS___________________________________________________________ 11
1.4.2 NEUROPHYSIOLOGY ________________________________________________________ 12
1.5 DISCUSSION________________________________________________________________ 14
1.5.1 COMPARISON WITH NEUROPHYSIOLOGICAL DATA OF OTHER PHYLLOSTOMID BATS_______ 16
1.5.2 COMPARISON WITH BEHAVIORAL AUDIOGRAMS OF OTHER PHYLLOSTOMID BATS ________ 17 1.6 ACKNOWLEDGEMENTS_______________________________________________________ 19
2. THE AUDITORY CORTEX OF THE BAT PHYLLOSTOMUS DISCOLOR:
LOCALIZATION AND ORGANIZATION OF BASIC RESPONSE PROPERTIES _______ 21
2.1ABSTRACT___________________________________________________________________ 21
2.1.1BACKGROUND_______________________________________________________________ 21
2.1.3CONCLUSIONS_______________________________________________________________ 22 2.2BACKGROUND________________________________________________________________ 22
2.3RESULTS____________________________________________________________________ 23
2.3.1AUDITORY RESPONSES IN THE CORTEX OF PHYLLOSTOMUS DISCOLOR____________________ 23
2.3.2NEUROANATOMY____________________________________________________________ 25
2.3.3BASIC NEURONAL RESPONSE PROPERTIES _________________________________________ 29
2.3.4REPRESENTATION OF NEURONAL RESPONSE PROPERTIES IN CORTICAL FIELDS_____________ 32
2.4DISCUSSION__________________________________________________________________ 36
2.4.1COMPARISON WITH THE AUDITORY CORTEX OF OTHER BATS __________________________ 36
2.4.2INFLUENCE OF ANESTHESIA AND MULTI UNIT RECORDINGS ON RESPONSE PATTERNS________ 37
2.4.3PARCELLATION OF THE AUDITORY CORTEX IN P. DISCOLOR ___________________________ 38
2.5CONCLUSIONS________________________________________________________________ 40 2.6METHODS___________________________________________________________________ 41
2.6.1EXPERIMENTAL ANIMALS______________________________________________________ 41
2.6.2ANESTHESIA AND SURGICAL PREPARATION________________________________________ 41 2.6.3STEREOTAXIC PROCEDURE AND VERIFICATION OF RECORDING SITES AND CORRELATION WITH NEUROARCHITECTURAL FEATURES___________________________________________________ 41
2.6.4ACOUSTIC STIMULI AND RECORDING OF NEURONAL RESPONSES________________________ 42
2.6.5DATA ANALYSIS_____________________________________________________________ 44 2.7ACKNOWLEDGEMENTS ________________________________________________________ 45
3. A NEURAL CORRELATE OF STOCHASTIC ECHO IMAGING __________________ 47
3.1ABSTRACT___________________________________________________________________ 47
3.2INTRODUCTION_______________________________________________________________ 47
3.3MATERIALS AND METHODS_____________________________________________________ 48
3.3.1ANIMALS___________________________________________________________________ 48 3.3.2PSYCHOPHYSICS_____________________________________________________________ 49
3.3.3NEUROPHYSIOLOGY__________________________________________________________ 50 3.4RESULTS____________________________________________________________________ 51
3.4.1PSYCHOPHYSICS_____________________________________________________________ 51 3.4.2NEUROPHYSIOLOGY__________________________________________________________ 52
3.4.3COMPARISON OF PSYCHOPHYSICS AND NEUROPHYSIOLOGY___________________________ 56 3.5DISCUSSION__________________________________________________________________ 57
3.6ACKNOWLEDGEMENTS ________________________________________________________ 61
4. AN AREA SENSITIVE TO APPARENT ACOUSTIC MOTION IN THE AUDITORY CORTEX OF THE BAT PHYLLOSTOMUS DISCOLOR_______________________________ 63
4.1ABSTRACT___________________________________________________________________ 63
4.2INTRODUCTION_______________________________________________________________ 64
4.3METHODS___________________________________________________________________ 65
4.3.1EXPERIMENTAL ANIMALS AND SURGICAL PREPARATION______________________________ 65
4.3.3ACOUSTIC STIMULATION USED FOR DETERMINATION OF BASIC NEURONAL RESPONSE PROPERTIES
_______________________________________________________________________________ 66 4.3.4TWO-TONE STIMULI (APPARENT HORIZONTAL ACOUSTIC MOTION) ______________________ 66 4.3.5RECORDING OF NEURAL RESPONSES______________________________________________ 69
4.3.6DATA ANALYSIS_____________________________________________________________ 70
4.3.6.1 Basic response properties ____________________________________________________ 70 4.3.6.2 Response properties to dynamic two-tone stimulation ______________________________ 70
4.4RESULTS____________________________________________________________________ 73
4.4.1MOTION INSENSITIVE UNITS____________________________________________________ 74
4.4.2MOTION SENSITIVE UNITS______________________________________________________ 77
4.4.3REPRESENTATION OF MOTION SENSITIVITY AT THE CORTICAL SURFACE__________________ 82 4.4.4BASIC RESPONSE PROPERTIES OF MOTION SENSITIVE AND INSENSITIVE UNITS IN THE PDF ___ 84 4.4.5MOTION SPECIFIC RESPONSE PROPERTIES OF MOTION SENSITIVE AND INSENSITIVE UNITS IN THE
PDF ___________________________________________________________________________ 84
4.5DISCUSSION__________________________________________________________________ 86
4.5.1COMPARISON TO OTHER STUDIES________________________________________________ 86 4.5.2MOTION SENSITIVITY_________________________________________________________ 87
4.5.3INHIBITION BY DYNAMIC STIMULATION___________________________________________ 89 4.6ACKNOWLEDGEMENTS ________________________________________________________ 90
GENERAL DISCUSSION ________________________________________________________ 91
THE PARCELLATION OF THE PHYLLOSTOMUS AC IN COMPARISON TO OTHER BATS__________ 93 FUNCTIONAL ROLE OF DIFFERENT AUDITORY CORTICAL SUBFIELDS IN BATS _______________ 94
OUTLOOK ____________________________________________________________________ 97
REFERENCES _________________________________________________________________ 99
LIST OF ABBREVIATIONS_____________________________________________________ 113
LIST OF FIGURES ____________________________________________________________ 115
LEBENSLAUF ________________________________________________________________ 117
DANKSAGUNG _______________________________________________________________ 119
Zusammenfassung
Als auditorischer Kortex wird der Teil des Neokortex bezeichnet, der Neurone enthält, die auf akustische Reize antworten. Er stellt die höchste Ebene der Verarbeitung akustischer Information in der aufsteigenden Hörbahn dar. Die in dieser Arbeit zusammengefassten Studien untersuchten den auditorischen Kortex der Fledermaus Phyllostomus discolor mit Hilfe einfacher sowie komplexer akustischer Reize. Innerhalb der Experimente wurden unterschiedliche Methoden verwendet (z.B. Psychophysik und Neuroanatomie). Der Schwerpunkt der Arbeit liegt jedoch auf der elektrophysiologischen Untersuchung des auditorischen Kortex.
Das erste Kapitel beschäftigt sich mit einer Studie, die den Hörbereich von P. discolor anhand neuronaler Hörschwellen und Verhaltenshörschwellen untersuchte. Die Ergebnisse dieser Studie zeigen, dass akustische Reize mit einer Frequenz zwischen 4 und 100 kHz von
P. discolor wahrgenommen werden konnten. Die niedrigsten Hörschwellen wurden im hochfrequenten Bereich über 35 kHz gemessen. Das verdeutlicht die hohe Sensitivität des Hörsystems von Phyllostomus gegenüber Frequenzen im Ultraschallbereich, die z.B. in den Echoortungslauten dieser Tiere enthalten sind. Die neuronalen Hörschwellen sowie die Verhaltenshörschwellen von P. discolor lagen in einem Bereich, der auch bei anderen Fledermausarten beobachtet wurde.
Einhüllenden eines Signals beschreibt und die besonders wichtig für die Diskrimination komplexer Strukturen wie z.B. Büsche oder Bäume ist. Bäume mit großen Blättern produzieren rauere Echos als Bäume mit kleinen Blättern oder Nadeln. Wie in Kapitel drei beschrieben, haben die neurophysiologischen Experimente zu dieser Studie eine Neuronenpopulation im anterioren Teil des auditorischen Kortex aufgedeckt, die Echorauhigkeit in ihrer Antwortrate kodierten. Die Antwort dieser Neurone konnte mit dem psychophysikalischen Diskriminationsvermögen von P. discolor in Beziehung gesetzt werden.
In dem in Kapitel vier beschriebenen Experiment, wurden Reintonpaare verwendet, um Echos von einem sich bewegenden Objekt oder von einem stationären Objekt welches von einer Fledermaus angeflogen wird zu simulieren. Im posterioren dorsalen Feld des auditorischen Kortex von P. discolor wurde eine bewegungssensitive Neuronenpopulation gefunden, die stark faszilitierend auf dynamische Stimulation im Vergleich zu statischer Stimulation antwortete. Ein Teil dieser bewegungssensitiven Neurone konnte das dynamische azimuthale rezeptive Feld bei kleinen zeitlichen Abständen zwischen den zwei Reintönen des dynamischen Reizes auf kleine Areale im frontalen Bereich fokussieren. Die Antwort dieser Neurone scheint für das aktive Nachverfolgen eines Zielobjektes während einer Annäherung durch die Fledermaus wichtig zu sein.
Die in dieser Arbeit präsentierten Ergebnisse zeigen, dass der auditorische Kortex von
Summary
The auditory cortex is the acoustically responsive part of the neocortex and represents the highest level of processing of the ascending auditory pathway. The experiments described in this thesis were designed to study the auditory cortex of the microchiropteran bat
Phyllostomus discolor with both, simple and complex acoustic stimuli. During the experiments, different methods were used (e.g. psychophysics and neuroanatomy), but the main focus was laid on the electrophysiological examination of the auditory cortex.
The first chapter covers a study that investigated the hearing range of P. discolor by measuring neural and behavioral audiograms in this species. This study shows that acoustic stimuli at frequencies between 4 and 100 kHz could elicit either a neuronal or behavioral response in P. discolor. Lowest thresholds were found in the high frequency range above 35 kHz indicating the high sensitivity of the auditory system of P. discolor to ultrasonic sounds as for example contained in echolocation calls. However, electrophysiologically and psychophysically determined hearing thresholds lay in the range of thresholds known for other bat species.
The second chapter describes a study that determined the location, extend, and subdivision of the auditory cortex of P. discolor. The area that contained acoustically responsive neurons was laterally positioned at the caudal part of the neocortex. Within this area four major cortical subfields could be distinguished based on neuroanatomical and neurophysiological criteria. The two ventral fields were tonotopically organized and were assumed to belong to the “core” region of the auditory cortex. The posterior ventral field showed properties similar to that found in the primary auditory cortex of other mammals, whereas, the anterior ventral field seems to resemble the anterior auditory field of the mammalian auditory cortex. The two dorsally located subfields did not show a clear tonotopy, but contained neurons, which were mainly responsive to high frequencies above 45 kHz. As the dominant harmonics of the echolocation call of P. discolor cover this high frequency range, the anterior and posterior dorsal fields seem to be strongly involved in processing of information obtained from echolocation.
in their response rate. The response of these neurons could be correlated to the behaviorally measured discrimination performance of P. discolor.
In the experiment described in chapter four, pairs of pure tones were used to simulate either echoes from an object moving in azimuth or echoes from a stationary object encountered by a bat during approach. In the posterior dorsal field of the auditory cortex of P. discolor a population of motion sensitive neurons was found, which showed strong response facilitation to dynamic stimuli in contrast to static stimulation. In a subset of motion sensitive neurons the dynamic azimuthal response range was focused to small areas in the frontal field at short temporal intervals between the two components of the dynamic stimuli. The response of these neurons might be important for the tracking of targets during an approach by the bat.
General introduction
The general objective of this thesis was to functionally characterize different subfields of the auditory cortex (AC) in the bat Phyllostomus discolor. Microchiropteran bats use echolocation to navigate and forage in complete darkness. They emit ultrasonic calls and listen to the modified echoes reflected from nearby obstacles or prey. This process of “active hearing” is special to microbats and cetaceans, whereas most other mammals rely mainly on “passive hearing”.
The temporal and spectral structure of the echolocation calls used by different bat species is adapted to the specific habitat and foraging behavior of the species (Neuweiler 1990). Long-duration constant-frequency (CF) echolocation calls are used by bats that mainly hunt flying insects in dense foliage (CF/FM-bats, e.g. Rhinolophus rouxi and Pteronotus parnellii), exploiting the small amplitude- and frequency-modulations imprinted by the wing beats of the insect on the CF component of their calls (Schuller 1984). FM-bats that preferentially hunt insects in open space like Myotis lucifugus and Eptesicus fuscus use short-duration frequency-modulated (FM) calls yielding good ranging accuracy (Simmons et al. 1979). P. discolor
belongs to the microchiropteran family Phyllostomidae. It uses short FM echolocation signals for orientation and shows a mainly frugivorous foraging behavior. Although it once in a while enriches its diet with small insects living at the collected fruits, it never actively hunts flying insects.
The basic structure and function of the microchiropteran auditory system follows in general the mammalian plan. The ability of many bat species to process spectral or temporal information with extreme accuracy shows up in neural overrepresentation of specific parameters. Also brain structures mediating auditory control of motor, e.g. vocal activity are more conspicuous than in non-echolocating mammals (for review: Covey 2005). Neuroanatomical specializations associated with echolocation may originate in the cochlea and lower brainstem and may be traceable throughout the ascending auditory pathway (Vater et al. 1985; Zook and Leake 1989; O'Neill 1995; Covey 2005). Functional specializations related to echolocation, as e.g. neurons preferentially responding to combinations of echolocation call and echo, can be observed from the auditory midbrain to the AC of bats (Suga and Horikawa 1986; Schuller et al. 1991; Tanaka et al. 1992; Wenstrup and Grose 1995; Wenstrup et al. 1999). The functional specializations of the AC are highly species-specific, and show considerable differences among bat species.
P. parnellii and R. rouxi, the AC has been intensely studied (O'Neill and Suga 1982; Suga et al. 1987; Radtke-Schuller and Schuller 1995; Radtke-Schuller 2001). Although, FM-bats constitute the majority of echolocating bat species, data on anatomical and neurophysiological properties and on the function of subfields of the AC in FM-bats are comparably rare (Wong and Shannon 1988; Dear et al. 1993; Esser and Eiermann 1999). P. discolor was chosen as experimental animal in order to study the functional organization of different auditory cortical fields in a frugivorous FM-bat.
The range of frequencies and intensities an animal can hear is described by the audiogram and the frequency/intensity plane above. Audiograms can be evaluated behaviorally or as neural audiograms at different levels of the auditory pathway. In the bat P. discolor, neural audiograms were measured quantitatively in the inferior colliculus (IC) and the AC, and additionally, a behavioral audiogram was established during the first series of experiments. It is well known, that the AC in different animals consists of a varying number of subfields in mostly species-specific arrangement. These subfields are characterized by cytoarchitectural features of the neurons, the afferent connections from thalamic structures and the efferent target structures, as well as by the physiological response properties of their neurons. In general, auditory cortical subfields are assigned to either the “core” or “belt” region (nomenclature adopted from Pandya and Sanides 1973). Subfields of the core region such as the primary auditory field (AI) and the anterior auditory field (AAF) represent the region where main afferent auditory input reaches the AC. Thus, AI and AAF receive strong connections from the ventral division of the medial geniculate body (MGB) of the thalamus (Andersen et al. 1980; Radtke-Schuller 2004), which in turn gets afferent input from the central nucleus of the IC. In addition, both core areas show tonotopic organization of opposed gradients that reflect the cochlear frequency representation. In contrast, subfields of the belt region are usually less tonotopically organized, and they receive their inputs mainly from the dorsal nucleus of the medial geniculate body (Andersen et al. 1980; Radtke-Schuller et al. 2004). In the second series of experiments, the AC of Phyllostomus was subdivided into different subfields using the measure of general neurophysiological characteristics of the neurons, as well as differences in neuroanatomical features. This basic delimitation of fields served as foundation for the third and fourth study where functional properties in the subfields could be specified in detail, and subfields could be investigated regarding their contribution to processing of complex temporal and spatial tasks.
When the echolocation call impinges on an object it is convolved with the IR of the object and reflected back to the bat. If the bat’s auditory system can extract and analyze the imprinted IR from the modified sonar emission the bat has access to an acoustic image of the ensonified object. In a behavioral study it has been shown that P. discolor is able to discriminate and classify echoes generated with IRs of different roughness (Grunwald et al. 2004). The identification of natural objects (e.g. landmarks for orientation) by classification of their echoes is supposed to facilitate navigation within a complex environment. In addition, as a fruit tree with relatively few but large leaves produces echoes with higher roughness, than a conifer with numerous small leaves, recognition of foliage types based on roughness may facilitate the bat’s decision whether to approach a certain tree to collect fruits or not. Up to now, neural processing of echo roughness has not been studied.
This reasoning motivated the third series of experiments in which a neural correlate of statistical echo analysis, i.e. neural coding of echo roughness, was found in the AC of
P. discolor. Additionally, the behavioral threshold for auditory-object discrimination based on echo roughness was determined.
As stationary events are comparably rare during a bat’s life, whereas detection and locating of moving targets is most important, the responses of auditory cortical neurons to apparent acoustic motion stimuli were examined in the fourth series of investigations. Unlike in the visual system where motion is represented already at the sensory level of the retina, the perception of acoustic motion is more complex. The position of an echo source in the bat’s body centered space is computed from interaural differences in intensity and arrival time, and also the spectrum differences at both ears give cues for direction. Due to the pulse like emission pattern of the echolocation calls, the bat obtains a stroboscopic view of its environment. The temporal resolution of the perceived dynamic scene depends on the rate of sonar emissions.
A change in spatial position of a target relative to the bat whether induced by motion of the target or by movements of the bat itself, causes a change in interaural parameters between successive echoes reflected from the moving target. These differences of interaural parameters between successive echoes should provide the bat with the necessary information to evaluate the momentary position of a target and to eventually track it.
The present research (fourth study series) shows that a subset of neurons in the AC of the frugivorous FM-bat P. discolor is indeed capable to encode fast azimuthal movements. Cortical neurons that exhibit enhanced activity when stimulated with sounds moving in azimuth are not uniformly scattered over cortical subfields but cluster to a circumscribed posterior location in a dorsal subfield.
Dorsally positioned non-primary auditory cortical subfields seem to have a strong involvement in processing of echo-information, a view, supported by two major points: First, neurons responding best to frequencies within the range of the dominant harmonics of the echolocation call are overrepresented, and second, neurons showing behaviorally relevant functional properties like sensitivity to echo roughness and enhanced responses to specific acoustic motion stimuli are aggregated in these subfields.
The evaluation of the specificity for echolocation of certain subfields of the AC in
1.
Psychophysical and neurophysiological hearing
thresholds in the bat
Phyllostomus discolor
This study was published in 2008 by Susanne Hoffmann*, Leonie Baier*, Frank Borina*, Gerd Schuller, Lutz Wiegrebe and Uwe Firzlaff in the Journal of Comparative Physiology A: Neuroethology, Sensory, Neural, and Behavioral Physiology (Vol. 194, pp. 39-47, * = contributed equally).
The psychophysical experiment was designed and implemented by Lutz Wiegrebe. The training of the animals, the acquisition and analysis of psychophysical data was done by Leonie Baier. The neurophysiological experiment for studying the IC was designed and implemented by Frank Borina and Lutz Wiegrebe. Frank Borina performed the neurophysiological recordings in the IC and analyzed the data. The neurophysiological experiment for studying the AC was designed by Uwe Firzlaff, and implemented by Uwe Firzlaff and myself. The acquisition of neurophysiological data in the AC was done by Uwe Firzlaff and me. I did the analysis of the cortex-data. Gerd Schuller provided the equipment for both neurophysiological setups. The paper was written and proofread, respectively, by Uwe Firzlaff and myself, and Lutz Wiegrebe and Gerd Schuller.
1.1
Abstract
1.2
Introduction
Up to now, behavioral auditory thresholds have been measured in several bat species belonging to the neotropical family Phyllostomidae: P. discolor (Esser and Daucher 1996),
Phyllostomus hastatus (Koay et al. 2002; Bohn et al. 2004), Carollia perspicillata (Koay et al. 2003), and Artibeus jamaicensis (Heffner et al. 2003). Bats of this family utter broadband, multi-harmonic and downward frequency-modulated (FM) echolocation calls and are therefore described as FM-bats. In general, the audiograms of these bats are broadly V-shaped with a region of maximal sensitivity (ca. 0 dB SPL threshold) in the low frequency range. The slope of threshold curves is much steeper at the high frequency side than that at the low frequency side. In contrast to the audiogram of the constant frequency (CF) bat Rhinolophus ferrumequinum (Long and Schnitzler 1975), which shows a narrowly tuned additional threshold minimum in the range of the dominant harmonic of the echolocation call, the audiograms of FM-bats show no obvious specializations for echolocation behavior.
Phyllostomus discolor is a medium sized species of the subfamily Phyllostominae. The omnivorous bat is widely distributed in Central and South America. In its natural environment, ithas to navigate through highly structured surroundings using echolocation for orientation. It emits brief (<3 ms), broadband, multiharmonic and downward frequency-modulated sweeps. The fundamental frequency of the echolocation calls is frequency-modulated around 20 kHz, but most energy is contained in the frequency range between 40 and 90 kHz. Maximum sound pressure levels up to 86 dB SPL were measured in a stationary bat at a distance of 10 cm in front of the mouth (Rother and Schmidt 1982). Due to these low intensity echolocation calls, P. discolor as well as other phyllostomid bats is described as “whispering bat”. In contrast, echolocation calls of insectivorous bats are generally louder, e.g. Myotis lucifugus (Grinnell and Griffin 1958).
Furthermore, P. discolor uses a rich repertoire of social calls for species-specific communication. These directive calls (e.g. mother-infant communication) cover a frequency range from 11 to 54 kHz (Esser and Schmidt 1990). In contrast to high-frequency echolocation calls, these low frequency social calls reach a higher maximum sound pressure level (up to 110 dB SPL) and are longer in duration (about 50 ms). Based on their physical structure, social calls seem to be adequate for long distance communication whereas low intensity echolocation calls appear to be used for near distance exploration of the environment (Esser and Daucher 1996).
P. discolor has often been used as an animal model for behavioral and physiological research in the mammalian auditory system (Esser and Schmidt 1990; Esser and Kiefer 1996; Esser and Lud 1997; Grunwald et al. 2004; Wittekindt et al. 2005; Firzlaff et al. 2006; Schuchmann et al. 2006; Firzlaff et al. 2007). In order to correctly design and carry out studies on the auditory system of P. discolor, basic information about its hearing ability is necessary. Therefore, we re-determined the behavioral hearing thresholds of this species. This data is compared to neurophysiologically measured best frequency (BF) thresholds of single neurons and small neuronal clusters in the inferior colliculus (IC) and the auditory cortex (AC) of
P. discolor.
1.3
Methods
1.3.1 Psychophysics
1.3.1.1 Experimental animals
Four adult male P. discolor were trained to perform the behavioral experiment. The bats originated from a breeding colony in the Department II of the Ludwig-Maximilians University in Munich. Experimental training sessions were performed at five days a week. During these days, the bats received food (a mixture of banana pulp, infant milk powder and honey) only as a reward for successful training inside the setup. On the two resting days of the week the bats were fed with fruits as well as meal worms (larvae of Tenebrio molitor). Thus the animals’ body weight could be kept between 30 and 40 grams which roughly corresponds to the naturally occurring body weight of 29.5 to 31.5 g (Goodwin and Greenhall 1961). Animals had free access to water at all times.
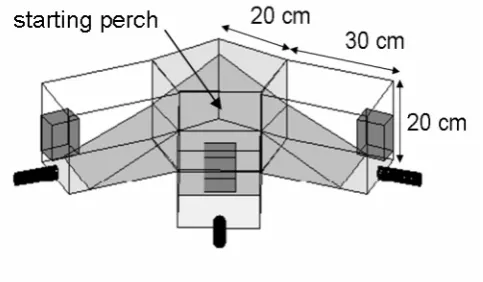
1.3.1.2 Experimental setup
Fig. 1.1 Schematic drawing of the 3AFC setup used for the psychophysical experiments. The dark grey boxes represent the loudspeakers. The black tubes represent the feeders. The angle between the midline of two channels was 72°.
1.3.1.3 Acoustic stimuli
The stimuli were band-pass filtered noise with a duration of 500 ms (including 10 ms raised-cosine rise/fall time) The -3 dB bandwidth was ±10 % of the centre frequency; the slope of the filters was 24 dB per octave. Stimuli were presented at a period of 1 s. Thresholds were obtained for eight centre frequencies equally spaced along a logarithmic frequency axis between 4.5 and 80 kHz (4.5, 6.8, 10.3, 15.5, 23, 35, 53, and 80 kHz). Thus, the highest presented frequency was about 88 kHz. Unfortunately, we could not play back band-pass noise with the next higher centre frequency, 120 kHz. The bandwidth of this stimulus would have reached up to 132 kHz which is well beyond the Nyquist frequency of our D/A converter (see below). For all centre frequencies, the sound pressure level at the starting position was calibrated for the three loudspeakers separately.
All stimuli were computer generated and converted by a real-time processor (RP2.1, Tucker Davis Technologies, Gainsville, USA). The sampling rate was set to the maximum for this device, 196 kHz. The stimuli were attenuated using a programmable attenuator (PA5, Tucker Davis Technologies, Gainsville, USA), amplified by a power amplifier (iP900, LAB. Gruppen, Kungsbacka, Sweden) and a high-power passive end attenuation of 40 dB. Then, stimuli were switched to one of the three speakers with a custom-made, computer-controlled passive switch located outside the experimental chamber. Due to the passive end attenuation, background noise was very low.
1.3.1.4 Training procedure
if any light-barrier was interrupted, but at the latest after 20 seconds. Correct decisions were rewarded with food from the computer-controlled feeders. Once a stable level of correct choices (>70 %) had been established by a particular bat, the collecting of threshold data started. To determine the auditory threshold for a particular centre frequency, psychometric functions were obtained for stimulus attenuations varied in steps of 5 dB. Each point of the psychometric functions is based on at least 30 decisions. A sigmoid function was fitted to the psychometric function and the 47 % correct value of this fit was taken as threshold. A numerical simulation of the 3AFC paradigm with 30 trials per point showed that this value corresponds to a p < 0.05.
1.3.2 Neurophysiology
Neurophysiological data from the IC and AC was recorded at both sides of the brain in six (three male, three female) and ten (five male, five female) adult P. discolor, respectively.
1.3.2.1 Surgery
For anaesthesia, a mixture of Medetomidin (Domitor®, Novartis, Mississauga, Canada), Midazolam (Dormicum®, Hoffmann-La Roche, Mississauga, Canada) and Fentanyl (Fentanyl-Janssen®, Janssen-Cilag, Neuss, Germany) was injected subcutaneously (MMF, 0.4, 4.0 and 0.04 µg/g body weight). During surgery, skin and muscles covering the upper part of the cranium were cut rostro-caudally along the midline and shifted aside laterally. The cranial bone was completely cleaned of remaining tissue and a metal rod (for fixation of the animal within the experimental apparatus) was fixed onto the bat’s skull using light-curing dental cement (Charisma®, Heraeus Kulzer, Wehrheim Germany). In order to alleviate postoperative pain, an analgesic drug (2 µl/g body weight Meloxicam, Metacam®, Boehringer-Ingelheim, Ingelheim, Germany) was administered orally after full recovery of the bat.
1.3.2.2 Recording procedure
All experiments were conducted in a heated (ca. 36°C), electrically shielded and anechoic chamber. Each recording session lasted typically four hours and was repeated on four days a week for about six weeks. At the beginning of each session, the bat was anaesthetized using MMF (see above). Throughout each experimental session the animal was provided with oxygen.
Acoustic search stimuli were 20 ms pure tones. The stimuli were presented via custom-made ultrasonic earphones (Schuller 1997) with a flat frequency response (±3 dB between 10 and 100 kHz). Once a single neuron or small neuronal cluster (unit) was detected, its best frequency (BF: frequency at which auditory threshold is lowest), was determined audio-visually. In addition, for most units the frequency response area (FRA) was determined in more detail. Pure tone stimuli (20 ms duration, 2 ms rise/fall time), in various frequency and level combinations were presented either binaurally or only contralaterally if inhibition of the ipsilateral ear was too strong. These stimuli were computer generated (Matlab® 6.1, Mathworks, Natick, USA), D/A converted at a sampling rate of 260 kHz (RX6, Tucker Davis Technologies, Gainsville, USA) and attenuated (PA5, Tucker Davis Technologies, Gainsville, USA).
For stimulation of IC-units, all frequency-intensity combinations were presented pseudo-randomly with five repetitions and a repetition period of 150 ms. The recording window started at stimulus onset and lasted for 100 ms. For stimulation of AC-units, all frequency-intensity combinations were presented pseudo-randomly with ten repetitions and a repetition period of 500 ms. The recording window started 10 to 50 ms before stimulus onset and lasted for 450 ms.
Responses from units in the IC and AC were recorded extracellularly using either borosilicate glass electrodes (#1B100F-3, WPI, Sarasota, USA) filled with 2 M NaCl and 4 % pontamine sky blue (3 to 8 M impedance), carbon fibre microelectrodes (Carbostar-1, Kation Scientific, Minneapolis, USA; 0.4 to 0.8 M impedance) or glass insulated tungsten microelectrodes (Alpha Omega GmbH, Ubstadt-Weiher, Germany, 1 to 2 M impedance). Action potentials were amplified using conventional methods, A/D converted (RX5, Tucker Davis Technologies, Gainsville, USA, sampling rate: 25 kHz), recorded and threshold discriminated using Brainware (Tucker Davis Technologies, Gainsville, USA).
1.3.2.3 Data analysis
units were analyzed for the full length of the recording window as the spontaneous rate was generally low. The FRA of a unit was constructed by summing activity for each frequency-level combination within the given analysis window. Responses to different frequency-frequency-level combinations were considered to be significant if the spike rate exceeded 20 % of the maximum response to any frequency-level combination. BF and auditory threshold were directly determined from the FRA of the particular unit.
To calculate the auditory population thresholds for IC and AC, the units’ BFs were classified into frequency bands with logarithmically spaced centre frequencies from 10.3 to 98.3 kHz in 0.3 octave steps, corresponding to the bandwidth used in the psychophysical experiments. For each of the 12 frequency bands, the mean threshold of the three most sensitive units was calculated and taken as the neural threshold to construct the neural audiogram.
1.4
Results
1.4.1 Psychophysics
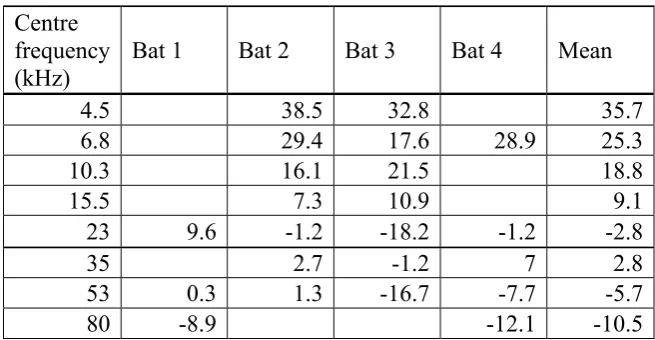
Behavioral data was obtained from four adult male bats. Whereas two bats provided threshold data for seven different centre frequencies, one bat provided data for five centre frequencies and in one bat, auditory thresholds for only three centre frequencies could be determined. Due to the fact that it was not possible to obtain a complete set of data for each bat, mean thresholds for the eight tested centre frequencies were calculated from different numbers of animals. The mean threshold for the centre frequencies 4.5, 10.3, 15.5 and 80 kHz was calculated from the data of two bats, the mean threshold for the centre frequencies 6.8 and 35 kHz was calculated from the data of three bats and for the centre frequencies 23 and 53 kHz data was obtained from each bat and the mean threshold for these centre frequencies was thus calculated from the data of four bats. Thus, on average mean thresholds for the eight different centre frequencies were calculated from the data of three individuals. Mean thresholds of tested centre frequencies are in the range of -10.5 to 35.7 dB SPL.
Fig. 1.2 Behavioral audiogram of P. discolor. The solid line represents the mean threshold values of four bats. Error bars indicate the standard error.
Centre frequency
(kHz) Bat 1 Bat 2 Bat 3 Bat 4 Mean
4.5 38.5 32.8 35.7
6.8 29.4 17.6 28.9 25.3
10.3 16.1 21.5 18.8
15.5 7.3 10.9 9.1
23 9.6 -1.2 -18.2 -1.2 -2.8
35 2.7 -1.2 7 2.8
53 0.3 1.3 -16.7 -7.7 -5.7
80 -8.9 -12.1 -10.5
Table 1.1Behavioral threshold values in dB SPL determined from the psychometric functions of the four bats and mean values, respectively.
1.4.2 Neurophysiology
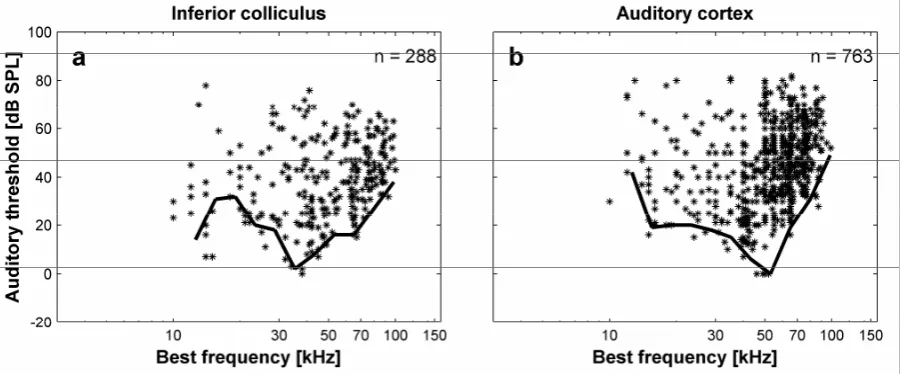
For both the IC and AC units, BFs are in the frequency range of 10 to 100 kHz with most units having BFs above 50 kHz (IC: 60 %, AC: 75 %). Auditory thresholds of units in both IC and AC show a high variability but are in the same range. Units in the IC had thresholds of 0 to 78 dB SPL; units in the AC had thresholds of 0 to 82 dB SPL. Lowest thresholds of 0 dB SPL are reached in collicular units at the BF of 38 kHz and in cortical units at BFs between 46 and 52 kHz.
Minimum thresholds for the neural audiogram could be calculated for 11 frequency bands in both IC and AC. In both cases, the minimum value for the frequency band with the centre frequency of 10.3 could not be calculated because of the small number (<3) of recorded units with BFs in this frequency range (see Methods).
The neural audiogram from the IC is characterized by two regions of maximal sensitivity (Fig. 1.3a). The first threshold minimum (ca. 15 dB SPL) at 15 kHz is separated by a high-threshold region around 20 kHz (ca. 35 dB SPL) from a second high-threshold minimum at 35 kHz (0 dB SPL).
The neural audiogram from the AC is broadly V-shaped with a shallow ascending slope at low frequencies and a steeply ascending slope at high frequencies (Fig. 1.3b). Maximal sensitivity (0 dB SPL) is reached at 55 kHz. Whereas the ascending slope at the low frequency side shows a plateau at 15 kHz before increasing again, the slope at the high frequency side is constantly increasing.
1.5
Discussion
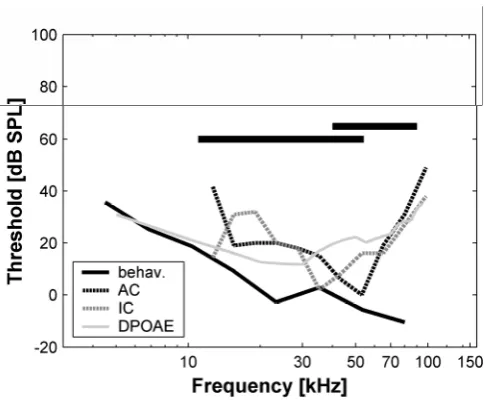
Both the behavioral and neural threshold data presented here indicate that hearing in the echolocating bat, P. discolor is quite sensitive with absolute thresholds down to zero dB SPL and below. A direct comparison of the current behavioral and neural audiograms is shown in Fig. 1.4 together with auditory thresholds estimated by Wittekindt et al. (2005) from measurements of distortion-product otoacoustic emissions (DPOAE).
The neural audiograms obtained from the IC and the AC show a high degree of similarity. In both cases, threshold minima are in the mid frequency range around 35 to 55 kHz where neural thresholds approach 0 dB SPL. As it is shown in Fig. 1.4, frequencies of this range are contained in both echolocation and communication calls of P. discolor. No special sensitivity peak in the frequency range where the echolocation calls are loudest (around 60 kHz) can be found, which is equally pronounced in both the neural audiograms of the IC and AC.
In the IC audiogram, an additional threshold minimum is seen at 15 kHz, which is only weakly reflected in the AC audiogram. This might be due to sampling biases, as the number of neurons recorded from the same frequency regions was not always the same in the IC and AC.
thresholds at higher frequencies compared to the behavioral audiogram (see Fig. 1.4). This study was carried out under the same conditions as the present electrophysiological study (anaesthetized animals, experimental chamber heated to 36°C). In consequence, DPOAE thresholds resemble the current neural audiograms more closely than the behavioral audiogram.
Due to technical limitations, behavioral thresholds for band-pass centre frequencies above 80 kHz were not obtained (sampling rate limited to 196 kHz, see Methods). Thus, it is unclear if the absolute minimum was reached at this frequency or whether the threshold would still further decrease at higher frequencies. However, it can be supposed that the threshold would steeply increase at frequencies above 80 kHz as it has been shown in the pure-tone measurements of Esser and Daucher (1996) and in the behavioral audiograms of other phyllostomid bats (see below).
1.5.1 Comparison with neurophysiological data of other phyllostomid bats
Figure 1.5 shows the neural audiograms of P. discolor and two other phyllostomid bats (C. perspicillata and P. hastatus). The shapes of the IC and AC audiograms of P. discolor are similar to the audiogram obtained from IC neurons of P. hastatus (Grinnell 1970) with slightly lower absolute thresholds in P. discolor. In contrast, the audiograms of
C. perspicillata derived from recordings in the IC (Sterbing et al. 1994) and AC (Esser and Eiermann 1999) are strongly W-shaped. Especially the thresholds in the low frequency range of 15 to 30 kHz are lower in the audiograms of C. perspicillata compared to the neural audiograms of the present study. Furthermore, the AC audiogram of C. perspicillata is characterized by a very pronounced high-threshold region at 52 kHz which is also weakly indicated in the IC audiogram at slightly lower frequencies. In the present study this high-threshold range can neither be seen in the AC audiogram nor in the IC audiogram of
P. discolor. Reasons for this difference might lie in the method of acoustic stimulation during neurophysiological recordings. Esser and Eiermann (1999), as well as Sterbing et al. (1994) used free field stimulation with condenser speakers placed at the contralateral side in the horizontal plane. In contrast, in the present study acoustic stimuli were presented via ear phones to the animal. Thus, influences of the bat’s outer ear were completely excluded. Measurements of the head-related transfer functions of P. discolor (Firzlaff and Schuller 2003) demonstrated elevation dependent spectral notches around 55 kHz which were strongly influenced by the tragus of the outer ear. These spectral notches are mainly used by bats to determine the position of a sound source in elevation (Lawrence and Simmons 1982; Fuzessery 1996; Wotton and Simmons 2000; Chiu and Moss 2007). Thus, the high-threshold regions in the audiograms of C. perspicillata are most probably related to the influence of the outer ear and the tragus, which can not be seen when ear phones are used for acoustical stimulation. This is again supported by the measurements of the DPOAE thresholds in
Fig. 1.5Neural audiograms for three species of Phyllostomidae: cortical units of P. discolor (Pd-AC, solid black line), collicular units of P. discolor (Pd-IC, dotted black line), cortical units of C. perspicillata (Cp-AC, solid grey line, redrawn from Esser & Eiermann 1999), collicular units of C. perspicillata (Cp-IC, dotted grey line, redrawn from Koay et al. 2003) and collicular units of P. hastatus (Ph-IC, dotted light grey line, redrawn from Koay et al. 2002).
1.5.2 Comparison with behavioral audiograms of other phyllostomid bats
movements of the bats in the present behavioral study. Movements during localization of a high test frequency were generally of a higher rate than during the localization of a low test frequency.
Most distinctive in Fig. 1.6 is the large difference of auditory threshold values between the present audiogram of P. discolor and the audiogram determined by Esser and Daucher (1996). The audiograms run roughly parallel but the audiogram of the present study is shifted towards lower sound intensities by 35 to 40 dB. Note, however, that also in the data by Esser and Daucher (1996), the lowest threshold was found at 80 kHz. As already suggested by Koay et al. (2003), the unusually high thresholds in the first experiment of Esser and Daucher (1996) may be mainly due to the difficulties in the discrimination task. For example, the bats in the study of 1996 had to crawl a distance of 1 m to reach the sound source and to get the food reward. In the present experiment, the task was simplified by reducing the distance between starting point and food reward to 30 cm.
A second difference between the previous and the present behavioral audiograms is the lack of the distinct high-threshold range around 50 kHz. This insensitive region is also very prominent in the behavioral audiogram of C. perspicillata (Koay et al. 2003). However, in the present behavioral audiogram of P. discolor, only a very shallow increase in threshold can be seen at 35 kHz. In addition, the behavioral audiograms of A. jamaicensis and P. hastatus
(Koay et al. 2002; Heffner et al. 2003) also show only a weak threshold rise in the mid frequency range. As already discussed before, this high-threshold region might be caused by structural characteristics of the bat’s outer ear. This view is further supported by the studies of Heffner et al. (2003) and Koay et al. (2003) in which the elevation dependency of the high-threshold region in the audiogram was shown. Differences in the spatial arrangement of loudspeaker and starting position of the bat as well as the degree of movability of the bats in the experimental set up most probably contribute to the strength of the high-threshold region in the mid frequency range in the behavioral audiograms of the different phyllostomid bats. Third, in the present behavioral study, we stimulated with narrow-band noise signals instead of the classically used pure tones. On one hand, the narrow-band noise precludes the contamination of the behavioral audiograms by the fine structure of the audiogram, which has been observed in humans (Zwicker and Fastl 1990). This may be also important for the appearance of the spectral notch in the audiogram observed in other phyllostomid bats (see above). Supposedly, this notch is less pronounced with narrow-band stimulation than with pure-tone stimulation. On the other hand, the temporal envelope fluctuations introduced by the narrow-band noise may facilitate the localization of faint stimuli and thus the behavioral performance leading to lower thresholds.
In summary, both the behavioral and neural audiograms show that P. discolor has very good hearing in the low frequency range around 30 kHz, which is important for the detection and analysis of conspecific communication calls. The behavioral data also indicates a second frequency range with very low thresholds, which matches the spectral composition of
low-threshold range is not seen in the neural audiograms may result from the anesthesia, which is known to affect high-frequency hearing more than low-frequency hearing.
Fig. 1.6 Behavioral audiograms for four species of phyllostomid bats: A. jamaicensis (Aj, dotted light grey line, redrawn from Heffner et al. 2003), C. perspicillata (Cp, dotted grey line, redrawn from Koay et al. 2003), P. hastatus (Ph, dotted dark grey line, redrawn from Koay et al. 2002) and P. discolor (Pd(‘07), solid black line, current study, Pd(‘96), dotted black line, redrawn from Esser and Daucher 1996).
1.6
Acknowledgements
The authors wish to thank Susanne Radtke-Schuller for her help with reconstruction of recording sites, Claudia Schulte and Horst König for technical help and Britta Schwellnus for help during neurophysiological experiments.
2.
The auditory cortex of the bat
Phyllostomus
discolor
: localization and organization of basic
response properties
This study was published in 2008 by Susanne Hoffmann, Uwe Firzlaff, Susanne Radtke-Schuller, Britta Schwellnus and Gerd Radtke-Schuller, in BMC Neuroscience (Vol. 9:65).
The neurophysiological experiment was designed and implemented by Uwe Firzlaff. The acquisition of neurophysiological data was done by Uwe Firzlaff, Britta Schwellnus and me. Uwe Firzlaff and I did the analysis of the data. Gerd Schuller provided the equipment for the neurophysiological setup. Susanne Radtke-Schuller performed the histological and neuroanatomical procedures and analyzed this data. The parts of the paper concerning the neuroanatomy were written by Susanne Radtke-Schuller and Gerd Schuller and the parts of the paper concerning the neurophysiology were written by Uwe Firzlaff, Gerd Schuller and me.
2.1 Abstract
2.1.1 Background
The mammalian auditory cortex can be subdivided into various fields characterized by neurophysiological and neuroarchitectural properties and by connections with different nuclei of the thalamus. Besides the primary auditory cortex, echolocating bats have cortical fields for the processing of temporal and spectral features of the echolocation pulses. This paper reports on location, neuroarchitecture and basic functional organization of the auditory cortex of the microchiropteran bat Phyllostomus discolor (family: Phyllostomidae).
2.1.2 Results
The auditory cortices of ten adult P. discolor were electrophysiologically mapped in detail. Responses of 849 units (single neurons and neuronal clusters up to three neurons) to pure tone stimulation were recorded extracellularly. Cortical units were characterized and classified depending on their response properties such as best frequency, auditory threshold, first spike latency, response duration, width and shape of the frequency response area and binaural interactions.
Based on neurophysiological and neuroanatomical criteria, the auditory cortex of P. discolor
could be subdivided into anterior and posterior ventral fields and anterior and posterior dorsal fields. The representation of response properties within the different auditory cortical fields was analyzed in detail. The two ventral fields were distinguished by their tonotopic organization with opposing frequency gradients. The dorsal cortical fields were not tonotopically organized but contained neurons that were responsive to high frequencies only.
2.1.3 Conclusions
The auditory cortex of P. discolor resembles the auditory cortex of other phyllostomid bats in size and basic functional organization. The tonotopically organized posterior ventral field might represent the primary auditory cortex and the tonotopically organized anterior ventral field seems to be similar to the anterior auditory field of other mammals. As most energy of the echolocation pulse of P. discolor is contained in the high-frequency range, the non-tonotopically organized high-frequency dorsal region seems to be particularly important for echolocation.
2.2 Background
During the last decade, the bat P. discolor has been used increasingly for psychophysical and neurophysiological studies of echolocation (Esser and Lud 1997; Grunwald et al. 2004; Fenzl and Schuller 2005; Firzlaff and Schuller 2007). P. discolor is medium-sized and forages for fruit, nectar, pollen and insects in a neotropical forest habitat. Its vocal emissions are brief (< three milliseconds), broadband multi-harmonic, downward frequency modulated (FM) echolocation pulses with a frequency range of about 40 to 90 kHz. In contrast, the rich repertoire of communication calls used for species-specific social interaction covers the lower frequency range from 11 to 54 kHz (Esser and Schmidt 1990; Hackel and Esser 1998). The responses of cortical neurons to complex stimuli relevant for echolocation in P. discolor have been compared to the behavioral performance of the bat (Firzlaff et al. 2006; Firzlaff et al. 2007). Therefore, it is important to gain knowledge of the detailed organization of the AC with respect to basic response properties.
organization of the AC in bats has been extensively studied physiologically in several species (e.g. Pteronotus parnellii (O'Neill and Suga 1982; Fitzpatrick et al. 1998b), Rhinolophus spec.
(Ostwald 1984; Radtke-Schuller and Schuller 1995), Eptesicus fuscus(Dear et al. 1993; Jen et al. 2003), for review see (O'Neill 1995)). Among the best studied ACs so far are those of the mustached bat P. parnellii and the horseshoe bat, Rhinolophus rouxi, both belonging to the group of the so-called CF/FM-bats whose echolocation pulses consist of a constant frequency (CF) and a frequency modulated (FM) component. As common to all mammals studied so far, their ACs contain a tonotopically organized primary auditory field (AI) with the frequency gradient running from caudal to rostral. However, in both CF/FM-bats frequencies of the CF component of the calls are largely overrepresented in AI while frequencies of the FM component are only weakly represented (Suga and Jen 1976). The AI is surrounded by cortical regions with neurons that show facilitated responses to specific spectral and temporal combinations of the CF and FM parts of the different harmonics of the echolocation pulses. CF/FM-bats are rather specialized echolocators in that they hunt almost exclusively insects on the wings, whereas other bat species display more varied feeding ecology (insects, vertebrates, nectar, and fruits) and very commonly use short downward FM echolocation pulses often with several harmonic components. In these bats the functional specialization of the AC is often not so clearly apparent, but still cortical fields can be segregated based on neurophysiological criteria like best frequency (BF; frequency at which threshold is lowest) representation and response threshold (Wong and Shannon 1988; Dear et al. 1993). In the phyllostomid FM-bat Carollia perspicillata for example, two dorsal fields containing mainly neurons with BFs in the high-frequency range have been reported in addition to the tonotopically organized fields AI and anterior auditory field (AAF) (Esser and Eiermann 1999). In these high-frequency fields some neurons exhibited pulse-echo delay sensitivity as in CF/FM-bats (Hackel and Esser 1998), but without topographical organization.
Except for a short autoradiographic labeling study (Esser 1995) the topography of the AC of
P. discolor has not been studied. In general, the AC of only one other phyllostomid FM-bat,
C. perspicillata, has been investigated, so far (Esser and Eiermann 1999). Therefore, the aim of the present study was to investigate neuroanatomical and neurophysiological properties of the AC of P. discolor in order to delineate its subdivisions.
2.3 Results
2.3.1 Auditory responses in the cortex of Phyllostomus discolor
in the lateral view as shown in Fig. 2.1A. To obtain a realistic estimate of the cortical surface containing auditory units, the locations of the recorded units were projected on an unrolled and flattened surface projection along the medio-lateral coordinate (Fig. 2.1B, see Methods). In this projection, the lateral extension of the auditory responsive area is roughly 7000 µm.
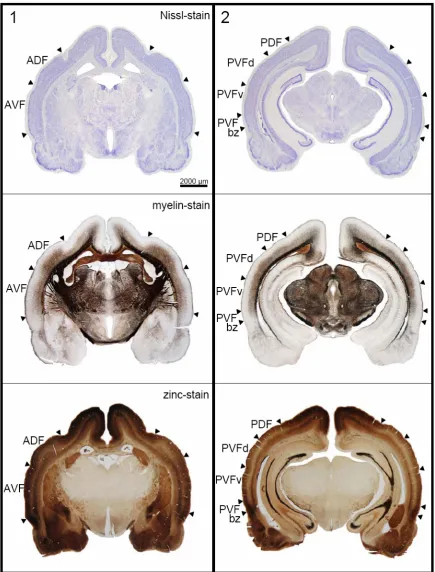
Fig. 2.1 Recording sites and subfields in the auditory cortex of Phyllostomus discolor.
A) Lateral view of the P. discolor brain. Recording sites of all 849 units are indicated as black dots. Superimposed black outlines are neuroanatomically determined borders. Solid black lines represent reliable borders, whereas stippled black lines represent more variable borders. Rostro-caudal positions of frontal sections shown in Fig. 2.2 are indicated by the white vertical lines. Colored lines represent equal medio-lateral distances from the midline in 1000 μm steps as shown in the flattened cortical surface projection in Fig. 2.1B.
(upper dark blue line). C) Schematic of the auditory cortical subfields: anterior dorsal field (ADF), posterior dorsal field (PDF), anterior ventral field (AVF) and posterior ventral field (PVF) with dorsal (PVFd), ventral (PVFv) parts and a border zone (bz) reconstructed on the flattened cortical surface. The neuroanatomically determined borders are indicated by black lines.
2.3.2 Neuroanatomy
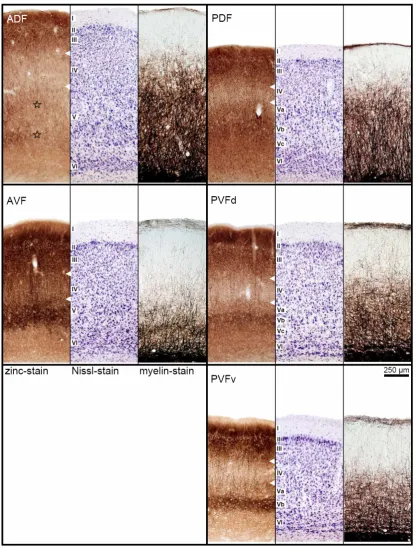
In the area responsive to acoustic stimuli four major fields are recognized based on cyto- and myeloarchitectural features and zinc staining pattern, i.e. the anterior and posterior dorsal fields (ADF and PDF), an anterior ventral field (AVF) and a posterior ventral field (PVF). The PVF maybe further subdivided into a dorsal and a ventral part (PVFd and PVFv) and a border zone (PVFbz), due to minor modifications of the neuroarchitectural characteristics. The topographic position of these fields is depicted in Fig. 2.1C. Reliable borders of cortical fields are indicated by solid lines. Dashed lines represent the more variable outlines of the AC itself and for PVF possible anatomical subdivisions that are not corroborated by neurophysiological data of the study.
Frontal sections in Fig. 2.2 give showcase characteristics at two rostro-caudal levels (as indicated in Fig. 2.1A) to get a general idea of field differences. Total cortical thickness, relative thickness of the different layers, composition of cell types, cell density, content of myelinated fibers and zinc are considered as parameters for the distinction of the different fields. Cut-outs of frontal sections stained for cells (Nissl), myelinated fibers (Gallyas) and for zinc (sulphide/silver histochemical method) from the centers of the different cortical fields are mounted in Fig. 2.3 for detailed comparison.
Total cortical thickness varies between 1600 µm (ADF) and 1200 µm from dorso-rostral to ventro-caudal locations (PVFv) in the AC. Despite the high density of granular elements in layer III and IV of the dorsal fields, the cortical layers V and VI take more of the total thickness of the cortex. Therefore, they are addressed as parietal cortical fields. The ventral fields are thought to belong to the temporal cortex, as layers III and IV dominate layers V and VI in thickness although granular elements are sparse and the cell density is lower in layers III/IV compared to the dorsal fields.
Dorsal and ventral fields also differ with respect to layer I, which is generally thinner in the dorsal than in the ventral fields. The myelinated horizontal fibers in the superficial part of layer I form a narrow dense band in the dorsal fields, but a broader one in the ventral fields, which is paralleled by a nearly zinc-free stripe in the ventral fields.
of ADF (see frontal section stained for zinc in Fig. 2.2, left column, bottom, and Fig. 2.3, upper left panel, stars marking the two components of layer V).
In AVF, the rostral beginning coincides with the most caudal part of the claustrocortex without a sharp border. The myelin content in AVF is comparably low, whereas the stain for zinc is generally intense (as is the stain in the rostrally adjacent claustrocortex and the ventrally bordering perirhinal cortex). Even the paler staining band corresponding to layer IV is relatively dark.
The posterior fields are more homogeneous. Cortical width in PDF is smaller than in ADF and characteristic differences to the neighboring PVF are obvious at higher magnification (see Fig. 2.3). In the zinc stain, layer IV is narrower and more heavily stained in PDF than in PVF, whereas layer V is thicker and of higher staining intensity.
PVF has the most conspicuous wide and pale zinc staining band in layer IV, encompassing deep layer III. Layer V shows three subdivisions in the dorsal part (PVFd), whereas in the ventral part (PVFv) only two subdivisions are recognizable. Layer Vb, the most intense staining part of layer V is strikingly darker in PVFv. In PVFbz a gradual change of the characteristic features from PVF toward the ventrally adjacent perirhinal cortex takes place, e.g. the layered organization fades as well in the cell stain as in the zinc stain, and so do the myelinated fibers.
Layer IV appears as a pale band with the lowest staining intensity in the zinc stain and the staining intensity of layer IV varies characteristically between the fields. It is faint in layer IV of PDF, comparably lighter in ADF, relatively dark in AVF and faintest in PVF.
2.3.3 Basic neuronal response properties
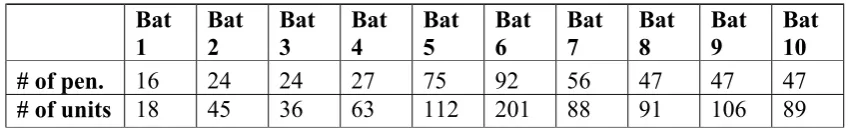
Because it was not always possible to discriminate the activity of a single neuron, the term ‘unit’ will be used in the following to describe the activity of one neuron to clusters of three neurons recorded at a distinct recording site. Extracellular recordings were derived from a total of 849 units from both hemispheres of ten bats. The number of units recorded in one bat ranged from 18 (16 penetrations) to 201 (92 penetrations) with an average of 85 units (46 penetrations) per bat (Table 2.1). Thus, on average two units were recorded per penetration. Recording depths of units derived from roughly orthogonal electrode penetrations (bat #6 and #7) were in the range of 320 to 1700 µm from the cortical surface (n = 183; mean: 962 ±278 µm).
Bat 1 Bat 2 Bat 3 Bat 4 Bat 5 Bat 6 Bat 7 Bat 8 Bat 9 Bat 10
# of pen. 16 24 24 27 75 92 56 47 47 47
# of units 18 45 36 63 112 201 88 91 106 89
Table 2.1 Number of electrode penetrations and recorded units per bat. The first row shows the number of electrode penetrations in the AC of each bat, the total number of recorded units in each of the ten experimental animals is shown in the second row.
Best frequency and threshold: As shown in Fig. 2.4A, BFs of units ranged from five to 107 kHz (n = 849; median: 60 kHz; interquartile range: 44 to 67 kHz). Seventy nine percent (674 of 849) of the units had BFs above 40 kHz, i.e. in the range of the dominant harmonics of the echolocation pulse of P. discolor.
The response threshold at BF was determined in 764 units and varied between zero and 82 dB SPL. The frequency distribution of thresholds reaches its maximum around 45 dB SPL with roughly symmetric flanks to lower and higher thresholds (mean: 45 ±16 dB SPL Fig. 2.4B).
Latency and response duration: The first spike latency was measured in 681 cortical units and ranged between five and 127 ms with a bias toward short latencies (Fig. 2.4D). Median latency of all units was 9 ms (interquartile range: 7 to 20 ms).
response durations between 20 and 100 ms (Fig. 2.4F) were found in 44 % (322 of 730) of units and 16 % (116 of 730) of units had response durations longer than 100 ms (Fig. 2.4I). Thus, in 60 % of units the response duration exceeded the duration of the pure tone stimulus (20 ms).
Frequency response areas: Q10dB values covered a range between 0.5 and 76 (n = 590; median: 5.4; interquartile range: 3.9 to 7.5). The distribution showed a peak around five (Fig. 2.4G), indicating that sharp frequency tuning is rare in cortical units of P. discolor. The regression line in Fig. 2.4H shows that Q10dB values roughly increased with increasing BFs. Q30dB values covered the range between 0.3 and 66 (n = 414; median: 3.1; interquartile range: 2.2 to 4.4). The difference between the medians of the Q10dB and Q30dB values suggests that in many units the sharpness of frequency tuning was only slightly decreasing with increasing stimulus level.
Fig. 2.4 Distribution of response properties of cortical units and examples of PSTHs for different response types. The frequency distribution of neuronal response properties evoked by pure tone stimulation is shown for: A) Best frequency, B) Response threshold, D) First spike latency, E) Response duration and G) Q10dB values. Peri-stimulus time histograms
(PSTHs) show examples of cortical units with different response types: C) phasic response,
F) phasic response with a sustained component and I) tonic response. The binwidth of the histograms is 1 ms. The grey bar represents the acoustic stimulus (20 ms pure tone). Panel H)
In 745 units, the FRAs could be classified into six different types (Fig. 2.5). Most units (65 %, 489 of 745) showed a V-shaped FRA with equal share of monotonically (Fig. 2.5A) and non-monotonically (Fig. 2.5B) responses. Sixteen percent (120 of 745) of cortical units showed double- or multi-tuned FRAs two thirds (80 of 120) of which displayed monotonic (Fig. 2.5C) and one third (40 of 120) non-monotonic response behavior (Fig. 2.5D). In 48 % (58 of 120) of multiple tuned units, threshold minima were roughly harmonically related. In six percent (43 of 745) of units, the FRAs constituted closed areas in the frequency-intensity field with spike rates dropping to zero at all frequencies with increasing stimulus level (Fig. 2.5E). The remaining units (13 %, 93 of 745) featured complex-shaped FRAs (Fig. 2.5F).
Fig. 2.5 Examples of the six different FRA types of cortical units. Examples of the different classes of FRA types are shown for A) monotonically V-shaped, B) non-monotonically V-shaped, C) monotonically double tuned, D) non-monotonically double tuned,
Binaural response properties: In 394 units the binaural response properties were measured and units were classified following their contra versus ipsilateral response characteristics (see Methods). EE responses were measured in 39 % (154 of 394) of units, 32 % (126 of 394) of units were inhibited by the ipsilateral ear (EI) and 25 % (100 of 394) of units showed no reaction to ipsilateral stimulation (E0). Four percent (14 of 394) of units could not be classified in one of the above classes and were thus named as “other”.
2.3.4 Representation of neuronal response properties in cortical fields
The local representation of selected response properties on the cortical surface was visualized using the Voronoi tessellation method (see Methods). The tessellation field around the recording site has its limits at halfway distance to the next surrounding recording sites and its color displays the respective response strength of the unit at the center. This forcibly entails large tessellation fields in areas in which recording density is lower or in border regions. As a consequence, there is no proper meaning in the area of single tessellation fields, but rather the clustering or systematic trends of tessellation fields within the AC are important information. Response properties of cortical units were analyzed for the four major subfields. Possible anatomical subdivisions of PVF were not corroborated by the neurophysiological data, and thus, PVF was analyzed as a whole.
Representation of best frequency and Q10dB: The organization of BFs within the AC of
P. discolor is shown in Fig. 2.6A. Units in the dorsal fields had a relatively restricted range of mainly high BFs, which covered frequencies in the range of the dominant harmonics of the echolocation pulse of this species. Most units in the ADF had BFs above 45 kHz, whereas units in the PDF had mainly BFs above 60 kHz. Only at the most rostral positions of the ADF units with low BFs were found. No tonotopic arrangement of BFs was found in the dorsal fields. In contrast, fields in the ventral part of the AC showed a tonotopic organization of BFs. The frequency gradient in AVF developed along the rostro-lateral to caudo-medial axis with low BFs at rostro-lateral positions, whereas in PVF the BFs decreased from rostral to caudal cortical positions. Thus, PVF and AVF shared a common high-frequency border. The rough direction of BF gradients in the ventral fields is schematically shown in Fig. 2.6B. As shown in Fig. 2.6D, the median BF (65 kHz) in PDF was significantly higher than the median BFs of the other cortical fields (Kruskal-Wallis test, p < 0.05). The lowest median BF (50 kHz) was found in PVF.
Q10dB values of units were also not uniformly distributed on the cortical surface but showed a tendency to increase from anterior to posterior locations (Fig. 2.6C). In both anterior fields, units showed broader frequency tuning with significantly lower Q10dB values (Kruskal-Wallis test, p < 0.05) than found in units in the posterior fields (Fig. 2.6E).