Application of the electrodiffusion method for near-wall flow diagnostics
J. Tihon1,a
1
Institute of Chemical Process Fundamentals, ASCR, Rozvojová 135, 16502 Prague, Czech Republic
Abstract. The electrodiffusion method is presented as a measuring technique suitable for the flow measurement done in close proximity of the wall, thus in the region difficultly accessible by standard anemometric techniques (e.g. PIV, LDA). The experimental results obtained in different flow configurations (backward-facing step flow, wavy film flow, turbulent channel flow, rising Taylor bubbles) document application capabilities of this technique, e.g. for mapping of wall shear stresses, delimitation of stable flow-recirculation zones, detection of short-time reversal of the near-wall flow, investigation of the near-wall turbulence, or detection of moving fluid particles. A new technology of sensor fabrication based on photolithography is introduced and possible applications of microsensors in microfluidic devices discussed.
1 Introduction
The rapid progress in fabrication and utilization of microstructured systems in the last decade has not been matched by the corresponding progress of experimental techniques suitable for the examination of flows at small scales. The optical methods (such as PPIV) suffer from the difficulties with the choice of a tracer, whose particles should be much smaller than the channel size (in order of tens of Pm), but on the other hand, larger than the light wavelength (0.5 Pm limit). Moreover, the small particles are subjected to Brownian motion, which introduces considerable noise into experimental results.
The electrodiffusion technique [1,2], which has been until now used only for the near-wall flow diagnostics on larger scales, can be promising for both, scientific experiments and microdevices in service diagnostics. The electrodiffusion microsensors prepared by the photo-lithography have been already applied to investigate the structure of near-wall turbulence in channel flows [3] and their applications in microfluidic devices have been just considered [4-6].
Nowadays, it is possible to produce microfluidic devices with precisely shaped microelectrodes prepared by using different microfabrication techniques. It offers a possibility to use such microelectrodes as electrodiffusion sensors for near-wall flow investigations in various microfluidic systems (e.g. in complex channel geometries often used as micromixers [7], or possibly in multiphase microfluidic systems dealing with bubbles and drops hydrodynamic behavior [8,9]).
In this paper first the application capabilities of electro-diffusion technique (mapping of wall shear stresses, delimitation of stable flow-recirculation zones,
detection of short-time reversal of the near-wall flow, investigation of the near-wall turbulence, or detection of moving fluid particles) are documented by the results of our previous experimental investigations done with classical sensors. Then a new technology of sensor fabrication [10] is introduced and the results of first test measurements carried out with such photolithography-made sensors in microchannel flows are presented.
2 Electrodiffusion technique
2.1 Principle of the method
The electrodiffusion technique using sensors flush mounted into a wall is often used to measure local values of the wall shear stress or to obtain information on the flow structure in the near-wall region. The sensor active surface works as a small electrode, on which a fast electrochemical reaction takes place, when a small polarization voltage is applied to it. The electric current passing through the electrode is the measured quantity. The current signal I provided by a simple strip probe is controlled by convective diffusion and depending on the wall shear rate J according to the well-known Léveque formula
3 / 1 3 / 2 3 / 2 0
807 .
0 nFc wl D J
I ,
(1)
where n is the number of electrons involved in the electrochemical reaction, F is the Faraday constant, l is the length of the strip sensor in the mean flow direction, w is its width, c0 is the bulk concentration of the active
ions, and D is their diffusivity in the solution. The main advantage of this technique is that the wall probes
C
Owned by the authors, published by EDP Sciences, 2014
provide information about the flow in the near wall region without any disturbances imposed on the studied velocity field.
If flow reversal occurs in the near-wall flow region and additional information on the flow direction is needed, a two-segment probe [11,12] is usually applied. The instantaneous flow direction is determined by simple comparison of current signals obtained from the upstream (I1) and downstream (I2) probe segment. The rear
segment (in respect to the actual flow direction) is located in a concentration shade of the front one and thus is giving the lower signal. Therefore, a possible near-wall flow reversal is detected from a sudden change of I1/I2(t)
current ratio signal (from I1(t) > I2(t) to I2(t) > I1(t)). This
criterion can be easily used to localize the stagnation points between steady recirculation-flow regions (e.g. in laminar backward-facing step flows [13]). Thorough discussion on the application of two-segment probes (especially analysis of their dynamic behavior) can be found in [12].
The three-segment probe [14, 15] is able to evaluate not only the velocity but also the exact direction of near-wall flow. This circular probe (see Figure 2) is made from three platinum wires deformed by pulling together through a goldsmith-wiredrawing die. If the three-segment probe has identical three-segments, its total current I depends only on the absolute value of the wall shear rate vector J and not on the probe configuration with respect to the flow direction. However, the probe configuration determines how the total current is divided between the individual current contributions Is. Consequently, the
ratio Is/Iis only a function of the flow direction angle)
and can be expressed as a series
>
@
¦
) )M
m sm sm
s
s I A A m B m
I
1
0 cos sin , (2)
the so-called directional characteristics of the probe. As real probes have not geometrically identical segments, the calibration coefficients Asm and Bsm have to be determined
experimentally (see Figure 1).
Figure 1.Directional characteristics of the three-segment probes [15].
2.2 Sensor fabrication
2.2.1 Classical versatile probes
Classical versatile probes are fabricated from platinum or nickel foils or wires. These wires are insulated with a deposit of a polymeric paint and, after soldering leads, glued together with an epoxy resin into a stainless steel
tube acting as an auxiliary electrode. The front photograph of such a three-segment probe is presented in Figure 2, where the whole active surface of the probe (0.5 mm in diameter) composed of three individual segments can be seen. These probe segments are separated by insulating gaps about 10 Pm in their thicknesses. The stainless tube with active sensors (single, two-strip, or three-segment) is then flush-mounted into the wall of an experimental set-up.
Figure 2. The three-segment probe (magnified front view).
2.2.2 Sensor fabrication based on photolithography
The deposition of planar microelectrodes on the microchip substrate is usually done in the form of thin metal films (gold, platinum, titan, nickel). The metallization is carried out by using galvanization, sputtering or vapor deposition techniques. The electrode pattern is transferred, via a photolithographic mask, into a thin film of photoresist material deposited on the substrate. A sequence of fabrication steps, including photoresist removal, electrodeposition, casting and etching, then complete the process of microelectrode fabrication.
An array of gold microelectrodes on a silicon wafer prepared for a near-wall turbulence study [3] is shown in Figure 3. There are two masks levels applied: the first one corresponds to the overall design including both the active areas and the paths for the current to the measuring device. The second one is aimed at coating this latter part and avoiding it to be in contact with the solution. The thickness of deposited layers (active gold and protective silicon nitride) is only 0.3 Pm. Therefore, the surface of microchip can be considered as relatively smooth.
Figure 3. Double semi-circular microsensors prepared by the photolithography [3].
A novel technique for fabrication of plastic microfluidic systems with integrated metal micro-electrodes (called technique of sacrificed substrate) has been developed in the Laboratory of Microtechnology at the Institute of Chemical Technology in Prague [10]. This fabrication technique includes: (i) optical photolitho-graphy in the photoresist previously coated on a metal 0.2
0.3 0.4 0.5
0 60 120 180 240 300 360
) [o]
I
s
/I
s=1 s=2 s=3 FIT
substrate, (ii) electroplating of gold sensors, (iii) photoresist stripping, (iv) embedding of the gold sensors in the UV curable resin Acrifix 192®, (v) UV curing of the resin, and (vi) removal of the metal substrate by etching. Relatively high thickness (several micrometers) of the gold sensor built-in in PMMA resin provides both, a good mechanical resistance and surface smoothness. The microsensors fabricated by this technique are recently tested in our laboratory in microchannel flow experiments.
2.3 Calibration procedure
The Léveque formula (Eq.1) relates the instantaneous values of wall shear rate and limiting diffusion current only if measured flow fluctuations are slow enough (quasi-steady). For proper use of sensors under unsteady flow conditions, it is necessary to consider their dynamic response. The approximate model [16] suggested for description of the probe dynamic behaviour is represented by a simple formula
¸ ¹ · ¨ © § dt dI k I ks3 3 t2
2
J
.(3)
This semi-empirical differential equation contains two constants, easily accessible from the steady flow calibrations. The first constant ks corresponds to the
steady state solution
3 / 1
J
s k I . (4)and the second one kt can be determined from the known
solution of the unsteady diffusion at the beginning of the transient process after the probe polarisation switch-on
2 / 1 t k
I t . (5)
If the exact shape of a probe and the diffusivity of ions involved in the electrode reaction are known, both the constants can also be calculated from the theoretical relationships. For a single strip probe
3 / 2 3 / 2 0 807 .
0 zFcwl D
ks (6)
and
S /
0wl D
zFc
kt . (7)
To estimate the single probe inertia at given flow conditions characterised by the mean value of J, the characteristic time parameter t0 can be introduced as
2/3 -2 2
0=(kt/I) =(kt/ks)
J
t .
(8)
This parameter is determined as the time coordinate of the intersection of both the asymptotes (Eq.4 and Eq.5) of the transient current response after the probe polarisation switch-on. The dependence of this characteristic time on the actual flow conditions represented by the mean value of wall shear rate is an important consequence of nonlinear dynamic behaviour of the electrodiffusion probes.
3
Near-wall flow diagnostics
3.1 Application of classical sensors
3.1.1 Detection of near-wall flow reversal
Classical versatile probes with two-strip sensors can be applied to detect the existence of near-wall flow reversal. Two examples of this type of measurements are shown in Figure 4 and Figure 5, where wall shear rate signals demonstrate an unsteady oscillating character of near-wall flow close the reattachment point in the channel behind a backward-facing step [13] and a short-time flow reversal observed in front of a large solitary wave traveling on the surface of a falling liquid film [12].
Figure 4. Primary current signals (a) and corresponding wall shear rate in a backward-facing step flow (b).
Figure 5. Time courses of the film thickness and the wall shear rate typical for the solitary wave regime.
3.1.2 Identification of capillary waves
As also seen in Figure 5,the electrodiffusion technique is able to capture also small and relatively rapid flow structures as e.g. capillary waves on liquid films. It is also the case of capillary waves appearing at certain flow conditions on a thin liquid film squeezed under a large (Taylor) bubble rising in a tube or channel. In our experiments [17] such capillary waves have been distinctly observed for a vertical bubble rise in a flat channel (with a gap of H=8 mm). When surface tension effects are decreased (as in the case of Figure 6a), surface waves starts to develop first along the bubble rear part. The capillary wave length and terminal bubble velocity
-1 -0.5 0 0.5 1 1.5 2 2.5
0 0.1 0.2 0.3 0.4 0.5
t / s
Nor m alis ed s ignals FILM THICKNESS
WALL SHEAR RATE
SOLITARY WAVE CAPILLARY WAVES FLOW REVERSAL 0 5 10
0 20 40 60
I1 , I2 ( P A)
t (s)
I1 I2
(a)
-20 0 20
0 20 40 60
JJ
(s
-1)
t (s)
determined from the video recording are Ow = 1.5 mm and UB= 0.252 m/s, respectively. Therefore, the
frequency of observed waves related to a fixed wall location is fw =168 Hz. This frequency is indeed detected
by the electrodiffusion probe and extracted from the wall shear rate oscillations corresponding to the capillary wave region (see a magnified pane in Figure 6b).
Figure 6. Capillary waves at the rear part of a rising bubble : (a) picture of bubble at the sensor, (b) wall shear rate profile.
3.1.3 Detection of moving fluid/solid particles
The ellectrodiffusion probe is also a suitable tool for detection of bubbles, drops or particles moving along the channel wall. Although the near-wall flow response to rising bubbles is dependent on the bubble size and other operation parameters, it exhibits some typical features (see Figure 7). The wall shear rate profile with the peak at the position of bubble nose, negative values in the liquid film under the bubble, and positive values for an unsteady flow in the bubble wake is observed for a flat bubble rise in a narrow flow channel. The thin lines in the figure designate the time instants of the arrival of bubble nose at the sensor and the departure of bubble back from it.
Figure 7. The wall shear rate response to a large bubble rising in a vertical flow channel.
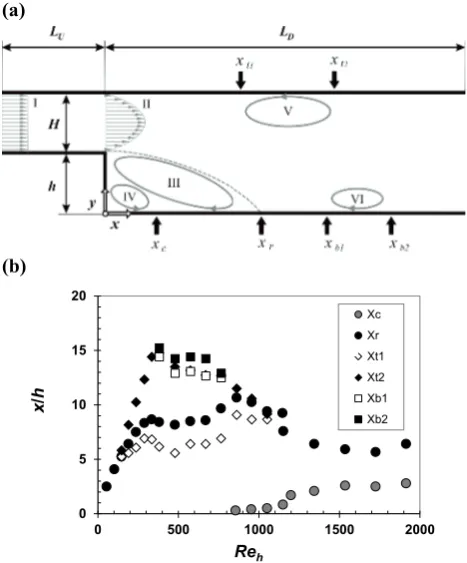
3.1.4 Delimitation of near-wall flow regions
The two-strip probe can be also applied to delimitate distinct near-wall flow regions. For example wall shear rate profiles measured at different flow rates in the channel with a backward-facing step provide the information on individual flow-recirculation regions. Figure 8 summarizes the results of such near-wall flow mapping for the channel with an expansion ratio of
ER=2.5. The reattachment length xr first increases
regularly with the Reynolds number, culminates at moderate Reh when also a small corner eddy xc becomes
experimentally detectable, and then decreases irregularly as the flow in the transitional regime becomes unsteady. Another two secondary flow-recirculation regions (at roof between xt1 and xt2, and at bottom between xb1 and xb2)
appear only temporally at specific flow conditions. (a)
(b)
Figure 8. Backward-facing step flow: (a) schema of principal flow regions with the mean recirculation region (III), corner eddy (IV), roof eddy (V), and secondary flow-recirculation at the bottom wall (VI), (b) near-wall flow mapping for the channel configuration with ER=H+h/H=2.5.
3.2 Application of microsensors
3.2.1 Near-wall flow turbulence
The principal advantage of photolithography as microsensor fabrication technique is its capability to produce multi-segment sensors located close each other and arranged into patterned arrays. This is important especially in the preparation of sensors for the investigation of near-wall turbulence structures. This is reason why the probably first electrodiffusion experiment done with photolithography-made sensors has been focused on the drag reduction phenomenon [3]. An array of gold double semi-circular microsensors shown in Figure 3 elucidates the effect of addition of high molecular polymers on the character of turbulent vortices located in the near-wall region. The main results obtained are presented in Figure 9 and Figure 10. They document how the presence of additives reduces near-wall flow fluctuations and correspondently modifies measured -200
200 600 1000 1400
0 0.5 1 1.5 2
JJ
(1/s)
t(s)
BUBBLE WAKE LIQUID
FILM -4000 -3000 -2000 -1000 0 1000 2000
0 1 2 3
JJ
(1/s)
t(s)
-4000 -3000 -2000
0.82 0.86 0.9
0 5 10 15 20
0 500 1000 1500 2000
x
/
h
Reh
power spectra Wss, (from spectral analysis of measured
signals) and also how enlarges the size of pairs of contra-rotating near-wall vortices (so-called streak spacing O+, from cross-correlation analysis of measured signals).
Figure 9. Effect of drag reduction on the power spectral density Wss of the wall shear rate fluctuations in the mean
flow direction (solid lines) and in the transverse direction (dashed lines).
Figure 10. Effect of drag reduction on the dimensionless streak spacing (O+
=
Ou*/Q.3.2.2 Microchannel flows
A test chip designed to test electrodiffusion sensors fabricated by the method of a sacrificed substrate consists of an array of gold strips embedded into a Plexiglas plate (see Figure 11). Twenty working cathodes (160 Pm strips) separated by 40 Pm insulating gaps are located between two large anodes (10 mm strips). The plate with microelectrodes serves as a top cover (roof wall) of a flat calibration microchannel. It has a rectangular cross-section (with 800 Pm height and 10 mm width) and a length of 100 mm. The active surface of sensors is delimited by a sealing placed between the microchannel and test plate so that it forms side walls of the microchannel. The design of the test plate enables us to use gold strips as individual or double (two-strip) sensors,
thus to investigate also the microchannel flows with possible separations and reattachments. Water with a small addition equimolar potassium ferro/ferricyanide is used as a suitable electrochemical system and potassium sulfate as a supporting electrolyte. A gear pump Heidolph supplies the electrolyte into the microchannel (QL.from
50 to 500 ml/min).
Figure 11. Array of strip gold microsensors embedded into a Plexiglas plate. (20 small working cathodes located between 2 large anodes).
The preliminary experiments have been carried out first to find out the sensor activation procedure, to determine the optimum concentration of electrolyte, and to test the sensor durability. After fabrication procedure the sensor surface is passivated and should be first activated. It is done by polishing with a fine paste and then performing several polarization cycles (between U± 1.2 V). As ohmic resistance is increased in microchannels (due to a thin layer of electrolyte), the concentration of active ions should be very low (0.002 M potassium ferro/ferricyanide) and that of supporting electrolyte quite high (4% wt. K2SO4). The prepared sensors exhibit good adhesion and mechanical resistance.
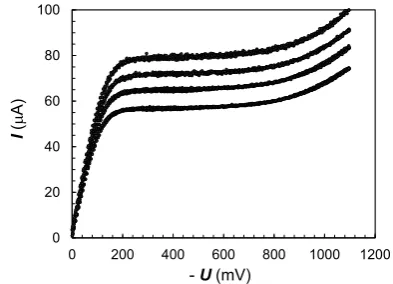
Proper functioning of prepared electrodiffusion sensors has been then tested by polarization curve measurements (see Figure 12). As currents measured at moderate polarization voltages (around U~-0.5V) are limited by diffusion of the active ions towards the sensor surface, the observed polarization curves are characterized by distinct plateaus. The current level at plateaus is sensitive to the actual flow rate in the microchannel (i.e. to the wall shear rate magnitude). The polarization voltage of -0.6 V has been chosen for following calibration experiments.
Figure 12. Limiting diffusion currents measured at different flow rates in the channel (for QL=205, 300, 393,
and 482 ml/min, sensor E1).
1E+0 1E+1 1E+2 1E+3 1E+4 1E+5
1 10 100 1000
f [Hz]
W
ss
[s
-1 ]
water Re=18500
PEO Re=17250 DR=72%
0 100 200 300 400
0 20 40 60 80
DR [%]
O
PAA 20ppm
PAA 50ppm
PEO 50ppm
PEO 100ppm
O+=100 + 1.9 DR
water : O+~100
0 20 40 60 80 100
0 200 400 600 800 1000 1200
I
(
P
A)
Practically same polarization curves have been obtained for all tested sensors. The currents from sensors for the same flow rates have been differentiated less than 0.5%. The results of sensor calibration carried out under steady laminar flow conditions are shown in Figure 13. The measured current values follow very well a cubic root dependence on the wall shear rate prescribed by Eq.4. The calibration constant ks=3.52 PA.s1/3 determined
from data fit (see dash line) can be utilize to calculate the diffusion coefficient of ferricyanide ions. Eq.6 provides for the known values of sensor dimensions (l=0.16 mm, w=10 mm) and electrolyte concentration (c0= 0.002 M)
an estimate of D = 6.7 10-10 m2/s. This value (measured at temperature of T = 22 oC) is in a good agreement with previous experimental findings [18].
Figure 13. Sensor calibration at the steady flow conditions (sensor E1, dash line stands for data fit: I=3.52 J1/3).
The transient current response to set-up of polarization voltage measured for the sensor in stagnant electrolyte is presented in Figure 14. The measured data corresponding to an unsteady diffusion at the beginning of transient process are well fitted by the Cottrell asymptote (Eq.5). The dynamic calibration constant kt=4.7 PA.s
1/2
can be inserted into Eq.7 to obtain the diffusion coefficient corresponding to unsteady calibration: D = 7.3 10-10 m2/s. This value agrees well with that obtained from the steady calibration, thus verifying the proper working of sensors.
Figure 14. Transient current response to set-up of polarization voltage measured in stagnant electrolyte (dash line stands for low current data fit: I=4.7 t-1/2).
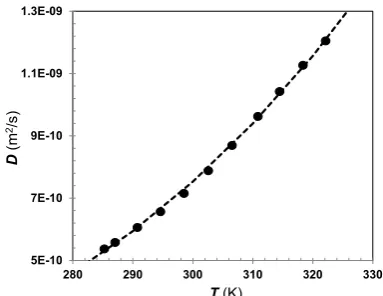
Finally, the sensitivity of measurement results to the changing temperature is tested. The electrolyte reservoir is placed into a thermostat and its temperature is precisely controlled. From steady flow calibrations performed at
different temperatures the corresponding values of diffusion coefficient can be calculated. The obtained temperature dependence of diffusivity is shown in Figure 15. As expected the diffusion coefficient is strongly dependent on temperature and the measured data can be fitted by an exponential relationship (similar to Arrhenius equation D=A0 e(E/RT), where E and R are the activation energy barrier and universal gas constant, respectively). The viscosity and diffusivity of liquids can be related to each other in the form of traditional Stokes-Einstein parameter DT=const. This parameter is found to be practically constant also for our electrolyte. The value of DT = 2.2 10-15 N.K-1 calculated from measured diffusivity and viscosity data falls well into the range 2.0÷2.8 10-15 N.K-1 determined experimentally for the electrochemical systems based on ferricyanide ions and different supporting electrolytes [19].
Figure 15. Temperature dependence of the diffusivity (dash line stands for exponential fit: D = 7.26.10-7e-(2061/T)).
As the chip with sensors fabricated by the method of a sacrificed substrate proved to be a reliable platform for electrodiffusion measurements, it is now intended to be applied for the near-wall flow diagnostics in various microfluidics configurations (e.g. backward-facing step or rib flows).
4 Conclusions
The electrodiffusion method is proved to be a measuring technique suitable for the flow measurement done in close proximity of the wall, thus in the region difficultly accessible by standard anemometric techniques (e.g. PIV, LDA). The presented results document its application for detection of short-time reversal of the near-wall flow, delimitation of flow-recirculation zones, investigation of the near-wall turbulence, or detection of moving bubbles. The first results obtained with new sensors fabricated by the method of a sacrificed substrate [10] proved to be a reliable platform for the application of electrodiffusion technique in microfluidics.
Acknowledgement
The support by Czech Science Foundation GACR through the contract P101/12/0585 is gratefully acknowledged.
30 40 50 60 70 80
0 3000 6000 9000
I
(
P
A)
J(1/s)
1 10 100 1000 10000
0.00001 0.0001 0.001 0.01 0.1 1
I
(
P
A)
t(s)
5E-10 7E-10 9E-10 1.1E-09 1.3E-09
280 290 300 310 320 330
D
(m
2/s
)
References
1. J.R. Selman, Ch.V. Tobias, 1978. Mass-transfer measurements by the limiting-current technique, in Advances in Chem. Engineering (Acad.Press, NY, 1978)
2. T.J. Hanratty, J.A. Campbell, Fluid mechanics measurements (Washington, Hemisphere, 1983) 3. C. Deslouis, B. Tribollet B, J. Tihon, J.
Non-Newtonian Fluid Mech. 123, 141 (2004)
4. E. Kjeang, B. Roesch, J. McKechnie, D.A. Harrington, N. Djilali, D. Sinton, Microfluid Nanofluid, 3, 403 (2007)
5. N.A. Mouheb, A. Montillet, C. Solliec, J. Havlica, P. Legentilhomme, J. Comiti, J. Tihon, Microfluid Nanofluid, 10,1185 (2011).
6. K. Abi-Samra, T.H. Kim, D.K. Park, N. Kim, J. Kim, H. Kim, Y.K. Cho, M. Madou, Lab Chip, 13, 3253 (2013)
7. V. Hessel, H. Lowe, F. Schonfeld, Chem Eng Sci, 60, 2479 (2005)
8. T.M. Squires, S.R. Quake, Rev Mod Phys, 77, 977 (2005)
9. M.T. Kreutzer, F. Kapteijn, J.A. Moulijn, J.J. Heiszwolf, Chem Eng Sci, 60, 5895 (2005)
10. W. Schrott, M. Svoboda, Z. Slouka, D. Snita, Microelectron Eng, 86, 1340 (2009)
11. J.S. Son, T.J. Hanratty, J Fluid Mech, 35, 353 (1969) 12. J. Tihon, V. Tovchigrechko, V. Sobolik, O. Wein,
J.Appl.Electrochem. 33, 577 (2003)
13. J. Tihon, V. Penkavova, J. Havlica, M. Simcik, Exp Therm Fluid Sci, 40, 112 (2012)
14. V. Sobolik, O. Wein, O. Gil, B. Tribollet, Exp Fluids, 9, 43 (1990)
15. J. Tihon, J. Legrand, P. Legentilhomme, Exp Fluids, 31, 484 (2001)
16. V. Sobolik, O. Wein, J. Cermak, Collect Czech Chem C, 52, 913 (1987)
17. J. Tihon, V. Penkavova, J. Vejrazka, EPJ Web Conf, 45, 01089 (2013)
18. E. Eroglu, S. Yapici, O.N. Sara, J Chem Eng Data, 56, 3312 (2011)
![Figure 3. Double semi-circular microsensors prepared by the photolithography [3].](https://thumb-us.123doks.com/thumbv2/123dok_us/8208261.1371360/2.595.341.508.574.667/figure-double-semi-circular-microsensors-prepared-photolithography.webp)