Mapping Land-Use and Land-Cover Changes in Bahir Dar City and Its Surrounds
Using Remote Sensing
Abel Balew Bimrew a, Tesfaye Korme Oda b
a Abel Balew Bimrew
Corresponding author
Lecturer in Department of Geography and Environmental Studies, Madda Walabu University, Ethiopia. P.O.Box: 247 Bale Robe, Ethiopia; Email: [email protected].
b Tesfaye Korme Oda
Associate Professor in Ministry of Water, Electricity and Irrigation, Addis Ababa, Ethiopia; Email: [email protected].
Abstract
Spatio-temporal Land-Use and Land-Cover (LULC) changes have been affecting geo-environmental and climate change globally. This study aims to analyze LULC changes in Bahir Dar city and its surrounds. Landsat 5 TM (1987), Landsat 7 ETM+ (2002) and Landsat 8 OLI (2017) and SPOT images, and aerial photographs, master plan map and Google Earth Landsat images were used to analyze changes. In Bahir Dar city and its surrounds, LULC has been changing in space and time. During 1987-2017, more than 50% of the study area was covered with cropland. Settlement areas have increased from 3.3% in 1987 to 9.13% in 2017. However, wetland vegetation, shrubland, grassland, forest, and waterbodies have degraded. These changes are mainly attributed to population growth and its effect on the environment. Land-use and land-cover is a serious problem and it causes land and environmental degradation, climate change and loss of the biological environment.
Keywords: Landuse and landcover; LULC change; remote sensing; Bahir Dar city
1. Introduction
Currently, more than half of the world’s population live in urban areas and this is expected to be 66% in the year 2050 (United Nations, 2014). Developing countries, especially Africa and Asia contribute more to this rapid increase of urbanization (UN-HABITAT, 2013, 2010). Rapid population growth in the urban area has been increasing land-use and land-cover (LULC) changes globally in magnitude and spatial extent (Defries et al., 2004; Hansen et al., 2013; Lambin et al.,
2001; Lambin and Meyfroidt, 2011; Mustard et al., 2012). As the population increases the demand for resource utilization increases proportionally and puts pressure on natural resources and damages them. Besides, the land has been continuously and extremely depleted due to anthropogenic factors (Brink et al., 2014; Niamir-Fuller et al., 2012) since people could not take care of their land. Therefore, rapid population growth exploits both natural and manmade resources (Bhattacharjee and Nayak, 2003; Sarma et al., 2008).
In Ethiopia, problems of LULC changes are very high and have been increasing from year to year. This is mainly due to population growth (Hurni et al., 2005) and perceptions of local communities towards land management systems (Belay et al., 2014) which contributes a lot of conversion of landscape and depletion of resources, for instance, forest and its biodiversity, water and soil resources. As a result, the country is vulnerable to surface runoff and flooding, and sedimentation (Hurni et al., 2005) which are associated with extreme land-cover degradation. The land is very dynamic in all parts of the country particularly in Amhara regional state the problem is very severe because the land is not sufficient to support the population of the region. Because of this, particularly forest, woodland, and shrubland land-covers have been heavily depleted to obtain additional land for settlement, farmland and grazing land. Therefore, these cause deforestation, loss of biodiversity, soil erosion and land degradation and raise climate change.
The patterns of land-use and the types of land-cover of Bahir Dar city and its surroundings have been changing due to rapid urbanization. As a result, land-covers like forest, woodland, bushland, wetland shrubland, and waterbodies have depleted drastically. These result in land degradation and its associated effects, urban climate change and affect the living conditions of people. Therefore, in order to ensure sustainable management LULC change and maintain climate changes it is very crucial to monitor paths of land-use and land-cover changes and its dynamism and predict their possible future conditions. The main goals of this study are: (1) to monitor land-use and land-cover of Bahir Dar city and its surrounding from 1987 to 2017; (2) to assess LULC changes in the city and its surrounding and examine effects of land-use and land-cover changes.
2. Role of Remote Sensing for Mapping Land-Use and Land-Cover Change
land-use and land-cover are changed is essential for sustainable land management and economic development. Furthermore, assessing and mapping the consequences of LULC change and the possible solution is very significant. Monitoring temporal land-use and land-cover changes is also very important for environmental management.
In this regard, remote sensing has been playing a crucial role in providing satellite imagery to assess natural resources and monitor environmental changes. For example, Landsat is one of the satellites providing synoptic, repetitive and global coverage data freely since 1972. Landsat imagery have been used for various terrestrial applications. Therefore, remote sensing allows analysis land-use and land-cover change dynamics using time series of remotely sensed data by integrating it with socio-economic or biophysical data. Remote sensing is also efficient in land-cover mapping, detecting and monitoring land-land-cover change over time and space, identifying land use attributes and land cover change hot spots (Abate, 2011; Abbas et al., 2010; Temesgen et al., 2014). With the advancement of technology, reduction in data cost, availability of historic spatio-temporal data and high-resolution satellite images, remote sensing technologies are now very useful for conducting land cover change detection analysis and predicting future scenarios (Agarwal et al., 2002).
3. Data and Methods 3.1Study Area
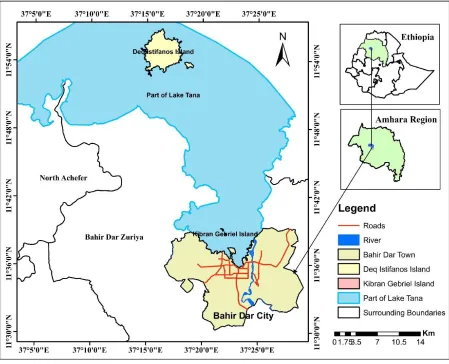
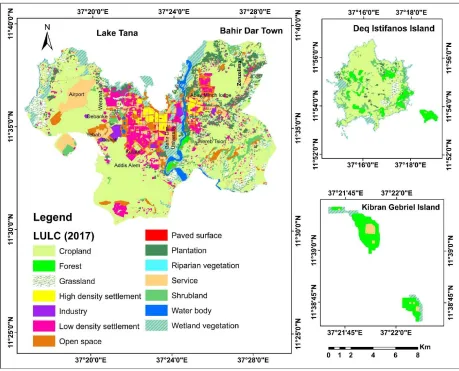
This research was conducted in Bahir Dar city and its surroundings which is the capital of Amhara National Regional State. Bahir Dar city is situated south of Lake Tana. The geographical location of the study area extends from latitude 11° 25' 19" to 11° 57' 7"N and longitude 37° 14' 35" to 37° 29' 7"E (Figure 1). It has a total area of 243.07 km2, from which 215.57 km2 is Bahir Dar city, and
the remaining 27.41 km2 and 0.09 km2 was Deq Istifanos and Kibran Gebriel Islands, respectively).
Figure 1: Geographical setting of the study area
3.2 Datasets
to aid image classification for these two study years, aerial photographs and master plan map of the city in 2003 were used. Ground truth data collected from the field using GPS and Google Earth Landsat images were used to validate LULC thematic layers.
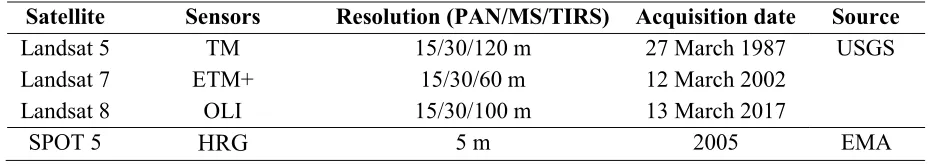
Table 1: Datasets used for the study and their source
Satellite Sensors Resolution (PAN/MS/TIRS) Acquisition date Source
Landsat 5 TM 15/30/120 m 27 March 1987 USGS
Landsat 7 ETM+ 15/30/60 m 12 March 2002
Landsat 8 OLI 15/30/100 m 13 March 2017
SPOT 5 HRG 5 m 2005 EMA
3.3 Methods
3.3.1 Digital Image Preprocessing
In remote sensing, Digital Numbers (DN) represent reflectance of surface materials detected by a sensor and tells about the properties of an object. The objects are represented in the form of pixels (pictorial element). Therefore, digital image processing (DIP) should be done to obtain meaningful information from pixels. Digital image processing is helpful to maintain the quality image through minimize interpretation errors for the purpose of interpretation and classification. Thus, DIP techniques such as image layer stacking, sub-setting and image enhancement were done in ENVI 5.1 environment.
Image sharpening: is an image enhancement technique which helps to improve the resolution of the images and enhance image interpretation. Among many image sharpening techniques, Gram-Schmidt spectral sharpening algorithm was used to sharpen Landsat images using SPOT 5 images. The Gram-Schmidt method is typically more accurate because it uses the spectral response function of a given sensor to estimate what the panchromatic data look.
3.3.2 Radiometric Correction
𝐿 = (𝐿𝑀𝐴𝑋 − 𝐿𝑀𝐼𝑁 ) /(𝑄𝐶𝐴𝐿𝑀𝐴𝑋 − 𝑄𝐶𝐴𝐿𝑀𝐼𝑁)) ∗ (𝑄𝐶𝐴𝐿 − 𝑄𝐶𝐴𝐿𝑀𝐼𝑁 + 𝐿𝑀𝐼𝑁 (1)
Where: 𝐿 is spectral radiance received by the sensor (W/ (m2 * sr * μm)), 𝑄𝐶𝐴𝐿 is the quantized
calibrated pixel value in DN, 𝐿𝑀𝐼𝑁 is the spectral radiance that is scaled to 𝑄𝐶𝐴𝐿𝑀𝐼𝑁 (W/ (m2
* sr * μm)), 𝐿𝑀𝐴𝑋 is the spectral radiance that is scaled to 𝑄𝐶𝐴𝐿𝑀𝐴𝑋 (W/ (m2 * sr * μm)), 𝑄𝐶𝐴𝐿𝑀𝐼𝑁 is the minimum quantized calibrated pixel value (corresponding to 𝐿𝑀𝐼𝑁 in DN which is 1), 𝑄𝐶𝐴𝐿𝑀𝐴𝑋 is the maximum quantized calibrated pixel value (corresponding to 𝐿𝑀𝐴𝑋 in DN which is 255).
Once DN is converted into radiance, the spectral radiance was converted to Top of Atmosphere (TOA) reflectance according to the equation:
ρ = 𝜋 ∗ 𝐿 ∗ 𝑑
𝐸𝑆𝑈𝑁 ∗ cosθ (2)
Where: ρ is TOP reflectance (unitless), 𝜋 is mathematical constant equals to ~ 3.14159 (unitless), 𝐿 is spectral radiance at the sensor’s aperture (W/ (m2 * sr * μm)), 𝑑 is Earth-Sun distance (astronomical units), 𝐸𝑆𝑈𝑁 is mean exoatmospheric solar irradiance, θ is solar zenith angle (degree).
Digital numbers of Landsat 8 OLI image were also converted to radiance using the formula given by USGS (2016).
𝐿 = 𝑀 𝑄 + 𝐴 (3) Where: 𝐿 is spectral radiance (W/ (m2 * sr * μm)), 𝑀 is radiance multiplicative scaling factor for
the band (RADIANCE_MULT_BAND_N from the metadata), 𝐴 is Radiance additive scaling factor for the band (RADIANCE_ADD_BAND_N from the metadata), 𝑄 is level-1 pixel value in DN.
The spectral radiance received by the sensor is converted into TOA reflectance using the equation:
ρ = 𝑀 𝑄 + 𝐴
Where: ρ is Top-of-Atmosphere Planetary Reflectance, θ is local solar zenith angle, 𝑀 is reflectance multiplicative scaling factor for the band (REFLECTANCE_MULT_BAND_N from the metadata), 𝐴 is reflectance additive scaling factor for the band (REFLECTANCE_ADD_BAND_N from the metadata), 𝑄 is level-1 pixel value in DN.
3.3.3 Image Classification
Image classification is a technique of extracting information from image based on the reflectance value of an object (Gao, 2009; Lillesand et al., 2004; Richards and Jia, 2006). The information class can be grouped into a thematic layer of having similar LULC in the image. Though there are automated image classification techniques, manual or visual image interpretation procedures were used. This is because there is a problem of pixel mixing especially in low-resolution images such as Landsat and this has seriously affected the land-use and land-cover classification accuracy of the study. To aid visual image interpretation and maintain classification accuracy, Google Earth Landsat images, aerial photographs and Bahir Dar city master plan were used. Thus, to generate land-use and land-cover thematic layers, image digitizing and split and merge functions were employed in ArcGIS 10.5 environment.
3.3.4 Accuracy Assessment
Accuracy assessment is a comparison of image interpretation by a computer with the aid of ground truth data (Gao, 2009; Richards and Jia, 2006). For this comparison, training sites which used for accuracy assessment were identified based on the stratified method of sampling because the classified image has virtually been thematically stratified. Stratified sampling guarantees that a specified number of evaluation pixels can be selected from a given land cover, that is all LULC classes can be adequately represented in the evaluation samples. No matter how small a land cover is in size or limited in its spatial distribution, this specified number of evaluation pixels can always be selected, although not in a single pass (Gao, 2009). Therefore, stratified training pixels for validation were selected based on the number of bands and LULC classes, i.e., N(N + 1) is the formula used for taking the total samples for validation and for each LULC class (N+1) training pixelsis required (Lillesand et al., 2004; Richards and Jia, 2006).
LULC class of the study area was checked and its classification accuracy was assessed. The overall accuracy, producer’s, and user’s accuracy and kappa coefficient were calculated based on the error matrix derived from each classification result. The overall accuracy is defined as the proportion of correctly classified pixels divided by the total classified pixels, as illustrated in equation 5.
𝑂𝐴 =∑ 𝑉
∑ 𝑉 (5)
Where: 𝑁 is the total number of classified pixels, ∑ 𝑉 is the sum of diagonal (correctly classified) pixels and ∑ 𝑉 is the sum of pixels along row.
Kappa coefficient was also calculated according to the equation given below.
𝐾 =𝑁 ∗ ∑ 𝑉 − ∑ (𝑥 ∗ 𝑥 )
𝑁 ∗ ∑ (𝑥 ∗ 𝑥 ) (6)
Where: 𝐾 is kappa coefficient, 𝑁 is the total number of classified pixels 𝑥 is total row pixel value for a certain class, 𝑥 is total column pixel value for the same class.
3.3.5 Change Detection Analysis
Change detection is a process of detecting differences with the objects or phenomena which are observed in the different time intervals. DeltaCue is an application designed to help to identify changes of interest in remotely sensed imagery acquired on two dates. The DeltaCue change detection process operates on co-registered image data and performs a differencing operation as its core change detection process. In order to analyze the total area of LULC changed from 1987 to 2017, the following formula was used.
𝐿𝑈𝐿𝐶 𝑐ℎ𝑎𝑛𝑔𝑒 (%) = 𝐴𝑟𝑒𝑎 𝑜𝑓 𝑟𝑒𝑐𝑒𝑛𝑡 𝑦𝑒𝑎𝑟(%) − 𝐴𝑟𝑒𝑎 𝑜𝑓 𝑓𝑜𝑟𝑚𝑒𝑟 𝑦𝑒𝑎𝑟(%) (7)
4. Results and Discussion 4.1Accuracy Assessment
Table 2: Summary of accuracy assessment for 1987, 2002 and 2017
LULC Classes 1987 2002 2017
Overall Accuracy 85.71 86.61 92
𝐾 0.854 0.864 0.92
4.2 Land-use and Land-cover during 1987-2017
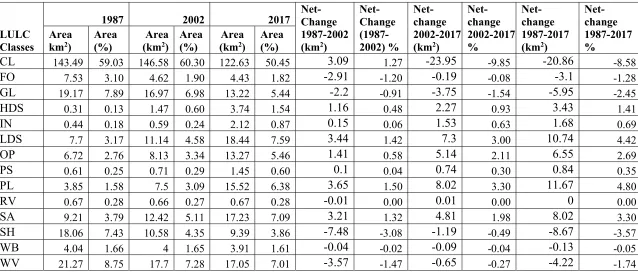
Cropland was the dominant land-use class in 1987 (Table 3 & Figures 2-4). From the total study area, cropland accounted for 143.49 km2 (59.03%). Whereas wetland vegetation, grassland, and
shrubland accounted for 21.27 km2 (8.75%), 19.17 km2 (7.89%) and 18.06 km2 (7.43%),
respectively. In 1987, high-density settlements covered the smallest area (0.31 km2).
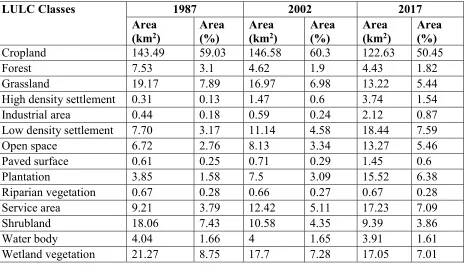
Table 3: Land-use and land-coverclasses and their area coverage in 1987, 2002 and 2017
LULC Classes 1987 2002 2017
Area
(km2) Area (%) Area (km2) Area (%) Area (km2) Area (%)
Cropland 143.49 59.03 146.58 60.3 122.63 50.45
Forest 7.53 3.1 4.62 1.9 4.43 1.82
Grassland 19.17 7.89 16.97 6.98 13.22 5.44
High density settlement 0.31 0.13 1.47 0.6 3.74 1.54
Industrial area 0.44 0.18 0.59 0.24 2.12 0.87
Low density settlement 7.70 3.17 11.14 4.58 18.44 7.59
Open space 6.72 2.76 8.13 3.34 13.27 5.46
Paved surface 0.61 0.25 0.71 0.29 1.45 0.6
Plantation 3.85 1.58 7.5 3.09 15.52 6.38
Riparian vegetation 0.67 0.28 0.66 0.27 0.67 0.28
Service area 9.21 3.79 12.42 5.11 17.23 7.09
Shrubland 18.06 7.43 10.58 4.35 9.39 3.86
Water body 4.04 1.66 4 1.65 3.91 1.61
Figure 2: Land-use and land-cover area in km2 (1987, 2002 & 2017)
Figure 3: Land-use and land-cover areain % (1987, 2002 & 2017) 0
40 80 120 160
A
re
a
in
S
q
K
m
LULC Classes
LULC area in Sq Km
1987 2002 2017
0 10 20 30 40 50 60 70
A
re
a
in
%
LULC Classes
LULC area in %
In 1987, most places in northeast, east, west, south, and southwest parts of Bahir Dar city and central Deq Istifanos Island were covered with cropland. Settlements, open space, paved surface, service, and industrial areas were concentrated in the center of the city. Service areas such as monasteries and churches were also found in Kibran Gebriel and Deq Istifanos Islands. Wetland vegetation cover was found along River Abay and Lake Tana shore, and some places in the west tip of the city. Most of the area of Kibran Gebriel Island was covered with forest. Forest cover was also found on Deq Istifanos Island and some places city. Grassland has covered some places in the center, west, southeast, eastern Bahir Dar and some places in eastern Deq Istifanos Island (Figure 4).
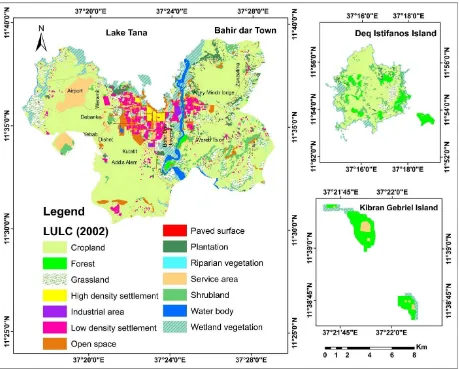
In 2002, cropland covered an area of 146.58 km2 (60.3%) (Table 3). It covered most eastern, west
and southeastern Bahir Dar city and central Deq Istifanos Island (Figure 5). Wetland vegetation, grassland, service area, low density settlement, and shrubland land-use and land-cover classes also covered high area.
Figure 5: Land-use and land-cover map of 2002
Cropland was also the leading land-use and land-cover class in 2017 having an area of 122.63 km2
Figure 6: Land-use and land-cover map of 2017
4.3 Spatio-temporal Land-use and Land-cover Changes from 1987 to 2017
During 1987 to 2017, LULC in Bahir Dar city and its surrounding has changed in type, magnitude and spatial extent. Anthropogenic effects were the driving factors for such kinds of extreme changes (Agarwal et al., 2002; Brink et al., 2014; Niamir-Fuller et al., 2012). Cropland reduced from 143.49 km2 (59.03%) in 1987 to 122.63 km2 (50.45%) in 2017 with a negative net-change of
20.86 km2 (8.58%). Landscape covered with shrubland, grassland, wetland vegetation, forest and
Table 4: Land-use and land-cover net-change from 1987 to 2017
LULC Classes
1987 2002 2017 Net-Change
1987-2002 (km2)
Net-Change (1987-2002) % Net-change 2002-2017 (km2)
Net-change 2002-2017 % Net-change 1987-2017 (km2)
Net-change 1987-2017 %
Area
km2) Area (%) (kmArea 2) Area (%) (kmArea 2) Area (%)
CL 143.49 59.03 146.58 60.30 122.63 50.45 3.09 1.27 -23.95 -9.85 -20.86 -8.58
FO 7.53 3.10 4.62 1.90 4.43 1.82 -2.91 -1.20 -0.19 -0.08 -3.1 -1.28
GL 19.17 7.89 16.97 6.98 13.22 5.44 -2.2 -0.91 -3.75 -1.54 -5.95 -2.45
HDS 0.31 0.13 1.47 0.60 3.74 1.54 1.16 0.48 2.27 0.93 3.43 1.41
IN 0.44 0.18 0.59 0.24 2.12 0.87 0.15 0.06 1.53 0.63 1.68 0.69
LDS 7.7 3.17 11.14 4.58 18.44 7.59 3.44 1.42 7.3 3.00 10.74 4.42
OP 6.72 2.76 8.13 3.34 13.27 5.46 1.41 0.58 5.14 2.11 6.55 2.69
PS 0.61 0.25 0.71 0.29 1.45 0.60 0.1 0.04 0.74 0.30 0.84 0.35
PL 3.85 1.58 7.5 3.09 15.52 6.38 3.65 1.50 8.02 3.30 11.67 4.80
RV 0.67 0.28 0.66 0.27 0.67 0.28 -0.01 0.00 0.01 0.00 0 0.00
SA 9.21 3.79 12.42 5.11 17.23 7.09 3.21 1.32 4.81 1.98 8.02 3.30
SH 18.06 7.43 10.58 4.35 9.39 3.86 -7.48 -3.08 -1.19 -0.49 -8.67 -3.57
WB 4.04 1.66 4 1.65 3.91 1.61 -0.04 -0.02 -0.09 -0.04 -0.13 -0.05
WV 21.27 8.75 17.7 7.28 17.05 7.01 -3.57 -1.47 -0.65 -0.27 -4.22 -1.74
Figure 7: Land-use and land-cover change in km2 (1987, 2002 & 2017)
-30 -25 -20 -15 -10 -5 0 5 10 15
A
re
a
in
S
q
k
m
LULC Classes
LULC change in Sq km
Figure 10: Land-use and land-cover changes map from 1987-2017
During 1987-2002, from total cropland change, 2.03 km2 and 1.79 km2 were converted into service
area and low-density settlement, respectively. Cropland was also converted into plantation, open space, and grassland. Contrary to this, 5.35 km2 cropland area was gained from shrubland in 2002.
Shrubland also changed to grassland, open space, plantation, service, and low-density settlement. Furthermore, 3.33 km2 of grassland were converted to cropland in 2002. Grassland was also
Table 5: Land-use and land-cover changes matrix from 1987 to 2002 (in km2)
L
U
L
C
1
98
7
LULC Class LULC 2002
CL FO GL HDS IN OP PL PS RV SA SH LDS WB WV Class Total
CL 136.32 0.03 0.02 1.39 1.94 2.03 1.79 143.49
FO 0.25 4.59 0.07 0.34 0.22 0.33 0.30 0.15 1.28 7.53
GL 3.33 14.72 0.06 0.26 0.39 0.22 0.14 0.05 19.17
HDS 0.31 0.31
IN 0.44 0.44
OP 0.01 0.10 0.15 5.38 0.02 0.12 0.40 0.53 6.72
PL 0.02 3.82 3.85
PS 0.04 0.57 0.61
RV 0.66 0.67
SA 0.08 9.13 9.21
SH 5.35 1.02 0.37 0.61 0.13 10.34 0.24 18.06
LDS 0.57 0.07 7.04 7.7
WB 3.98 0.05 4.04
WV 1.30 1.14 0.49 0.39 0.14 0.10 0.11 17.62 21.27
Class Total 146.58 4.62 16.97 1.47 0.59 8.13 7.50 0.71 0.66 12.42 10.58 11.14 4 17.7 243.07
From the total cropland change during 2002-2017, 7.88 km2, 7.59 km2, 5.43 km2, respectively
were converted to low-density settlement, plantation, open space (Table 6). Cropland also converted into service and industrial areas, grassland, high-density settlement, wetland vegetation, and paved surface. Further, places covered with grassland in 2002 was altered to open space (1.58 km2) and cropland (0.82 km2) in 2017.Service area, plantation, low-density settlement, shrubland,
Table 6: Land-use and land-coverchanges matrix from 2002 to 2017 (in km2)
L
U
L
C
2
00
2
LULC Classes
LULC 2017
CL FO GL HDS IN OP PL PS RV SA SH LDS WB WV Class Total
CL 121.10 0.19 0.04 1.33 5.43 7.59 0.01 2.95 0.03 7.88 0.03 146.58
FO 4.41 0.04 0.06 0.04 0.03 0.04 4.62
GL 0.82 12.65 0.14 1.58 0.54 0.54 0.22 0.45 0.04 16.97
HDS 1.47 1.47
IN 0.59 0.59
OP 0.09 0.03 0.15 0.20 4.99 0.04 0.74 0.76 1.04 0.10 0.01 8.13
PL 0.06 0.01 0.09 6.66 0.11 0.02 0.54 7.50
PS 0.69 0.71
RV 0.66 0.66
SA 0.01 12.40 0.01 12.42
SH 0.31 0.02 0.07 0.51 0.43 0.12 9.04 0.07 0.01 10.58
LDS 0.25 2.00 0.36 0.05 0.01 0.22 0.05 8.19 11.14
WB 0.02 0.01 3.78 0.17 4
WV 0.12 0.26 0.01 0.28 0.12 0.09 0.02 16.81 17.7
Class Total 122.63 4.43 13.22 3.74 2.12 13.27 15.52 1.45 0.67 17.23 9.39 18.44 3.91 17.05 243.07
During 1987-2017, low and high-density settlements, industrial and service areas, open space, plantation, and paved surface were expanded at the expense of cropland, grassland, shrubland, forest, wetland vegetation and water body. Land-use and land-cover change matrix of Bahir Dar town and its surrounding from 1987-2017 is illustrated in Table 7.
Table 7: Land-use and land-cover changes matrix from 1987 to 2017 (in km2)
L
U
L
C
1
98
7
LULC Class
LULC 2017
CL FO GL HDS IN OP PL PS RV SA SH LDS WB WV Class Total
CL 113.45 0.01 0.19 0.32 1.47 5.77 7.70 0.02 5.05 0.03 9.52 143.49
FO 0.02 4.40 0.02 1.17 0.31 0.37 0.42 0.15 0.64 7.53
GL 3.23 11.04 0.22 1.73 1.25 0.03 0.78 0.06 0.81 0.01 19.17
HDS 0.31 0.31
IN 0.44 0.44
OP 0.24 0.16 3.61 0.02 0.75 0.84 0.99 0.10 0.01 6.72
PL 0.05 0.04 3.54 0.05 0.17 3.85
PS 0.61 0.61
RV 0.67 0.67
SA 0.08 9.12 9.21
SH 4.64 0.02 0.82 0.08 0.06 0.71 1.78 0.38 9.09 0.49 0.01 18.06
LDS 0.24 1.34 0.26 0.05 0.01 0.27 0.05 5.47 7.69
WB 0.02 3.78 0.21 4.04
WV 1.15 1.15 0.04 0.85 0.78 0.02 0.32 0.15 16.82 21.27
Class Total 122.63 4.43 13.22 3.74 2.12 13.27 15.52 1.45 0.67 17.23 9.39 18.44 3.91 17.05 243.07
4.4 Effects of Land-use and Land-cover Change
Land-use and land-cover changes occurred due to natural and anthropogenic factors. As the United States Environmental Protection Agency (EPA) (1999) states, there were three main driving grounds for land-use and land-cover changes. These are (1) natural processes, such as wildfire, climate and atmospheric changes, and pest infestation; (2) direct effects of human activity such as deforestation, soil erosion and reduction of biodiversity which brings land degradation, and construction like road and buildings.; and (3) indirect effects of human activities, like depletion or lowering of water table and contamination of groundwater.
Anthropogenic factors are the major driving forces of land-use and land-cover changes (Brink et al., 2014; Niamir-Fuller et al., 2012) even though there is also a contribution from the natural processes. Land-use and land-cover change is a very complex process (Abate, 2011; Belay, 2002) because its causes and impacts are very closely related; for example, land degradation. Currently, the human-related causes of land-use and land-cover changes are very serious (Agarwal et al., 2002).
Extreme land-use and land-cover change attributed to rapid population growth and expansion of agricultural land responsible for massive collapse of natural vegetation, loss of biodiversity and land degradation. Exhausted land is also vulnerable to soil erosion which causes declining of organic matter in the soil, soil structure degradation and reduction in soil nutrients. Extreme land degradation has a severe impact on the productivity of agricultural fields (Aadil et al., 2014). Extreme alteration of vegetation covers such as forests, grassland, wetlands, bushland and shrubland brings a reduction of biodiversity and endless degradation of the natural environment. Intensification of agriculture such as crop and pastoral land towards the natural ecosystem which is related to population growth also contribute towards extreme changes of LULC and environment (Lambin and Meyfroidt, 2011).
(Yanagi, 2008; Zhao and Lai, 2007), and this brings environmental change. The change in hydrological condition of the earth surface alters the physicochemical property of wetlands. The scarcity of water, drop of the freshwater source and depletion of the existing groundwater are also problems related to land-use and land-cover changes. These directly or indirectly affect food production, human health, and economic development (Zhenglei et al., 2009).
Moreover, exhaustive use of land and change of land-cover and its patterns vulnerable to soil and land degradation. This leads to increasing poverty and migration, failure of land productivity, damage of biodiversity and natural resources, deterioration of groundwater recharge and carbon storage capacity, and change in population size; and spatial distribution (Abate, 2011). Land-use and land-cover changes also have consequences of soil and land degradation, soil erosion, salinization and desertification. Soil and land degradation results in soil erosion, salinization, compaction, acidification, nutrient impoverishment, waterlogging and dehumification. Desertification is also another effect of extreme land-use and land-cover. It increases the concentration of carbon-di-oxide in the atmosphere and brings wildfire. Therefore, incidences of forest fire related to land-use and land-cover degradation/change increase the emission of toxic gases (GHG) such as carbon monoxide and nitric oxide which alter the chemistry of the atmosphere causing air pollution, affecting energy balance and climate and global warming. Land-use and land-cover change have impacts on hydrology. It changes the quality of water and water flows, cause surface water pollution, depletion of groundwater aquifers. Land-use and land-cover changes also increase the frequency and severity of flooding which is due to continuous and serious deforestation.
5. Conclusions
Remote sensing is very significant for assessing and mapping land-use and land-cover changes. Landsat images provides crucial information about the current conditions of use and land-cover, landscape dynamics and environmental changes. The land-use and land-cover of Bahir Dar city and its surrounds has been changing in space and time because of rapid population growth associated with exploitation of land-cover and urbanization. Extreme land-use and land-cover changes bring land and environmental degradation, destruction of ecological environment and climate change and urban heat islands.
Acknowledgement
I express my heartfelt appreciation to Dr. Tesfaye Korme, for his strong support and constructive suggestion. My gratitude goes to Dr. Mersha Alemu for his kindly advise and support. I thank my father Balew Bimrew, and my mother Tinagn Belete, and my brothers Bayu Balew and Sendeku Balew, for their special supports from lower grade education up to now. I also thank my little brother Denberu Balew for his strong motivation and support before he passed away. Special thank also goes to my beloved wife Mintamer Melese and my sister Bethlehem Getie for their strong support.
Declarations of interest
There is no conflict of interest between the authors.
Submission Declaration
I hereby declare that this manuscript has not published previously and not submitted for any journal.
References
Abate, S. (2011). Evaluating the land use and land cover dynamics in Borena Woreda of South Wollo highlands, Ethiopia. J. Sustain. Dev. Afr., 13, 87–105.
Agarwal, C., Green, G.M., Grove, J.M., Evans, T.P., Schweik, C.M. (2002). A Review and assessment of land-use change models: Dynamics of space, time, and human choice. General technical report NE-297. Newtown Square, Pennsylvania: U.S. Department of Agriculture, Forest Service, Northeastern Research Station.
Bhattacharjee, P.R., Nayak, P. (2003). Socio-economic rationale of a regional development council for the Barak Valley of Assam. J. NEICSSR, 27, 13–26.
Brink, A.B., Bodart, C., Brodsky, L., Defourney, P., Ernst, C., Donney, F., Lupi, A., Tuckova, K. (2014). Anthropogenic pressure in East Africa: Monitoring 20 years of land cover changes by means of medium resolution satellite data. Int. J. Appl. Earth. Obs. Geoinform., 28, 60– 69.
CSA. (2013). Population projection of Ethiopia for all regions at wereda level from 2014 – 2017. Federal Democratic Republic of Ethiopia Central Statistical Agency, Addis Ababa, Ethiopia.
Defries, R.S., Foley, J.A., Asner, G.P. (2004). Land-use choices: Balancing human needs and ecosystem function. Front Ecol Env., 2, 249–257.
Donato, S.L.M.V., Sebastiano, C., Sebastiano, S., Federico, G.M. (2016). Anthropogenic influences in land use/land cover changes in Mediterranean forest landscapes in Sicily. Land 5. https://doi.org/doi:10.3390/land5010003
Fenglei, F., Yunpeng, W., Maohui, Q., Zhishi, W. (2009). Evaluating the temporal and spatial urban expansion patterns of Guangzhou from 1979 to 2003 by Remote Sensing and GIS methods. Int. J. Geogr. Inf. Sci., 23, 1371–1388.
Gao, J. (2009). Digital analysis of remotely sensed imagery. McGraw-Hill.
Hansen, M.C., Potapov, P.V., Moore, R., Hancher, M., Turubanova, S.A., Tyukavina, A., Thau, D., Stehman, S.V., Goetz, S.J., Loveland, T.R. (2013). High-Resolution Global Maps of 21st-Century Forest Cover Change. Science, 342, 850–853.
Hurni, H., Kebede, T., Gete, T. (2005). The implication of changes in population, land use and land management for surface runoff for Upper Nile Basin area of Ethiopia. Mt. Res. Dev., 25, 147–154.
Hussien, A.O. (2009). Land use and land cover change, drivers and its impact: A comparative study from Kuhar Michael and Lenche Dima of Blue Nile and Awash Basins of Ethiopia (A MScThesis). Cornell University, Ethiopia.
Jianga, J., Tiana, G. (2010). Analysis of the impact of land use/land cover change on land surface temperature with Remote Sensing. Procedia Environ. Sci., 2, 571–575.
Lambin, E.F., Meyfroidt, P. (2011). Global land use change, economic globalization, and the looming land scarcity. Proc Natl Acad Sci USA, 108, 3465–3472.
Lambin, E.F., Turner, B.L., Geist, H.J., Agbola, S.B., Angelsen, A., Bruce, J.W., Coomes, O.T., Dirzo, R., Fischer, G., Folke, C. (2001). The causes of land-use and land-cover change: Moving beyond the myths. Glob Env. Chang., 11, 261–269.
Lillesand, T.M., Kiefer, R.W., Chipman, J.W. (2004). Remote sensing and image interpretation, 5th ed. John Wiley & Sons, New York.
Liu, H., Zhang, S., Li, Z., Lu, X., Yang, Q. (2004). Impacts on wetlands of large-scale land-use changes by agricultural development: the small Sanjiang plain, China. Ambio, 33, 306– 310.
Liu, Y., Zha, Y., Ni, S. (2004). Assessment of grassland degradation near Lake Qinghai, West China, using Landsat TM and in situ reflectance spectra data. Int. J. Remote Sens., 25, 4177–4189.
Mustard, J.F., Defries, R.S., Fisher, T., Moran, E. (2012). Land-use and land-cover change pathways and impacts. Land Change Sci. Springer Dordr. Neth. 411–429.
Niamir-Fuller, M., Kerven, C., Reid, R., Milner-Gulland, E. (2012). Co-existence of wildlife and pastoralism on extensive rangelands: Competition or compatibility? Pastor Res Policy Pr. 2, 1–14.
Qijiao, X., Zhixiang, Z. (2015). Impact of urbanization on urban heat island effect based on TM imagery in Wuhan, China. Environ. Eng. Manag. J., 14, 647–655.
Richards, J.A., Jia, X. (2006). Remote sensing digital image analysis: An introduction, 4th ed. Springer-Verlag Berlin Heidelberg 2006, Germany.
Sarma, P.K., Lahkar, B.P., Ghosh, S., Rabha, A., Das, J.P., Nath, N.K., Brahama, N. (2008). Land use and Land cover change and future implication analysis in Manas National Park, India using multi temporal satellite data. Curr. Sci., 95, 1–5.
Tang, Z., Shi, C.B., Bi, K.X. (2014). Impacts of land cover change and socioeconomic development on ecosystem service values. Environ. Eng. Manag. J., 13, 2697–2705. UN-HABITAT. (2013). State of the World’s Cities 2012/2013: Prosperity of Cities. Routledge
Taylor & Francis Group, United Nations Human Settlements Programme, New York. UN-HABITAT (2010). State of the World’s Cities 2010/2011: Prosperity of Cities. Earthscan,
UK, United Nations Human Settlements Programme.
United Nations (2014). World urbanization prospects: The 2014 Revision, Highlights (No. ST/ESA/SER.A/352). United Nations, Department of Economic and Social Affairs, Population Division, New York.
USGS (2016). Landsat 8 (L8) data users handbook. Department of the Interior U.S. Geological Survey.
Wu, C.D., Lung, S.C.C., Jan, J.F. (2013). Development of a 3-D urbanization index using digital terrain models for surface urban heat island effects. ISPRS J. Photogramm. Remote Sens., 81, 1–11.