1
A Simulink Hydrological Estimation of Water Shortage
Problem in Al-Najaf Region
Ayad K Hussein1,2, Hayder H Kareem1 and Ali M Hayder1
1 Hydraulic Structures and Water Resources Department, College of Engineering, University of Kufa,
Al-Najaf, Iraq
* Correspondence: [email protected]
Abstract
Recently, the environment is being put under constantly increasing pressure. Globally, water shortage is considered as one of the most serious environmental problems which affect human life and plant wealth. Iraq is highly affected by water deficit in many regions. In particular, Al-Najaf region is selected to be under evaluation for the current and future water resources shortage. This study is based on the collected data for rainfall, evaporation, flow-rate, groundwater, water needed for irrigation, and daily uses for the period between 2000 and 2018. The Artificial Neural Network, normal distribution, and lognormal distribution type III are applied for analyzing the collected data in addition to predict the water shortage for year 2050. Results show a water shortage in years 2002, 2004, 2005, and 2017 only for the selected period. A Simulink model is constructed using Matlab to increase the credibility of the estimated results and gives accurate results for the groundwater and surface water needed. Where in 2050, it is found that it needs to use the groundwater source by 0.024x10⁹ m3
to support the surface water source which is represented by the Euphrates River. The study shows the extent of inefficient management of water resources in Al-Najaf region.
Keywords: water shortage; Euphrates River;Al-Najaf region; artificial neural network; Simulink / Matlab
1. Introduction
In 1977, the Turkish government began to benefit from the Euphrates and Tigris Rivers through the establishment of the South Anatolia Project known as the GAP project. For several years, the Middle East countries and especially Iraq have been suffering from a severe water crisis. In addition, there has been a significant drop in water flowing into the Tigris and Euphrates Rivers from the upstream states. In respect of Iraq, there are no alternative sources of water commensurate with the current consumption and therefore conflicts can arise in the region that can explode at any time, especially after global climate and environmental changes [1, 2]. GAP project includes 22 dams and 19 hydroelectric power plants, constructed on an area of 17x103 km2 of Turkish territory with a total
storage capacity of 100 km3, three times the storage capacity of the republic of Iraq and Syria. The
process of preventing the flow of water in the Tigris and Euphrates Rivers in Iraq will lead to future national crises and will have serious negative consequences for health, environmental, industrial, and economic issues. Where Iraq was used to get 20.9 km3/year of water in the Tigris River but once these
groups of dams are built, it is likely to fall to 9.7 km3/year, meaning that 47% of the river will be
depleted. As a result, 696x103 hectares of arable land will be left without cultivation because of water
scarcity, which in turn will lead to a significant loss in the agricultural sector [3]. Where within few years, Iraq is expected to have lost at least 50 percent of its share of the waters of the Tigris and Euphrates Rivers without taking into account the impact of climate change [4]. The Euphrates River is the longest river in Southwest Asia with a length of 2786 km and occupies an area of about 440 thousand km2 and this area inhabited by approximately 23 million people. The Euphrates River basin
shares with five states (Iraq 47%, Turkey 28%, Syria 22%, Saudi Arabia 2.97%, and Jordan 0.03%). The first three countries represent the biggest concern of the river basin. Climate change and the construction of dams in the upper parts of the basin have reduced the flow of the river over time as the flow was about 30.6 billion cubic meters before 1974 and now is around 4 billion cubic meters [5]. The United Nations Food and Agriculture Organization (FAO) said in its statement at the Kuwait International Conference for the Reconstruction of Iraq that about one-third of the country's population lives in rural areas and relies on agriculture for their daily subsistence [6]. This means that all residents
2
which will cause a future problem in Iraq. [7] have studied the total dissolved solids TDS, PH, EC content and heavy metals for three sectors in the Euphrates River basin in Iraq as well as the Tharthar, Habbaniya and Al-Razzaza lakes in the northern sector of the Euphrates River. The study was carried out through the field measurement of these elements and then the statistical analysis of these elements is carried out to be linked to discharge and water level in order to finally identify the importance of these elements in the impact on the quality of the Euphrates River's water. The study found that the water in the lakes of Tharthar, Habbaniya and Al-Razzaza had negative effects on the running water in the Euphrates River. It can be noticed that this study is a laboratory study of the polluted elements of the river and did not address the process of predicting the climatic factors and the extent of their impact on the current and future water scarcity in the Euphrates River. [8] has studied the programs that exacerbated by the population explosion, serious and dangerous situation where the shortage of water may exceed 80 billion cubic meters in 2025 in the Arab countries. Where [8] has stated that despite the current difficulties, it is believed that some measures can help to solve the water problem. Where the management of water resources in shared basins, the use of non-traditional water resources, the adoption of new techniques in irrigation, and the establishment of an academy that can transfer new technologies, all of these can reduce for some extent the issue of water shortage. Globally, still the real solution is unavailable for water scarcity. [9] and [10] have studied the desertification in the Tigris and Euphrates basins and the national water security strategy in Iraq, respectively. These studies have dealt with the problem of water scarcity in the Tigris and Euphrates Rivers and the impact of this water scarcity on the livestock and economic resources without discussing the construction of a statistical or scientific program that simulates the climatic and ecological variables of the regions so that future aquatic events can be predicted.
In the current study, a scientific program is constructed that introduces different reproductive information such as rainfall, evaporation, vegetative water needs, population requirements of drinking water suitable for human use, groundwater, and water levels available in the rivers to be inputted to an arithmetic program that analyzes these data and identifying whether there is water scarcity or not. In addition, it will rely on these data for the future prediction of water scarcity in order to develop the appropriate solutions to the problem before it occurs. Also, the current study is an analysis of the collected data for the region of Al-Najaf in Iraq (rainfall, evaporation, plant water requirement, population requirement of drinking water for human use, groundwater and water levels available in the Euphrates River) by using the Artificial Neural Network, normal distribution, and lognormal distribution type III firstly, and then build the Simulink program using the help of Matlab program for the purpose of confirming the accuracy of the data resulting from the statistical analyses. Furthermore, the Simulink program is used to predict the accurate water scarcity for the current and future times in the area of Al-Najaf and the proposed solutions for decision-makers that are certainly if followed, the problem of water scarcity will be fully controlled. Finally, one of the benefits of the current study is the possibility of using the Simulink program to predict current and future water scarcity to any other area in Iraq but by changing the input to the program, which represents the area to be studied.
2. Methodology and Results
In this part, it will discuss and explain the data collected from several sources in the city of Al-Najaf, such as rainfall, evaporation, flowrate in the Euphrates River, the city's water needs, plant needs, and groundwater available in Al-Najaf city, respectively. The data will then be analyzed statistically using the mathematical equations related to each parameter collected through using the artificial neural network, for the purpose of obtaining a logical prediction that represents the validity of the collected data and thus obtaining future water forecasting. This will provide a scientific study for the decision-makers on the reality of water available in the city of Al-Najaf for the present and future time.
2.1 Rainfall
3
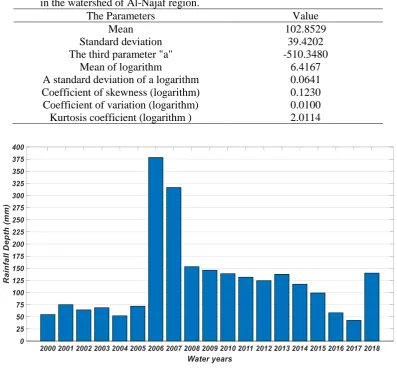
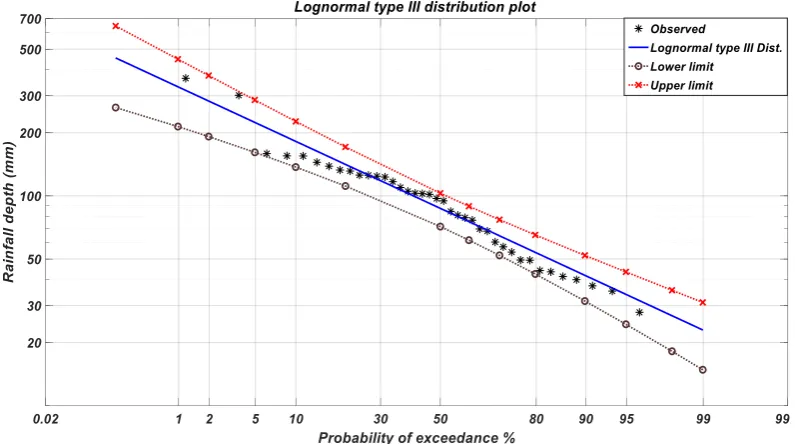
reducing humidity which in turns increased dust storms and thus declining water incomes and water levels in the Euphrates River in these years and the coming years significantly. For the purpose of discovering the probability of exceedance, the annual precipitation data from 1980 to 2018 are arranged in descending order. It is found these data is corresponded to the lognormal type III distribution as illustrated in figure 2, where the plotting position equation (1) is applied, the coefficients shown in table 1 are extracted using the statistical moment method [11, 12, 13]. For the purpose of finding the depth of rain in 2050 depending on the return period and equation (2), it is found to be equal 123 mm. Where the natural amount of rainfall is changed over years as this will affect the amount of water storage within Al-Najaf area watershed and this will in turn lead to appearing the problem of water shortage. Statistically this change can be considered as an advantage to predict the 2050 rainfall value.
0.098 data
N
0.092 order
m exceedance P
(1)
exceedance P
1 exceedance
P (2)
Where Pexceedance is the exceedance probability, morder is the order (rank) for each customized data point,
Ndata is the sample size, and T is the return period.
Table 1. Estimation of the parameters of the annual rainfall depth (mm) in the watershed of Al-Najaf region.
The Parameters Value
Mean 102.8529
Standard deviation 39.4202
The third parameter "a" -510.3480
Mean of logarithm 6.4167
A standard deviation of a logarithm 0.0641 Coefficient of skewness (logarithm) 0.1230 Coefficient of variation (logarithm) 0.0100 Kurtosis coefficient (logarithm ) 2.0114
4 2.2 Evaporation
Al-Najaf region is characterized to have a desert climate [14]. Where due to the aggravation of the problem of global warming and the imbalance in the proportions of the components of the gas envelope, higher temperatures are resulted due to these phenomena and thus the evaporation processes are increased as shown in figure 3, which shows the measured values of evaporation for the region of study.
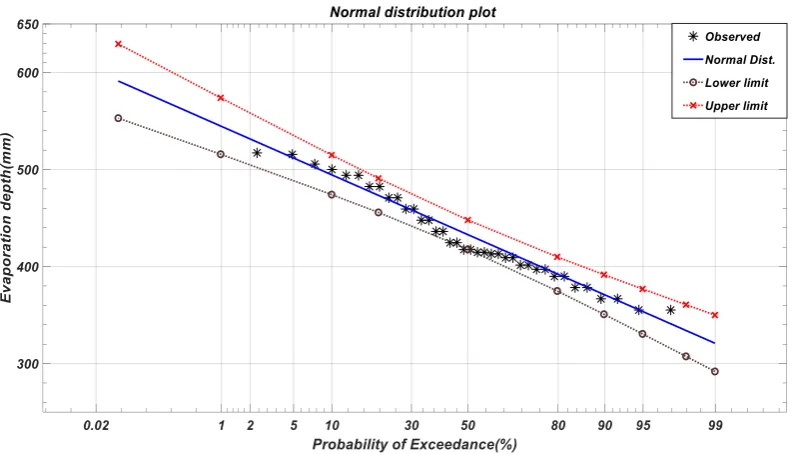
Since random data for rain and evaporation can be considered as natural data, it is possible to use the frequency analysis. Where it is found that the evaporation data is fitted to the normal distribution as shown in figure 4, which is resulted from applying the plotting position equation (3). The evaporation value of year 2050 is calculated based on the return period T=42.017 years from figure 4 to be equal 495.23 mm. It is important to consider this advantage to store large amounts of rain by creating a tank under the ground surface to avoid large evaporation in those years characterized by low rainfall for the purpose of benefiting from the other years characterized by heavy rainfall.
data N
1 order m exceedance P
(3)
5 2.3 Flowrate
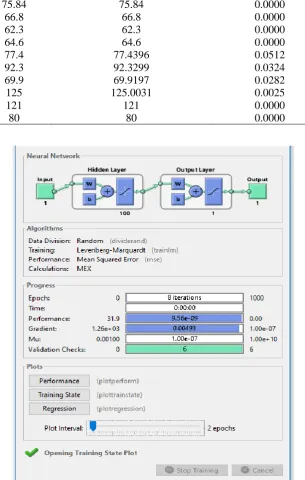
The main reason of studying of the previous natural data is to find the expected values for the future such as knowing the amount of water scarcity in the next years until 2050. This will help in designing the appropriate solutions for any area (particularly the place of study) until the year 2050 and planning to avoid as much as possible the forecasted water issues. Because of the existence of gates along the Euphrates River, which passes through the eastern part of Al-Najaf watershed region, it cannot use the analysis of the frequency and replace it with the artificial neural network ANN instead [15, 16, 17, 18]. Neural networks have used the back propagation, consisting of two layers, the hidden layer consisting of 100 neurons and the output layer as well as the input and output data as shown in figure 5.
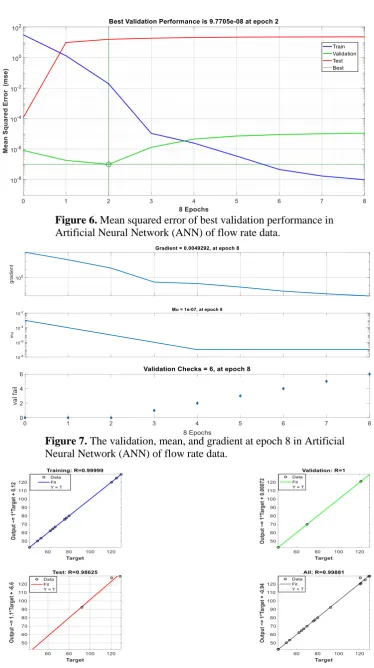
When the program is implemented in the Matlab (version 2018a), the mean squared error is found to be at the best validation performance 0.00053217 at epoch 8 as shown in figure 6. Results are also found to be acceptable because when epoch 14 is examined, validation performance is found to be equal 6, the mean equals 0.01, and the gradient is 0.3608 as shown in figure 7. In addition, the correlation coefficients for the training, testing, validating and all are 0.99583, 1, 1, and 0.99696, respectively, where these values are obtained to be a very well correspondence as it is illustrated in figure 8.
The percent of error (PerE) shown in table 2 is obtained from equation (4) by using the outputs of the flow rate resulted from the implementation of the ANN program 𝐹𝑙𝑜𝑤𝐴𝑁𝑁 and the actual flow rate
values 𝐹𝑙𝑜𝑤𝑎𝑐𝑡𝑢𝑎𝑙 and it was less or equal to 0.0512 with an average of 0.0122 as these values are
acceptable. Therefore, the program is implemented for year 2050 and found that the flow rate value is equal 61.34 m3/sec.
100 * actual
Flow
actual Flow ANN Flow PerE
(4)
Figure 3. The Evaporation depth during the period from 2000 to 2018.
6
Table 2. The percent error of the actual values of the flow rate with those flowrate values of the ANN program for years between 2000 and 2018.
Years Actual Value Values Taken from The Program Percent Error (PerE)
2000 50.2 50.1823 0.0353
2001 42.513 42.513 0.0000
2002 53.396 53.419 0.0431
2003 42.419 42.419 0.0000
2004 129.5 129.4653 0.0268
2005 128.5 128.5 0.0000
2006 120.5 120.5 0.0000
2007 120.37 120.37 0.0000
2008 83.6 83.5893 0.0128
2009 75.84 75.84 0.0000
2010 66.8 66.8 0.0000
2011 62.3 62.3 0.0000
2012 64.6 64.6 0.0000
2013 77.4 77.4396 0.0512
2014 92.3 92.3299 0.0324
2015 69.9 69.9197 0.0282
2016 125 125.0031 0.0025
2017 121 121 0.0000
2018 80 80 0.0000
7
Figure 6. Mean squared error of best validation performance in Artificial Neural Network (ANN) of flow rate data.
Figure 7. The validation, mean, and gradient at epoch 8 in Artificial Neural Network (ANN) of flow rate data.
8 2.4 Different requirements of city water
The population of Iraq is around 38.13 million citizens in 2018 and Al-Najaf province accounted for 3.93% of the population of Iraq, which corresponds to a population of 1.50 million citizens. Indeed, there are several factors helped to increase the population of the province of Al-Najaf such as site religious, geographic and various migration streams. Iraq has a high population growth rate of 2.85% annually, and the comparison between this growth and the decline in water revenues calls for plans to avoid any crisis of water shortage. This increase in population growth rated puts great pressure on the country's water resources particularly with the very difficult political, economic and social conditions [19, 20, 21].
The province of Al-Najaf faced a major challenge that is represented by the high population growth which led to a rapid increase for water demand in addition to the use of water for different requirements like for agricultural, industrial and household uses as illustrated in figure 9. It is expected that the amount of water needed for different uses within the city in year 2050 is 1.87x10⁹ m3.
Therefore, it is impossible to put an end to the increase of people or to the migration to this holy city, where the number of visitors reaches to millions through several days of each year during religious events from all over the world, so this highlights the seriousness to take this problem into account to reduce water scarcity to a minimum.
Figure 9. The water demand for different requirements of the city of Al-Najaf during the years from 2000 to 2018.
2.5 Different requirements of crops water
The amount of water needed to irrigate the rice plant in Al-Najaf region is calculated to be ranged between 616 m3/dunum in year 2006 and 14098 m3/dunum in year 2018 as demonstrated in table 3,
and various cubic meters for each season for vegetable crops and various plant trees as illustrated in Table 4 A and B, respectively. The water required to irrigate all the different crops is calculated and drawn in figure 10. In year 2050, drip irrigation systems should be used to irrigate green crops and to leave the traditional methods permanently. The water needed to irrigate all green areas in year 2050 is predicted to be approximately 1.53 *109 m3 where it is considered to increase the green areas and fruit
9
Table 3. The amount of water needed to irrigate the rice plant in Al-Najaf. Years Area (1000/Dunum) Water Needed to Irrigate The Rice Plant (m3)
2000 42.5 288022500
2001 27.5 288022500
2002 255 288022500
2003 182.5 288022500
2004 362.5 288022500
2005 445 288022500
2006 467.5 288022500
2007 356 288022500
2008 183 288022500
2009 197.5 288022500
2010 183.564 288022500
2011 173.564 288022500
2012 180 288022500
2013 200 288022500
2014 154 288022500
2015 135 288022500
2016 100.548 288022500
2017 90.314 288022500
2018 20.43 288022500
Table 4. Gross irrigation requirement of each season: A) for vegetable crops and B) for various plant trees.
A
m3/Dunum/Season
Vegetable Crops 600-780 Pomegranate 750-760 Wheat 350-450 Barley 550-650 Cucumber 550-650 Carrots 550-650 Potato 250-350 Beans grain B
m3/Tree/Season
Type of plant trees
13-17 Apricot (prunus armeniaca)
10
Figure 10. The water demand for agricultural crops during the years between 2000 and 2018.
2.6 Groundwater
Figure 11 represents the relationship between the production quantities of the wells-field located in Al-Najaf region for the years from 2000 to 2018. In the years from 2000 to 2008, the wells' number in the city used for obtaining groundwater were few, as the economic side was poor and the quantity of water supplied by the Euphrates River, which is passing on the eastern part of the city, led to being the interest from the groundwater resource is little [27, 28, 29, 30]. However, in 2009 and beyond, the source of the surface water represented by the Euphrates River was suffering from the problem of drought and lack of water, which led to the government's attention to the source of the city's abundant groundwater and to take better care of it. The number of dug wells has increased significantly after 2010 and the quantity of water supplied from the wells field became larger, ranging between 5-25 million cubic meters in 2000 and 2009, respectively, while it reached about 40 million cubic meters in 2010. In addition, the figure shows that the number of wells are increased dramatically in 2011 and stabilized on a regular increase to 2018, which makes the total quantities of water produced from the wells-field in the city are gradually increasing to about 110 million cubic meters in 2018. The large quantity produced by 2018 can be used for irrigation purposes and sometimes for domestic uses, which will in turn, lead to reduce the pressure on the surface water source represented by the Euphrates River. In year 2050, the number of wells producing water and the construction of groundwater tanks under the ground surface should be increased so that the water quantity can become equal to 1.53x10⁹
11
3. Simulink in Matlab
Simulink in Matlab represents an efficient method to increase the credibility of the estimated results [31]. Therefore, a sophisticated and modern model is constructed for Al-Najaf region to enhance the results of the study with more accurate results to finally evaluate whether a water shortage is happened in this region or not.
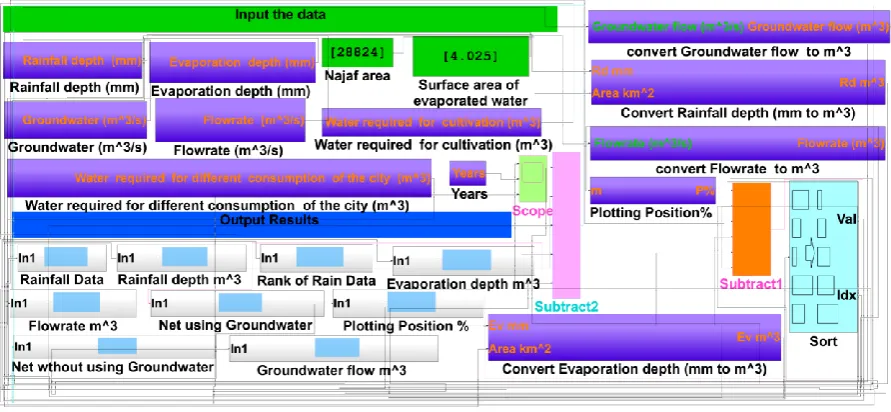
For this reason, a special work on water scarcity is designed using Simulink in Matlab (version 2018a), provided that all required arithmetic steps are performed in the calculations as well as the following steps.
1. Rainfall's depth data is converted from millimeters to cubic meters depending on equation (5) and the same way is applied for evaporation data.
2. Flowrate is usually measured in units of cubic meters per second and must be converted to cubic meters only through using equation (6), which includes the area of the river section of the flowing water and the time during which the flow is constant. The same steps and equation are implemented for groundwater data.
2 m A * 1000
mm d 3 m
D (5)
Where 𝐷𝑚3 is the rainfall or evaporation depth in cubic meters, dmm is the rainfall or evaporation
depth in millimeters, and 𝐴𝑚2 is the area in square meters.
sec t *
sec 3 m Q 3 m
D (6)
Where 𝑄𝑚3 𝑠𝑒𝑐
is the flowrate or groundwater in units of cubic meters per second, and tsec is the time
during which the flowrate or groundwater in seconds.
12
groundwater, and then equation (8) is applied depending on the use of groundwater because groundwater could be increased by increasing the number of wells producing water.
Figure 12 shows the set of subsystems of the Simulink model designed using Matlab. Each subsystem can be shown separately with its components in figure 13. All the required calculations within the program model for each subsystem are explained separately and shown in figure 14. The results of implementation the Simulink model for each subsystem through using Matlab program are illustrated in figure 15.
4. equation (7) is applied without dependence on groundwater. As shown in figure 16, which represents the water needs for the period from 2000 to 2018 without considering groundwater in the calculations, there are water shortage problems only in the years 2002, 2004, 2005 and 2017. Despite the increase in the various water needs in the city, the agricultural areas for growing rice and wheat are significantly reduced in 2017 and the available waste water is reduced due to modern irrigation methods such as spraying, which reduces the use of available water.
5. equation (8) is applied when using the groundwater as figure 17 shows the water needs for the period from 2000 to 2018 when considering groundwater in the calculations. From figure 17, the problem of water shortage is remained in years 2002, 2004, and 2005 due to the drilling of a limited number of wells that producing water. However, solving the problem of water shortage is represented by continuing the annual increase in the number of wells producing water. But this solution remains ineffective and it is better to build groundwater dams/tanks under the ground surface to keep these reservoirs far from high temperatures and thus reduce the amount of evaporation to a large proportion.
water crops of ts requiremen Different D city water of ts requiremen Different D n Evaporatio D Flowrate D Rainfall D nstorage Netchangei D (7)
13
water crops of ts requiremen Different
D city water of
ts requiremen Different
D
n Evaporatio D
r Groundwate D
Flowrate D
Rainfall D
nstorage Netchangei
D
(8)
14
15
Figure 15. A set of discrete figures shows the subsystems' results resulted from the model shown in figure 12.
16
Figure 17. The net volume of water with using groundwater for the years from 2000 to 2018.
4. Conclusion
Usually, the use of Simulink has multiple advantages where it is preferable to include an input or multiple inputs provided that each of them contains only one element. In the current study for water scarcity, it needs seven inputs at every 20-element entrance as this in Simulink within the Matlab is very difficult and requires more attention and effort, but it is achieved accurately with a non-short time.
Although groundwater is not fully utilized, there are no water shortage problems except in 2002, 2004, 2005 and 2017, while when using groundwater, the shortage is only in the years 2002, 2004, and 2005. This means that the problem is not with the availability of water, the real problem is in the waste process of the fresh water and the mismanagement of the surface water source as these problems have led to a scarcity of the available water for drinking, irrigation, economic, and other requirements.
Consequently, it is important to emphasize that the good management of water resources is the main key in eliminating water scarcity through not consuming large amounts of water and changing irrigation systems for agricultural lands from traditional non-economic methods to modern methods. All of that will lead to determining the actual quantity of water needed for crops which in turns will reduce the amount of water evaporated significantly and also reduce soil salinity.
In 2050, when applying equation (7), it can be noticed that the problem of water scarcity will be present by 0.024*109 m3 as the D
Net change in storage can be provided by D Groundwater as shown in equation
(9), but it should be mentioned here that equation (7) did not enter the source of groundwater in daily usage. Therefore, in 2050, it can overcome this very simple problem by providing the above quantity through the investment of subsurface water located in Al-Najaf province where it has many groundwater aquifers and can dig many wells to feed the city with water for various uses, such as industrial or agricultural or household or even for drinking if it is processed and made fit for human use.
17
Table 5. Values of hydrological variables affecting water scarcity. Hydrological variable unit Basic hydrological elements in water
scarcity Unit of measurement
3 m 9 required *10 Standard measurement unit 1.545 123mm Rainfall 1.056 495.23 mm Evaporation 2.887 /sec 3 61.34 m Flowrate 1.87 3 m 9 1.87*10 Different requirements of city water
1.53
3
m
9
1.53*10 Different requirements of Crops water
0.024 3 m 9 0.064*10 Groundwater References
[1] Ali A H 2018 Iraq's water crisis challenges and solutions Al-Bayan Center for Planning and Studies, Baghdad.
[2] Carkoglu, A and M Eder 2001 Domestic concerns and the water conflict over the Euphrates-Tigris river basin Middle Eastern Studies Vol. 37 No. 1. 43, (41-71).
[3] Al-Ansari N A and Knutsson S 2011 Toward prudent management of water resources in Iraq
Journal of Advanced Science and Engineering Research1, (53-67).
[4] Habib M 2018 Iraq’s lack of water: is a Foreign Policy Problem http://www.iraq-businessnews. com/2018/02/24/iraqs-lack-of-water-is-a-foreignpolicy-problem/.
[5] Al-Ansari N, Adamo N, Sissakian V, Knutsson S and Laue J 2018 Water resources of the Euphrates river catchment Journal of earth sciences and geotechnical engineering8, (1-20).
[6] Middle East Monitor 2018 FAO: Iraq lost 40% of its agricultural production
https://www.middleeastmonitor.com/20180214-fao-iraq-lost-40-of-its-agricultural-production/ [Accessed: 28/06/18].
[7] Kamel A H, Sulaiman S O and Mustaffa S 2013 Study of the effects of water level depression in Euphrates river on the water quality Journal of Civil Engineering and Architecture7, (238-247). [8] Al-Ansari N 1998 Water resources in the Arab countries: problems and possible solutions
UNESCO International Conference on World Water Resources at the Beginning of the 21st Century, Paris, 3-6 June 1998, (367-376).
[9] Al-Rubaie S 1999 The Crisis of the Tigris and Euphrates basins and the paradox of water and desertification Distribution House Telas-Damascus Al Saqi Books - London.
[10] Shareef H 2016 Briefing on the republic of Iraq’s national security strategy Iraqi National Security strategy.
[11] Bhakar S R, Bansal A N, Chhajed N and Purohit R C 2006 Frequency analysis of consecutive days maximum rainfall at Banswara, Rajasthan, India ARPN J. Engg. Appl. Sci1, (64-67).
[12] Hussein A K 2014 Best distribution and plotting positions of annual rainfall in the catchment of holy Karbala in Iraq Journal of Babylon University/Engineering Sciences22 No. 4.
[13] Weiss L L 1962 A general relation between frequency and duration of precipitation Mon. Weather Rev.90, (87-88).
[14] Iraqi General Organization for Meteorological Information 2018a Atlas of climate of Iraq for the years (1980–2018) Internal Report. Ministry of Transportation Baghdad Iraq.
[15] Bhattacharya B, Lobbrecht A H and Solomatine D P 2003 Neural networks and reinforcement learning in control of water system J. Water Resour. Planning Manage129 6 (1-8).
[16] Campolo M, Andreussi P and Soltani A 1999. River flood forecasting with a neural network model Journal of Water Resour. Res.35 4 (1191-1197).
[17] Govindaraju R S 2000 Artificial neural networks in hydrology: II, Hydrologic Applications. J. Hydrol. Eng.5 2 (124-137).
[18] Yazdani M R and Chavoshi S 2005 River flow forecasting using artificial neural networks 5th Iranian Conference on Hydraulics Kerman Iran, (911-918).
18
of Babylon.
[21] Al Baidhani J H, Mohammed A M, Al-Tufaily and Al Khazaly A I 2011 Design model of residential water demand in Al-Najaf city Journal of Babylon University Pure and Applied Sciences19 3.
[22] Molden D 2007 Water for food, water for life: a comprehensive assessment of water management in agriculture Earthscan London, UK.
[23] The impact of ISIS on Iraq's agricultural sector—situation overview; united states agency for international development 2016 Washington DC, USA.
[24] Iraq Grain and Feed Annual 2017 Iraqi wheat production down; weather, procurement drop, and conflict to blame, global agricultural information network (GAIN) report, United States Department of Agriculture Washington DC, USA.
[25] Adamo N, Al-Ansari N, Sissakian V, Laue J and Knutsson S 2018 The future of the Tigris and Euphrates water resources in view of climate change J. Earth Sci. Geotech. Eng.8, (59–74). [26] DEAT Guide to Agricultural Operations in Iraq; Department of Extension and Agricultural
Training, Ministry of Agriculture 2018 Baghdad, Iraq (In Arabic).
[27] Al-Jiburi H and Al-Basrawi N H 2015 Hyrdogeological map of Iraq, scale 1:1000000, 2nd edition Iraqi Bulletin of Geology and Mining 11 No. 1, (17–26). www.iasj.net/iasj?func=fulltext&aId=99667.
[28] Barwary A M and Slewa N A 1994 Geological map of Al-Najaf quadrangle, scale 1:250000
Iraq Geological Survey Publications, Baghdad, Iraq.
[29] Sissakian V and Mohmmed B 2007 Stratigraphy geology of the Iraqi western desert, special issue
Iraqi Bull. of Geology and Mining, (51-124).
[30] Hussain M H, Mohammed J S, Al-Haidarey, Al-Ansari N and Knutsson S 2014 Evaluation and mapping groundwater suitability for irrigation using GIS in Najaf governorate Iraq Journal of Environmental Hydrology22.