https://doi.org/10.5194/nhess-19-2249-2019 © Author(s) 2019. This work is distributed under the Creative Commons Attribution 4.0 License.
Geologic and geomorphic controls on rockfall hazard:
how well do past rockfalls predict future distributions?
Josh Borella1,2, Mark Quigley3,2, Zoe Krauss4,1, Krystina Lincoln5,1, Januka Attanayake3, Laura Stamp5,1, Henry Lanman6,1, Stephanie Levine7,1, Sam Hampton1,2, and Darren Gravley1,2
1Frontiers Abroad, 3 Harbour View Terrace, Christchurch, 8082, New Zealand
2Department of Geological Sciences, University of Canterbury, Christchurch, 8041, New Zealand 3School of Earth Sciences, The University of Melbourne, Victoria, 3010, Australia
4Department of Geology, Colorado College, Colorado Springs, CO 80903, USA 5Department of Geosciences, Williams College, Williamstown, MA 01267, USA 6Department of Geology, Whitman College, Walla Walla, WA 99362, USA 7Department of Geology, Carleton College, Northfield, MN 55057, USA
Correspondence:Josh Borella ([email protected]) Received: 6 June 2019 – Discussion started: 11 June 2019
Revised: 25 August 2019 – Accepted: 1 September 2019 – Published: 11 October 2019
Abstract.To evaluate the geospatial hazard relationships be-tween recent (contemporary) rockfalls and their prehistoric predecessors, we compare the locations, physical charac-teristics, and lithologies of rockfall boulders deposited dur-ing the 2010–2011 Canterbury earthquake sequence (CES) (n=185) with those deposited prior to the CES (n=1093). Population ratios of pre-CES to CES boulders at two study sites vary spatially from∼5:1 to 8.5:1. This is interpreted to reflect (i) variations in CES rockfall flux due to intra- and inter-event spatial differences in ground motions (e.g., direc-tionality) and associated variations in source cliff responses; (ii) possible variations in the triggering mechanism(s), fre-quency, flux, record duration, boulder size distributions, and post-depositional mobilization of pre-CES rockfalls rela-tive to CES rockfalls; and (iii) geological variations in the source cliffs of CES and pre-CES rockfalls. On interfluves, CES boulders traveled approximately 100 to 250 m further downslope than prehistoric (pre-CES) boulders. This is inter-preted to reflect reduced resistance to CES rockfall transport due to preceding anthropogenic hillslope de-vegetation. Vol-canic breccia boulders are more dimensionally equant and rounded, are larger, and traveled further downslope than co-herent lava boulders, illustrating clear geological control on rockfall hazard. In valley bottoms, the furthest-traveled pre-CES boulders are situated further downslope than pre-CES boul-ders due to (i) remobilization of pre-CES boulboul-ders by
post-depositional processes such as debris flows and (ii) reduction of CES boulder velocities and travel distances by collisional impacts with pre-CES boulders. A considered earth-systems approach is required when using preserved distributions of rockfall deposits to predict the severity and extents of future rockfall events.
1 Introduction
source and slope areas) between successive rockfall events and the post-depositional history for rockfalls can be com-plex (e.g., Borella et al., 2016a, b). To better understand how past rockfalls provide suitable proxies for characteriz-ing future hazard, comparisons between the geologic and geomorphic attributes of individual rockfall events and cu-mulative amalgamations of many events are valued. Critical evaluations of possible intervening changes to the landscape that may influence the mechanics of rockfall production and travel are an important component of these studies.
More than 7000 mapped individual rocks fell from cliffs in the Port Hills in southern Christchurch during the 2010–2011 Canterbury earthquake sequence (CES) in New Zealand’s South Island (Massey et al., 2014). Most of the rockfalls (>6000) occurred during the 22 February 2011 moment magnitude (Mw)=6.2 and 13 June 2011Mw=6.0
Christchurch earthquakes (Massey et al., 2014). Approxi-mately 200 houses were impacted, 100 houses were severely damaged, and five fatalities occurred due to falling rocks in the 2011 February earthquake (Massey et al., 2014; Grant et al., 2017). CES rockfalls were characterized by boulder-size distribution, runout distance (the distance a rock trav-els down a slope from its source), source-area dimensions, and boulder-production rates over a range of triggering peak ground accelerations (Massey et al., 2012a–e, 2014, 2017; Mackey and Quigley, 2014; Quigley et al., 2016).
Subsequent field investigations revealed an abundance of pre-CES rockfall deposits in CES rockfall areas (Townsend and Rosser, 2012; Mackey and Quigley, 2014; Borella et al., 2016a, b), suggesting multiple rockfall events had occurred at these sites in the past (Mackey and Quigley, 2014; Borella et al., 2016a, b; Sohbati et al., 2016). Retrospectively, these pre-CES deposits had the potential to contribute to hazard assessments during land planning and urban development in Christchurch prior to the CES; however, there is no evi-dence that they did so (Townsend and Rosser, 2012; Litch-field et al., 2016). At one well-studied location (Rapaki) in the Port Hills of southern Christchurch, CES and pre-CES boulder populations were shown to have similar volumetric size and morphology characteristics, but a significant popula-tion of CES boulders had longer maximum runout distances than their pre-CES counterparts (Borella et al., 2016a). Pre-CES rockfalls were dated using independent approaches to >3–15 ka (Mackey and Quigley, 2014; Sohbati et al., 2016; Borella et al., 2016b). With the aid of numerical modeling of rockfall trajectories (using RAMMS – rapid mass move-ment simulation) these data were collectively interpreted to suggest that anthropogenic deforestation between pre-CES and CES rockfalls was the primary cause for the observed spatial distinctions in CES and pre-CES rockfall distribu-tions (Borella et al., 2016a). Elsewhere in the Port Hills and greater Banks Peninsula, the causes for differences in the spatial distribution between CES and pre-CES rockfalls are less clear and in some locations the current positions of pre-CES boulders extend further distances from source cliffs than
their CES counterparts. A more integrated and regional un-derstanding of the geologic, geomorphic, seismogenic, and anthropogenic controls on rockfall distributions has the po-tential to inform rockfall hazard analyses for land zoning and engineering considerations here and elsewhere (e.g., Lan et al., 2010).
In this study we document the location, volume, mor-phology, and lithology for individual (n=1093) pre-CES rockfall boulders at two sites (Rapaki and Purau) in the Banks Peninsula near Christchurch, New Zealand. The spatial distributions and physical attributes for pre-CES boulders are compared to rockfall boulders (n=185) de-posited at the same sites during the 2010–2011 CES. The RAMMS’s bare-earth and forested numerical modeling sce-narios are conducted to help evaluate the influence of natural and anthropogenic factors on rockfall distributions, identify boulder sub-populations that have likely experienced post-emplacement mobility, determine the relative timing of pre-existing rockfalls (i.e., prehistoric or historic), and evalu-ate the efficacy of RAMMS in replicating empirical CES and prehistoric boulder spatial distributions. We highlight the complexity of interpreting future rockfall hazard based on former boulder distributions (particularly location) due to the following: (i) potential landscape changes including deforestation, (ii) changes in rockfall source (e.g., progres-sive emergence of bedrock sources from beneath sedimen-tary cover), (iii) remobilization of prior rockfalls by sur-face processes including debris flows (primarily in channels), (iv) lithological variability effects on the type of material lib-erated in successive events, (v) collisional impedance with pre-existing boulders (particularly in channels or valleys), and (vi) variations in the location, size, and strong ground motion characteristics of past rockfall-triggering earthquakes and their impact on rockfall flux and boulder mobility. We use an integrated earth-systems approach, which combines a consideration of geologic, geomorphic, seismogenic, and anthropogenic influences on rockfall distributions with high-quality field-based (i.e., prehistoric and contemporary rock-fall data sets) and instrumentally recorded (seismic) data sets, and numerical modeling. Our results have broad implications for using rockfall distributions to forecast future rockfall haz-ard.
2 Geologic setting 2.1 Overview
11.0 to 9.7 Ma (Hampton and Cole, 2009). Source rock at both sites is classified by Sewell (1988) and Sewell et al. (1992) as part of the Lyttelton Volcanic Group (LVG) and consists of basaltic to trachytic lava flows interbed-ded with breccia and tuff (Mvl). Numerous dikes and mi-nor domes are observed within the LVG. Our field obser-vations support the reported lithologic descriptions for the two study locales. The inferred strike and dip for lava flows nearest to the study sites indicates a shallow inclination in a predominantly northerly direction for measurements near-est the Rapaki and Purau study sites (Hampton and Cole, 2009). Sewell et al. (1992) report a similar shallow northerly to northwesterly dip of 12◦ for lava flows nearest Rapaki. The study areas were selected because both have abundant pre-CES and CES rockfall boulders (Fig. 4) derived from lithologically equivalent volcanic source rocks. Rapaki rep-resents a case study location proximal to the source of the 2011 February and June Christchurch earthquakes (epicen-ters∼2.5–5.0 km; hypocenters∼5.6–7.0 km), while Purau is located more distally (epicenters∼6.6–8.4 km; hypocen-ters∼8.9–10.3 km). Estimated rockfall-generating peak hor-izontal ground velocities (PGV) at the Rapaki site in the February and June earthquakes were ≥30 cm s−2 (Mackey and Quigley, 2014).
2.2 Rapaki study site
The Rapaki study site is situated in the Port Hills of south-ern Christchurch (Figs. 1 and 2) on the southeastsouth-ern slope of Mount Rapaki (Te Poho o Tamatea), which has a summit height of ∼400 m. The study hillslope is slightly concave to planar with a total area of ∼0.21 km2 and faces to the east-southeast. The source zone consists of steep to subver-tical bedrock cliffs composed of stratified basaltic lava and indurated auto-breccia or pyroclastic flow deposits (Fig. 5a– c). Breccia layers are thicker (∼3–10 m) and jointing is more widely spaced (often>10 m). Coherent lava layers are com-parably thin (<3 m) and joints are more closely spaced (gen-erally<1–2 m). Total height and length of the source rock are ∼60 and ∼300 m, respectively (Fig. 5a). Below the source area is a ∼23◦grassy hillslope composed of wind-blown sediment deposits (loess), loess and volcanic collu-vium, and overlying rockfall boulders (both CES and pre-CES) (Bell and Trangmar, 1987). Rapaki village (estimated population=100 residents) lies at the hillslope base at ele-vations of∼70 m a.s.l, to sea level (Fig. 2a and b). Anthro-pogenic deforestation has exposed a hillslope that is currently experiencing accelerated erosion (Borella et al., 2016a, b) in the form of mass wasting and tunnel gully formation. Shal-low landslides, including debris and earth fShal-lows, are most prevalent in upper- to mid-slope positions, while rill and gul-ley erosion predominate in lower-slope positions. Rockfall is a dominant surface feature at the Rapaki study site (Mackey and Quigley, 2014; Vick, 2015; Borella et al., 2016a, b). Pre-CES and CES rockfall boulders at the study site are
divided into two dominant lithology types: volcanic brec-cia (VB) and coherent lava (CL) basalt. During the 22 Febru-ary and 13 June 2011 earthquakes, more than 650 individual CES boulders ranging in diameter from<15 cm to >3 m were dislodged from the volcanic source rock near the top of Mount Rapaki, many impacting and destroying residential homes (Massey et al., 2014; Mackey and Quigley, 2014). 2.3 Purau study site
Purau is located on the southern side of Lyttelton Harbour, approximately 5 km southeast of Rapaki (Figs. 1 and 3). Slopes at Purau have a west-northwest aspect, the oppo-site of the Rapaki study hillslope. Mapping of pre-CES and CES rockfall was performed on and within several interfluves (spurs) and bounding valleys, respectively (Fig. 3) and en-compassed a total area of∼1.4 km2. The source rock
ge-ology at Purau, including lithge-ology and structure, is equiva-lent to that observed at Rapaki (Fig. 5d and e). The ridgeline (i.e., volcanic source rock) to the east obtains a maximum el-evation of∼440 m. Locally, individual vertical to subverti-cal bluff faces are estimated to be∼20–30 m in height. From the base of the volcanic source rock, slopes extend downward toward Purau Bay at angles ranging from∼30 to∼5◦near Camp Bay Road (Fig. 3). Field observations indicate the vol-canic rock is overlain by loess, loess colluvium and volvol-canic colluvium, and pre-CES and CES rockfall boulders of small (e.g.,<1 m3) to extremely large sizes (e.g.,>100 m3). De-forestation of Purau slopes has left the hillside covered pri-marily in low-lying grass and bush. Shallow slips are abun-dant and are commonly observed on steep slopes, including valley flanks. Maximum landslide depth is typically ∼1– 1.5 m and often exposes volcanic bedrock at bottom, indicat-ing the overlyindicat-ing sediment is relatively thin. Tunnel gulley erosion predominates on canyon flanks and at lower eleva-tions.
3 Methods
3.1 Field mapping and characterization of CES and pre-CES rockfall boulders
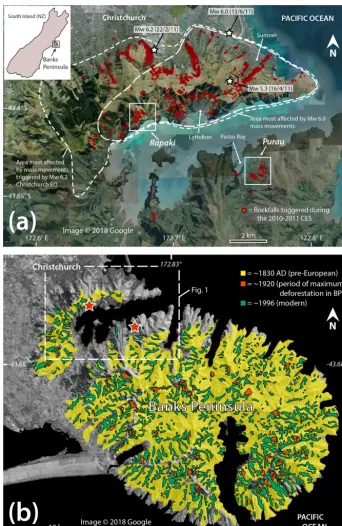
Figure 1. (a)© Google Earth image showing Rapaki and Purau study sites. CES rockfall locations as mapped by GNS Science and the authors (at Rapaki and Purau) are shown (red). Epicenter locations for 22 February, 13 June, and 16 April 2011 events are displayed (modified from Massey et al., 2014). Inset map of South Island (New Zealand) shows the Banks Peninsula and the approximate location for study site (yellow star).(b)Anthropogenic deforestation of Banks Peninsula (modified from Harding, 2003, and Wilson, 2013). Removal of native forest occurred rapidly in Banks Peninsula (BP) with the arrival of the Polynesians (1280 CE) then the Europeans (1830 CE). Before the Polynesian (Maori) arrival, extensive native forest was present throughout the BP. Prior to European settlement, minor to moderate removal of indigenous forest by Maori occurred, with burning being the primary tool for clearance (yellow). By 1920, Europeans had removed
Figure 2. (a)Mapped pre-CES volcanic breccia (VB) and coher-ent lava (CL) boulders with volume≥1.0 m3at Rapaki. The largest boulders with the furthest runout distances are comprised exclu-sively of volcanic breccia. Ratio of pre-CES VB to CL boulders is∼22:1.(b)Mapped CES VB and CL boulders at Rapaki study site. Note the low number of CL rockfall boulders detached dur-ing the CES at Rapaki. Ratio of CES VB to CL boulders is 15:1 (a : volcanic source rock; b : dominated by volcanic boulder collu-vium and volcanic loess collucollu-vium; c : loess collucollu-vium underlain by in situ loess and volcanic rock; d : alluvial sediments overlying loess and bedrock).
shorter of the two measured lengths was used for the 3rd di-mension, thus insuring a conservative boulder size estimate. No rounding factor was applied to volumetric estimations of pre-CES boulders. The lithology type was determined for each pre-CES boulder and was based primarily upon the observed dominant rock “texture”. Boulder lithologies were categorized as VB or CL. Transitional lithologies were rarely observed (<1 % of total) and assigned as VB or CL based on the volumetrically predominant rock type.
3.2 Boulder runout distance
Boulder runout distance was determined by measuring the shortest horizontal and ground-length distances, per-pendicular to slope contour lines, from the nearest po-tential bedrock source areas to mapped boulder lo-cations using Google Earth Professional (Tables S5– S8, https://doi.org/10.5061/dryad.9km1t86). Runout dis-tance was calculated for 409 pre-CES boulders and 48 CES boulders (for volume≥1.0 m3) at Rapaki. Due to safety con-cerns we were unable to record locations for pre-CES boul-ders within∼100 m (map length) of the volcanic source rock at this site. However, boulder frequency counts (for boul-der volume≥0.1 m3) were field measured within a 300 m2 area at distances of 0–10 m (n=31), 30–40 m (n=35), 60– 70 m (n=77), and 100–110 m (n=24) from the volcanic source rock (see Fig. A1). The boulder frequency counts at these distances were used to extrapolate the number of boul-ders across remaining sections of the study site, consistent with visual inspection of air photos. At Purau, four sepa-rate geomorphic domains (PD1–PD4) were created to evalu-ate pre-CES and CES boulder runout distance (see Fig. 3; Tables S7 and S8, https://doi.org/10.5061/dryad.9km1t86). The domains include interfluve and valley morphologies, tar-get areas with both CES and pre-CES rockfall boulders, and cases where the pre-CES rockfalls were sourced from a sin-gle or limited number of rock exposures. We generally report map length runout distance within this paper.
We used the empirical shadow angle method (Lied, 1977; Evans and Hungr, 1993) to analyze the travel distance of rockfalls at Rapaki and Purau. The shadow angle is the arc-tangent of the relationshipHt/Lt, whereHtis the height of
fall on the talus slope (elevation difference between the apex of the talus slope and final emplacement location of the rock-fall block) and Lt is the travel distance on the talus slope
Figure 3. (a) Mapped pre-CES and CES rockfalls with vol-ume≥1.0 m3at Purau study site. Ratio of pre-CES to CES boul-ders is∼5:1 (a : volcanic source rock; b : dominated by volcanic boulder colluvium and volcanic loess colluvium; c : loess collu-vium underlain by in situ loess and volcanic rock; d : alluvial sed-iments overlying loess and bedrock). (b) Mapped pre-CES VB and CL boulders at Purau. Ratio of pre-CES VB to CL boulders is ∼2:1.(c)Mapped CES VB and CL boulders at Purau study site. Note the low number of CL rockfall boulders detached dur-ing the CES at Purau. Ratio of CES VB to CL boulders is∼14:1. PD1–PD4 represent Purau rockfall domains.
3.3 RAMMS rockfall modeling
Three model scenarios were conducted using the Rapid Mass Movements System (RAMMS) software (Bartelt et al., 2013; Leine et al., 2014). RAMMS_1 represents a bare-earth CES model and was performed to test the reliability of RAMMS in replicating the spatial distribution for CES rockfalls at Pu-rau. RAMMS_2 assumes a vegetated slope and simulates hillslope conditions prior to deforestation (i.e., prehistoric). RAMMS_3 models the potential future rockfall hazard at Pu-rau and assumes a bare-earth (deforested) hillslope and dry soil moisture conditions to insure a worst-case (conservative) outcome. Please see Supplement for more detail on the indi-vidual RAMMS modeling scenarios.
The Purau terrain was modeled using a 4 m DEM (dig-ital elevation model) derived from LIDAR (light detection and ranging) surveys to model CES (bare-earth scenario) and pre-CES (prehistoric forested slope scenario) rockfall distri-butions. The rockfall boulders were modeled as rigid poly-hedral. The source areas (i.e., volcanic rock) and remaining runout terrain types (i.e., loess and loess–volcanic colluvium) (Table A1 Figs. A4–A6) for the RAMMS model scenarios (i.e., RAMMS_1 to _3) were chosen following the methods of Vick (2015) and Borella et al. (2016a) and delineated as polygon (Fig. A4) and polyline (Figs. A5 and A6) shape-files in ArcGIS from field observations, desktop study of or-thophotography, and satellite imagery.
Boulder shape and size are highly influential in the dy-namics and runout of a rockfall event (e.g., Leine et al., 2014; Latham et al., 2008). Boulder shapes and sizes used in the model simulations were representative of the true boul-der geometries observed at Purau and Rapaki (Borella et al., 2016a). Rock shapes were created using the RAMMS “rock builder” tool, which creates boulder point clouds based on a user-defined shape and size. All boulder shapes reflected “real” rock bodies that have been field scanned. For each size class of boulder, varying shapes were selected, which are simplified to equant, flat, and long. Please see Supple-ment for more detail on boulder shape and size distributions utilized in each of the RAMMS modeling scenarios.
applied. These forest values are equivalent to those utilized in Borella et al. (2016a) at Rapaki in the Port Hills of south-ern Christchurch. We also simulated a uniform forest density increase of 10 000 kg s−1(see Sect. 4). As evidenced by mod-ern native forest analogs, tree growth was extended upward to the base of the source rock and was also applied to areas between outcropping volcanic source rock.
3.4 Strong ground motions near rockfall source cliffs Strong ground motion accelerograms for stations LPCC, D13C, D15C, and GODS were obtained from GeoNet (https: //www.geonet.org.nz/, last access: 11 May 2019, Fig. 6) to analyze the influence of ground motion on rockfalls. All these stations are Kinemetrics Etna instruments except LPCC, which is a CUSP-3 instrument. LPCC recorded both the Mw=6.2 event on 22 February 2011 and theMw=6
event on 13 June 2011. The other stations were installed following theMw=6.2 earthquake and thus recorded only
the Mw=6 earthquake. The data were sampled at 0.005 s
(Nyquist frequency 100 Hz) and filtered with an effective passband having corners ∼0.05 and ∼40 Hz. We inte-grated accelerograms to produce velocity seismograms and computed envelopes using ENV=
√
[x(t )·2+H (x(t ))·2], wherex(t )are time points in the seismogram, andH is the Hilbert transform. The particle velocity hodograms are cal-culated in the horizontal plane by rotating the horizontal or-thogonal components of the seismogram to a standard N–S E–W coordinate system. The time window of particle veloc-ity hodograms is ±5 s around the peak of the envelope of the east component. This ensures that the most significant ground motion resulting from both phase and group velocity peaks is accurately captured. Following a similar procedure, we computed particle motion hodograms by integrating ac-celerograms twice. These are given in Fig. 7a–e. Additional methods were used to analyze D13C data following interpre-tation of initial results; these are described in Sect. 5.7.
4 Results
4.1 Rockfall mapping and boulder frequencies 4.1.1 Rapaki
A comparison of the spatial distributions for pre-CES and CES rockfalls at Rapaki (Fig. 2) indicates that pre-CES rock-falls are more concentrated near the source area and have shorter maximum runout distances (560±15 m) than the fur-thest traveled CES rockfalls (700±15 m) that impacted Ra-paki village during the 2011 Christchurch earthquakes. The CES rockfalls represent a subset of the pre-CES rockfall data set; the ratio of pre-CES (n=409) to CES (n=49) rockfalls at Rapaki is ∼8.5:1 (Fig. 2). The pre-CES and CES rockfall data sets are separated into VB and CL boul-ders (Figs. 2 and 4) to unboul-derstand the influence of
vol-canic lithology on rockfall runout and final resting location. Very few CL boulders with volume≥1.0 m3 exist for pre-CES (n=18) and CES (n=3) rockfalls at Rapaki. Pre-CES and CES VB boulders display longer average and maximum runout distances than their CL counterparts (Fig. 2), and CES CL and VB boulders display longer average and maximum runout distances compared with their pre-CES equivalents. The ratio of pre-CES VB to CL and CES VB to CL rockfall boulders is∼22:1 and∼15:1, respectively (Fig. 2).
4.1.2 Purau
Pre-CES and CES rockfalls are widely distributed at the Pu-rau study location (Fig. 3). Rockfall boulders are deposited on interfluves but are predominantly concentrated within nearby canyons, highlighting the strong influence of topog-raphy at the site (Fig. 3). Seven CES detachment zones were identified in the field. CES rockfall boulders nearest to the Purau village display the longest runout distance (372 m) and most distinct spatial contrast with similarly sourced pre-CES boulders (deposited within ∼105 m of the local vol-canic source rock) (Fig. 3a). Elsewhere, pre-CES boulders can be observed at further distances from the source rock than CES rockfalls. The ratio of pre-CES to CES rockfall boulders is∼5:1 (Fig. 3a). Pre-CES VB boulders are de-posited throughout the Purau location, while the deposition of CL pre-CES boulders is concentrated within the central and southern drainage canyons (Fig. 6a). The ratio of pre-CES VB to CL boulders is∼2:1 (Fig. 3b). CES VB boul-ders (n=127) significantly outnumber CL boulders (n=9) at the Purau site (Fig. 3c), reflecting the lack of detachment within CL source rock lithologies during the CES. The ratio of CES VB to CL rockfall boulders is∼14:1 and represents a significance difference compared with the corresponding pre-CES VB:CL ratio (Fig. 3c).
rough-Figure 4.Pre-CES and CES VB boulders at Rapaki and Purau study sites.(a)Pre-CES boulder in footslope position with smaller CES boulder at right bottom.(b)Exploratory trenching exposes the colluvial sediment wedge at the backside (upslope) of the boulder.(c)Pre-CES boulder at Purau study site. Erosion of the surrounding hillslope sediments has exposed the boulder base and underlying loessic sediment.
(d)Advanced surface roughness and abundant lichen growth on pre-CES boulder surface.(e)CES boulder (∼28 m3) detached from Mount Rapaki and emplaced in the Rapaki village during the 22 February 2011 earthquake (photo courtesy of D. J. A. Barrell, GNS Science).
(f) CES boulder showing 2011 detachment surface (1) and adjacent non-detached surface (2) with higher degree of surface roughness.
(g–k)Representative CL boulders at Rapaki and Purau sites exhibit typical elongate and flat morphologies.
ness (i.e., smooth compared with VB boulders). Elongate and flat boulder morphologies predominate for CL boulder lithologies (Fig. 4g–k).
Both VB and CL pre-CES boulders can be observed par-tially to nearly completely buried by loess colluvium (see Fig. 4a, b, g). Instances do occur, however, where no sed-iment is built up at the boulder backside (Fig. 4c) due to
VB boulders preserve the thickest colluvial wedge sediments (see Fig. 4b).
4.3 Source rock characteristics
The volcanic source rock at Rapaki (Fig. 5a–c) and Purau (Fig. 5d and e) is comprised of interlayered VB and CL lay-ers (Fig. 5a–e). The breccia laylay-ers comprise the bottom and top of discrete lava flows, while the coherent lava generally occupies the center of the lava flow where cooling was not as rapid, and there was less interaction with the substrate and/or cooling interface (Fig. 5c–g). Jointing is pervasive within the volcanic source rock, but to varying degrees depending upon layer composition and corresponding texture. Layers com-prised of CL exhibit the highest fracture density (Fig. 5e and f) and were formed during primary cooling of the lava flow, producing a columnar-style pattern. The CL layers con-tain numerous intersecting sub-vertical to vertical, to curvi-linear joint sets, with spacing rarely exceeding∼1–2 m. The small joint spacing imparts a first-order control on CL boul-der size and is reflected in the small size range for pre-CES CL boulders. Layers comprised of VB exhibit a lower frac-ture density, with joints more widely spaced (and irregular in shape), often 5–10 m or greater apart (Fig. 5d and e). The wider spacing for joints within VB layers promotes greater rockfall boulder volume (see Sect. 4.4. below).
During the CES, rockfall detachment occurred within ap-proximately 9 % (by area) of the volcanic source rock overly-ing the Rapaki study hillslope (Fig. 5a). The volcanic source rock is comprised of 86 % VB and 14 % CL (VB:CL ra-tio= ∼6:1). Approximately 69 % of the CES detachment areas occurred within VB and the remaining 31 % within CL (Fig. 5a). However, 20 % of the identified CL source rock detached during the CES, while only 7 % of the identified VB source rock detached during the CES, indicating the CL lithology was more susceptible to detachment.
We were unable to conduct a source rock investigation at Purau with the same spatial resolution as Rapaki because we considered the areal extent of the bedrock source cliffs to be too large at Purau to address in this study and there were safety concerns relating to access and potential for fur-ther rockfalls. However, some observations were made for the Purau source rock (Fig. 5d and e) as well as other vol-canic coastal cliff outcrops at Sumner (Fig. 5f) and Redcliffs (Fig. 5g). Field observations indicate that CL layers at Purau are not as prevalent as (and generally thinner than) VB layers, but in some cases may exceed a thickness of 5 m, which is thicker than CL layers observed at Rapaki (see Fig. 5b and c). At Sumner and Redcliffs, VB and CL layers display roughly equivalent thicknesses (∼2–3 m), a condition not apparent at Rapaki or Purau. The variability in layer thickness pre-sumably reflects differences in proximity to source vents and differing conditions during primary cooling of the lava flows.
4.4 Boulder volume
The size and frequency–volume distributions for pre-CES and CES rockfall boulders (for volume≥1.0 m3) at Rapaki and Purau display similarity (Fig. 8a and c) and can be mod-eled using power law functions (Fig. 8b and d), with the number of rockfall boulders decreasing significantly as vol-ume increases. Overall, statistical coherence is observed at the 25th, median, and 75th percentile boulder sizes; how-ever, pre-CES rockfalls are consistently higher for each of the size categories at the two study locations (Table 1). Ra-paki displays the highest pre-CES to CES variance for 25th, median, and 75th percentiles, while Purau records the biggest pre-CES to CES variance for the average, 95th percentile, and maximum boulder volumes (Table 1, Fig. 8a and c). An inter-site comparison of rockfall volumes indicates that pre-CES rockfalls at Rapaki are greater for the 25th, median, and 75th percentile sizes (Table 1) while Purau exhibits larger sizes for the 95th percentile, maximum, and mean boulder categories (Table 1). For CES boulders, the 25th, median, 75th, and 95th percentile Rapaki CES boulders are slightly larger compared with Purau CES boulders, while the maxi-mum and mean boulder size categories are higher at Purau (Table 1). Although differences are evident, the overall size distributions are comparable (Table 1).
The volume for pre-CES and CES VB boulders is signif-icantly larger than the corresponding CL boulders at Rapaki (Fig. 8e, Table 2) and Purau (Fig. 8f, Table 2). At Rapaki, pre-CES VB boulders display higher volumes (compared with CES VB boulders) in each of the size categories, particularly for median and maximum boulder sizes (Table 2). Pre-CES CL boulders display consistently higher values for each of the size categories with the exception of the 75th percentile (Fig. 8e, Table 2). At Purau, CES VB and CL boulders ex-hibit a smaller distribution of boulder sizes compared with their pre-CES equivalents (see Fig. 8f). Pre-CES VB and CL boulders are higher in each of the size categories (Ta-ble 2, Fig. 8f), with the exception of the median boulder size, where the CES CL median boulder volume is slightly more than the pre-CES CL value (Table 2). It is notable that the highest percent (%) variance in boulder volume between pre-CES and pre-CES boulders is recorded for the Purau VB boulders (Table 2); the only exception is for maximum boulder size, where the percent (%) difference between Purau CL pre-CES and CES boulders is even greater (Table 2).
Figure 5. (a) Volcanic source rock at Rapaki study site. Sixty individual detachment zones were created during the CES (yellow) and represent∼9 % of the total source rock area. The source rock is comprised of∼86 % VB and∼14 % CL. Approximately∼69 % and
∼31 % of the detachments occurred within the VB and CL lithologies, respectively.(b)Photo showing several irregularly shaped CES detachment zones near the top of Mount Rapaki.(c)Photo showing freshly exposed VB and CL layering within the Rapaki source rock.
(d)Portion of volcanic source rock at Purau showing VB and CL layering. A single CES detachment site is shown at the top of the source rock. Seven individual CES detachment sites were identified at the Purau study site.(e)CL and VB layers at the Purau study site. Note the thickness of the CL layer (∼5–7 m) and lack of any CES detachment sites despite the high degree of fracturing and overhanging condition.
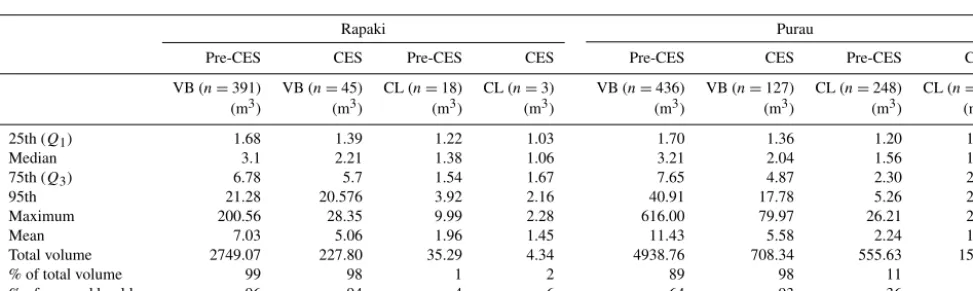
Table 1.Volumetric comparison of pre-CES and CES rockfall boulders (for volume≥1.0 m3) at Rapaki and Purau study sites.
Rapaki pre-CES Rapaki CES Difference Difference Purau pre-CES Purau CES Difference Difference (n=409) (n=48) (m3) (%) (n=684) (n=136) (m3) (%)
(m3) (m3) (m3) (m3)
25th (Q1) 1.60 1.36 0.24 17.65 1.42 1.34 0.08 5.97
Median 2.94 2.21 0.73 33.03 2.20 2.01 0.19 9.45 75th (Q3) 6.59 4.83 1.76 36.44 5.08 4.46 0.62 13.90
95th 20.54 19.76 0.78 3.95 27.06 17.66 9.4 53.23 Maximum 200.56 28.35 172.21 607.44 616.00 79.97 536.03 670.29 Mean 6.81 4.84 1.97 40.70 8.10 5.32 2.78 52.26
Table 2.Comparison of boulder size statistics for Rapaki and Purau VB and CL pre-CES and CES rockfall boulders (volume≥1.0 m3).
Rapaki Purau
Pre-CES CES Pre-CES CES Pre-CES CES Pre-CES CES
VB (n=391) VB (n=45) CL (n=18) CL (n=3) VB (n=436) VB (n=127) CL (n=248) CL (n=9)
(m3) (m3) (m3) (m3) (m3) (m3) (m3) (m3)
25th (Q1) 1.68 1.39 1.22 1.03 1.70 1.36 1.20 1.13
Median 3.1 2.21 1.38 1.06 3.21 2.04 1.56 1.68
75th (Q3) 6.78 5.7 1.54 1.67 7.65 4.87 2.30 2.14
95th 21.28 20.576 3.92 2.16 40.91 17.78 5.26 2.48
Maximum 200.56 28.35 9.99 2.28 616.00 79.97 26.21 2.64
Mean 7.03 5.06 1.96 1.45 11.43 5.58 2.24 1.67
Total volume 2749.07 227.80 35.29 4.34 4938.76 708.34 555.63 15.00
% of total volume 99 98 1 2 89 98 11 2
% of mapped boulders 96 94 4 6 64 93 36 7
The calculation of VB and CL boulder percentages at Rapaki for pre-CES and CES rockfalls indicates that VB boulders comprise≥98 % by volume and ≥94 % by fre-quency (n) for all Rapaki conditions, while at Purau the corresponding percentages are ≥90 % (volume) and ≥ 64 % (frequency), respectively (Table 3b). All of the low-est VB percentages exist at the Purau study location (see Ta-ble 3b, individual domain data).
4.5 Boulder runout distance
The frequency–runout distance distribution for pre-CES boulders at Rapaki can be characterized by power and ex-ponential laws (Fig. 9b), with the number of rockfall boul-ders with long runout distances decreasing dramatically with increasing distance from the volcanic source rock. The expo-nential regression is best fit to the entire data set (including extrapolated boulders within 100 m of source rock), while the power law displays the strongest fit for the mapped rock-fall boulders (Fig. 9b). CES rockrock-falls display a poor expo-nential fit and do not indicate a similar inverse relationship between boulder frequency and runout distance (Fig. 9b). The frequency–runout distribution for CES rockfalls indi-cates that the number of boulders remains more or less con-sistent regardless of distance from the source rock. Using the shadow angle method, we plot travel distance on the talus
slope (Lt) versus height on the talus slope (Ht) with a fitted
polynomial regression line (Fig. 9c). The correlation coef-ficient is 0.9699 for CES rockfalls and 0.9717 for pre-CES rockfalls (Fig. 9c). The minimum shadow angle for pre-CES is 25◦, while the minimum shadow angle (for the furthest traveled CES rockfall boulders) is 23◦. At Rapaki, the max-imum runout distance for pre-CES and CES VB boulders exceeds the furthest travel distances for pre-CES and CES CL boulders, respectively (Table 4). The CES VB boulders exceed pre-CES VB runout by∼165 m and CES CL boul-ders exceed CL pre-CES runout by∼138 m (Fig. 2a and b; Table 4).
At Purau, Lt versus Ht is plotted for four separate
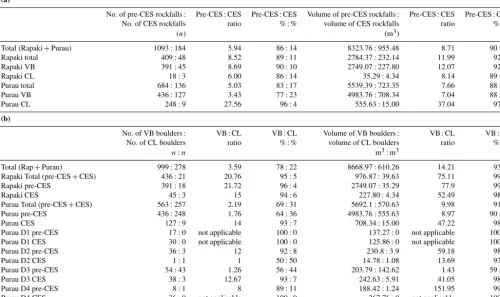
Table 3. (a)Comparison of frequency (n) and volume (m3) ratios for pre-CES and CES rockfall boulders at the Rapaki and Purau study sites.(b)Comparison of VB/CL frequency (n) and volume (m3) ratios for pre-CES and CES rockfall boulders at the Rapaki and Purau study sites.
(a)
No. of pre-CES rockfalls: Pre-CES:CES Pre-CES:CES Volume of pre-CES rockfalls: Pre-CES:CES Pre-CES:CES
No. of CES rockfalls ratio %:% volume of CES rockfalls ratio %:%
(n) (m3)
Total (Rapaki+Purau) 1093:184 5.94 86:14 8323.76:955.48 8.71 90:10
Rapaki total 409:48 8.52 89:11 2784.37:232.14 11.99 92:8
Rapaki VB 391:45 8.69 90:10 2749.07:227.80 12.07 92:8
Rapaki CL 18:3 6.00 86:14 35.29:4.34 8.14 89:11
Purau total 684:136 5.03 83:17 5539.39:723.35 7.66 88:12
Purau VB 436:127 3.43 77:23 4983.76:708.34 7.04 88:12
Purau CL 248:9 27.56 96:4 555.63:15.00 37.04 97:3
(b)
No. of VB boulders: VB:CL VB:CL Volume of VB boulders: VB:CL VB:CL
No. of CL boulders ratio %:% volume of CL boulders ratio %:%
n:n m3:m3
Total (Rap+Purau) 999:278 3.59 78:22 8668.97:610.26 14.21 93:7
Rapaki Total (pre-CES+CES) 436:21 20.76 95:5 976.87:39.63 75.11 99:1
Rapaki pre-CES 391:18 21.72 96:4 2749.07:35.29 77.9 99:1
Rapaki CES 45:3 15 94:6 227.80:4.34 52.49 98:2
Purau Total (pre-CES+CES) 563:257 2.19 69:31 5692.1:570.63 9.98 91:9
Purau pre-CES 436:248 1.76 64:36 4983.76:555.63 8.97 90:10
Purau CES 127:9 14 93:7 708.34:15.00 47.22 98:2
Purau D1 pre-CES 17:0 not applicable 100:0 137.27:0 not applicable 100:0
Purau D1 CES 30:0 not applicable 100:0 125.86:0 not applicable 100:0
Purau D2 pre-CES 36:3 12 92:8 230.8:3.9 59.18 98:2
Purau D2 CES 1:1 1 50:50 14.78:1.08 13.69 93:7
Purau D3 pre-CES 54:43 1.26 56:44 203.79:142.62 1.43 59:41
Purau D3 CES 38:3 12.67 93:7 242.63:5.91 41.05 98:2
Purau D4 pre-CES 8:1 8 89:11 188.42:1.24 151.95 99:1
Purau D4 CES 36:0 not applicable 100:0 267.76:0 not applicable 100:0
VB boulders and CES VB rockfall boulders within PD3 (Ta-ble 4).
At Rapaki, no relationship has been obtained plotting indi-vidual boulder volumes and the tangent of the shadow angle (Fig. 9e). A wide range of boulder sizes are evident for the full spectrum of pre-CES and CES rockfall runout distances by means of the shadow angle. The same is largely true at Purau, where correlations for the individual domains (PD1– PD4) are poor and the data have a high degree of scat-ter (i.e., low correlation coefficients); although the data do show a slight negative relationship between block volume andHt/Ltratio value (that is, a slight increase in runout
dis-tance as boulder size increases) (Fig. 9f).
4.6 RAMMS rockfall modeling 4.6.1 RAMMS_1
Final emplacement locations (Q95 %) are generated for
sim-ulated rockfalls released from the seven field-identified CES detachment zones at Purau (labeled CES-1 through CES-7) (Fig. 10a). Observed CES boulder locations are depicted as red circles. RAMMS_1 (bare-earth CES model scenario) is successful in replicating the overall spatial pattern for
de-tached and distributed CES rockfalls at Purau for locations CES-3–7. Below the CES-7 source rock, RAMMS maximum runout distances (∼370 m) are well matched to the maxi-mum travel distance for mapped CES rockfalls (∼357 m). Maximum runout distances for the RAMMS boulders are overestimated at CES-1 and CES-2 (Fig. 10a). We note that only two boulders were released at CES-1 during the CES and were deposited within∼12 m of the source rock. RAMMS_1 effectively captures the lateral dispersion for the mapped CES boulders at CES-2–CES-4, but overestimates this effect within the CES-5 and CES-6 valleys, and slightly underestimates the lateral dispersion of CES rockfalls be-neath CES-7.
4.6.2 RAMMS_2
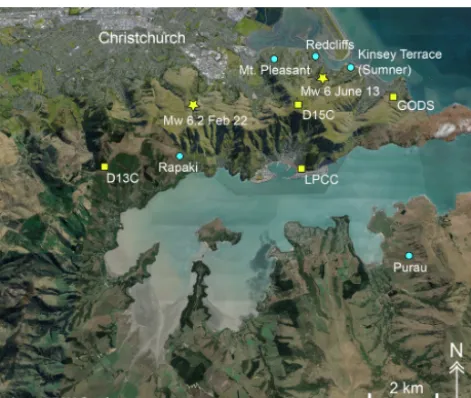
Figure 6. Relative locations of stations LPCC, D13C, D15C, and GODS (yellow squares). Also shown are epicenters of the 22 Febru-ary 2011Mw=6.2 and 13 June 2011Mw=6 earthquakes (yellow stars) along with Rapaki and Purau sites.
runout distance between RAMMS_2 and the mapped pre-CES boulders is ∼75–100 m (see Fig. 10b). An increase in forest density to 10 000 kg s−1, spread uniformly across the study site, produces the best fit to the pre-CES boul-der spatial distributions (in particular, maximum runout dis-tance) (see Fig. 10b, white dashed line). RAMMS_2 success-fully models the lateral dispersion for the mapped pre-CES boulders (with the exception of area CES-7) (Fig. 10b). The RAMMS_2 model scenarios identify pre-CES rockfall boul-ders that have likely experienced post-emplacement mobil-ity (see Fig. 10b). Note the collection of pre-CES boulders within the central drainage canyon that exceeds the limit of simulated RAMMS boulders (Fig. 10b). Field observations confirm that boulder depositional patterns beyond the limits of the final resting locations for RAMMS simulated rockfall boulders are consistent with deposition by debris flow and other transport or deposition processes. This is further high-lighted by the numerous and large pre-CES rafted boulders (maximum volume=20 m3) identified near the Purau coast-line (see Fig. 3). Finally, we observe no mapped pre-CES boulders outside of the valleys that exceed the RAMMS_2 simulated maximum runout distances.
4.6.3 RAMMS_3
RAMMS_3 models the potential future rockfall hazard at Pu-rau and assumes a bare-earth (deforested) hillslope and dry soil moisture conditions to insure a worst-case (conservative)
Table 4.Average and maximum runout distances for pre-CES and CES rockfall boulders (for volume≥1.0 m3) at Rapaki and Purau study sites.
Runout Average Maximum distance (m) (m) (MLR)
Rapaki
Pre-CES 184.30 567.51 CES 276.23 702.47 Pre-CES VB 184.65 567.51 Pre-CES CL 176.57 346.73 CES VB 276.91 702.47 CES CL 266.13 432.14 Purau
PD1 Pre-CES 29.86 96.96 PD1 CES 119.63 348.4 PD2 Pre-CES 84.01 279.75 PD2 CES 14.11 15.91 PD3 Pre-CES 239.62 462.8 PD3 CES 237.24 413.35 PD4 Pre-CES 109.11 208.85 PD4 CES 181.75 304.56 PD1 Pre-CES VB 29.86 96.96 PD1 CES VB 119.63 348.4 PD1 Pre-CES CL not applicable not applicable PD1 CES CL not applicable not applicable PD2 Pre-CES VB 88.73 279.75 PD2 CES VB 12.3 12.3 PD2 Pre-CES CL 27.39 33.38 PD2 CES CL 15.91 15.91 PD3 Pre-CES VB 248.96 434.85 PD3 CES VB 243.21 413.35 PD3 Pre-CES CL 227.89 462.8 PD3 CES CL 161.68 178.53 PD4 Pre-CES VB 106.99 208.85 PD4 CES VB 181.75 304.56 PD4 Pre-CES CL 126.06 126.06 PD4 CES CL not applicable not applicable
MLR : Map length runout and PD1 : Purau Domain 1.
Figure 9. (a)Frequency ratio versus volume ratio for pre-CES and CES rockfall boulders.(b)Frequency–runout distributions for Rapaki pre-CES and CES boulders. Both power law (without extrapolated data) and exponential (all data) fits are shown for the prehistoric boulder data set. A poor exponential fit is shown for CES rockfalls.(c)Plot of travel distance on talus slope (Lt) versus height on talus slope (Ht) with
Figure 10. (a) RAMMS_1 shows deposited rocks for simulated CES boulders. Mapped CES boulders (red circles) are shown for comparison. Boulder densities of 2500 and 3000 kg m−3are used for VB and CL boulders, respectively. (b)Final resting locations for RAMMS_2 rockfalls. RAMMS_2 assumes prehistoric fall conditions (i.e., forested hillslope). Mapped prehistoric rock-falls are depicted (yellow circles) for comparison. An increase in forest density to 10 000 kg s−1 generates the best fit with maxi-mum runout distance (see white dashed line) for mapped prehis-toric boulders. (c) Final resting locations for RAMMS_3 boul-ders. RAMMS_3 assumes modern hillslope conditions (i.e., defor-ested hillslope). Note the increased maximum runout distance for RAMMS_3 boulders compared with RAMMS_2 and the potential future rockfall hazard to development sites S1 and S2. The pro-vided development sites are modified from Eliot Sinclair and Part-ners Ltd. (2013). (All images are modified after Land Information New Zealand, https://data.linz.govt.nz/data/category/aerial-photos, last access: 6 March 2019.)
4.7 Strong ground motion data
High-frequency data show complex velocity and displace-ment paths for any given site. The variations across the sites are significant, as reported previously (Van Houtte et al., 2012; Bradley, 2016). At the same site (LPCC, Fig. 7a and b), particle velocity and motion hodograms show different po-larization characteristics for different earthquakes. Peak ve-locities and displacements recorded at LPCC site are higher for theMw=6.2 than the smaller eventMw=6.0 (Fig. 7a
and b). The observed inter-site and inter-event variations in polarization of peak velocities and displacements can be at-tributed to source radiation pattern (Lee, 2017) and complex wave propagation effects such as scattering. For instance, simulating high-frequency (>1 Hz) 3-D wavefields, Take-mura et al. (2015) showed that near-station irregular topog-raphy amplifies scattering of seismic wavefield, producing long coda and distortions toP wave polarizations. This is not surprising given that Fresnel volume – the region to which a transmitting seismic wave is sensitive – is inversely related to wave frequency (Spetzler and Snieder, 2004), due to which near-station geological conditions modify wave characteris-tics at high frequencies. The control of near-station geology over polarization and amplification characteristics at high frequencies (Bouchon and Barker, 1996) reduces our ability to extrapolate these characteristics to distant sites.
5 Discussion
is a result of CL boulder shapes being dominated by elon-gate and flat morphologies (Fig. 4g–k), which would have more difficulty traveling downslope.
At Purau, discerning the differences in spatial distribu-tion between pre-CES and CES rockfalls is more difficult, primarily due to the topographic forcing of rockfalls into nearby drainage valleys and post-emplacement mobilization (Fig. 3). The CES-7 site location (furthest southern rockfalls) shows a similar pre-CES : CES spatial scenario to Rapaki, with CES boulders traveling significantly further than their pre-CES equivalents (see Fig. 5); a discrepancy which could also be attributed to intervening deforestation on the hills-lope. However, elsewhere at the Purau field site inverse spa-tial scenarios are evident, with pre-CES boulders deposited further from the source rock than their CES counterparts (see Fig. 2a, Table 4). This is primarily observed within drainage valleys where field observations suggest pre-CES boulders have been remobilized (debris flows, floods) and carried fur-ther from the source rock following their initial emplace-ment.
The CES rockfall boulders at both sites represent a sub-set of the larger pre-CES rockfall database, suggesting the preservation of multiple pre-CES rockfall events. The ratio for the number of pre-CES to CES rockfall boulders is higher at Rapaki (∼8.5:1) than Purau (∼5:1) (Table 3, Figs. 2 and 3). One cause of the observed difference may be the higher number of CL boulders with size≥1.0 m3at the Pu-rau study site (Fig. 8e and f). At Rapaki, most of the detach-ment within the CL source rock generated boulder volumes below the 1.0 m3threshold. As a result, the ratio of pre-CES VB:CL boulders is significantly higher at Rapaki (∼22:1) (Table 3b, Fig. 2a) than Purau (∼2:1) (Table 3b, Fig. 3b). This contrasts with the ratio of CES VB:CL boulders at Ra-paki (∼15:1) (Table 3b, Fig. 2b) which shows near equiv-alence to Purau (∼14:1) (Fig. 3c). The CES VB:CL ratio at Purau is more consistent with our field observations where VB predominates in the source rock. Overall, the results in-dicate there is a high degree of variability for lithology and discontinuity spacing (e.g., joints) within the source rock and suggests the cumulative ratio of VB:CL boulders can be sig-nificantly different from that generated locally during a sin-gle rockfall event.
5.2 Boulder morphology and other characteristics The shapes for the VB (Fig. 4a–e) and CL (Fig. 4g–k) boul-ders are primarily controlled by pre-existing discontinuities (primarily joints) in the source rock. We modeled the influ-ence of boulder shape on spatial distribution for the VB and CL lithologies assuming detachment from the CES-7 site (under bare-earth conditions) using RAMMS (Fig. 11). To eliminate the effect of boulder size, a volume of 1.0 m3was assumed for all rockfall boulders. The VB boulders were as-signed a range of equant boulder shapes, while CL boulders were assigned only elongate and flat boulder morphologies.
The model results highlight the differences in boulder spa-tial distribution resulting from differences in boulder shape, with equant (VB) boulder lithologies displaying a signifi-cantly higher relative percentage of longer runout distances (Fig. 11a) compared with the elongate/flat (CL) boulder mor-phologies (Fig. 11b). We recognize that the modeling repre-sents an ideal scenario (i.e., other transition morphologies do exist for the VB and CL boulders) and was conducted primar-ily to provide a sense for the expected spatial patterns assum-ing the distinct VB and CL boulder shapes. Further work is required to verify coherence between field observations and model results.
5.3 Source rock characteristics
The VB and CL percentages in the Rapaki source rock (86 % VB and 14 % CL) are lower than the corresponding VB and CL percentages determined from rockfall frequency and volume for the pre-CES (96 % VB and 4 % CL) and CES (94 % VB and 6 % CL) rockfalls. We attribute the percent differences between source rock and rockfalls to the influ-ence of the larger VB boulder sizes and the lower number of CL rockfalls meeting the≥1.0 m3size threshold. These two factors also explain detachment during the CES, where 69 % of the detachment areas occurred within VB and the remain-ing 31 % within CL (Fig. 5a–c), yieldremain-ing a lower VB:CL ratio of ∼2:1 compared with the corresponding boulder volume and frequency ratios (∼15:1 and∼52:1, respec-tively) (Table 3b).
5.4 Boulder volume
Figure 11. RAMMS simulated rockfall boulders showing differences in spatial distribution between VB (mostly equant shaped) and CL (predominantly elongate and flat shaped) boulder morphologies at Purau. All simulated boulders assume a volume of 1.0 m3.(a) Spa-tial distribution of simulated VB boulders at Purau CES-7 location. Note the high relative percentage of simulated boulders deposited at the base of the hillslope (∼500–600 m from source rock).(b)Spatial distribution of simulated CL boulders at CES-7 location. Note the higher relative percentage of rockfall boulders deposited near the source rock (within ∼100 m from source rock). The simulation highlights the strong influence of boulder shape on runout distance. (All images are modified after Land Information New Zealand, https://data.linz.govt.nz/data/category/aerial-photos, last access: 6 March 2019.)
5.5 Boulder runout distance
The exponential law fit for pre-CES boulders (Fig. 9b, short dashed blue line) highlights the importance of slope and ini-tial impact velocity at the cliff base, which causes more boul-ders to be deposited at greater distances and creates a devia-tion from the power law fit (Fig. 9b, solid blue line). The ex-ponential fit for CES rockfall boulders is poor and indicates there is no discernable correlation between CES boulder fre-quency and runout distance (Fig. 9b, solid red line). Despite the low number of CES boulders (n=48), it is interesting that the CES runout distribution shows such a noticeable de-viation from the pre-CES data set and could reflect the influ-ence of deforestation on runout distance. This would imply that the incremental input of CES and future rockfalls at Ra-paki (emplaced during bare-earth conditions) will modify the overall trend for the cumulative rockfall data set.
At Rapaki, the shadow-angleHt/Ltrelationship is fit best
using a polynomial regression (Fig. 9c). The trend indicates a positive correlation between talus slope height (Ht) and
travel distance on the talus slope (Lt), with a reduction in
the rate of increase as rockfall runout (Lt) increases. At
Pu-rau, CES and pre-CES rockfalls (within individual geomor-phic domains) are modeled using a variety of data functions (e.g., linear, log, and polynomial), suggesting intra-site ge-omorphic and geologic factors affecting rockfall hazard are spatially variable (Fig. 9d). We note that Copons et al. (2009) reports linear regression lines for historical rockfalls in the Central Pyrenees using the shadow-angle method, and lo-cally Massey et al. (2014) also show linear regression fits using the shadow-angle method for CES rockfalls in the Port
Hills of southern Christchurch. Our data indicate that non-linear regression functions (for the shadow-angle method) are more successful in capturing theHt/Lt relationship as
distance from the source rock increases. At both sites, a wide range of boulder sizes exist for the full spectrum of pre-CES and CESHt/Lt ratios, suggesting that boulder size is not a
primary driver for runout distance at the study sites; although it is possible that smaller boulders (e.g.,∼1–2 m3) exhibit-ing long runout distances (i.e., lowHt/Lt ratios) may
rep-resent smaller rock fragments detached from larger boulders during transport and eventual emplacement on the hillslopes and within valleys.
5.6 RAMMS rockfall modeling 5.6.1 RAMMS_1
drainage valleys. Further, a more refined understanding of the influence that substrate soil moisture content has on rock-fall runout is required (Vick et al., 2019). We note that the DEM used for our study has a resolution of 4 m and may not adequately simulate the smaller scale surface roughness (e.g., clustering of boulders below this size threshold) ob-served during our field studies (Fig. 12a–g).
5.6.2 RAMMS_2
The best RAMMS_2 model fit occurs when the forest den-sity is increased (to 10 000 kg s−1) and applied uniformly across the Purau hillslopes (see Fig. 10b, white dashed line). This represents an increase compared with the forest den-sity used at Rapaki (i.e., 3000 kg s−1for moderate vegetation (interfluves), 6000 kg s−1for dense vegetation (valleys) (see Borella et al., 2016a) and implies that vegetation may have been denser on the northwest-facing Purau hillslopes com-pared with the south-southeast-facing Rapaki hillslope.
We note the difference between maximum runout distance for RAMMS and empirical pre-CES boulders at the CES-7 site (Fig. 10b). Several possible explanations exist includ-ing the followinclud-ing: (1) pre-CES boulders were in fact de-posited further from the source rock and were subsequently buried by loess and hillslope colluvium; (2) RAMMS un-derestimates the effect of hillslope vegetation at Purau dur-ing prehistoric times; (3) durdur-ing pre-CES times less of the source rock was exposed (due to burial) and therefore the vol-canic rock was less susceptible to detachment during shak-ing; and/or (4) during pre-CES shaking events the direction of strong ground motion was not favorable to rockfall de-tachment. Scenario 1 is possible but would need to be con-firmed through subsurface trenching or ground penetrating radar (GPR) methods. Tunnel gulley erosion has exposed sections of the subsurface on the CES-7 hillslope and no buried boulders are evident. Scenario 2 is probable based on our observations of forested hillslopes elsewhere in the Port Hills and greater Banks Peninsula area. It is common for dense native vegetation to grow up to, and in some cases, onto portions of the volcanic source rock. In these cases, a high volume of detached rockfalls are stopped adjacent to the source rock and never generate the required momentum to runout an appreciable distance. Scenario 3 is also a possi-bility and requires that the CES-7 source rock was partially buried during emplacement of the pre-CES rockfalls. The last phase of hillslope aggradation would have occurred during the last glacial maximum (∼18–24 ka) and possibly up to ∼12–13 ka (see Borella et al., 2016b). We assume the Purau hillslopes have been net erosional (i.e., downwasting) since the early Holocene; a condition that would have been sig-nificantly accelerated after deforestation in the Purau area. Scenario 4 is a final possibility but would require that the ∼north facing PD1 source rock is oriented in such a way that strong ground motions from multiple prehistoric shak-ing events were unable to create rockfall detachment to the
degree evident in the CES (see Sect. 5.7 for more discussion on strong ground motions).
RAMMS_2 model scenarios effectively identify pre-CES rockfall boulders that have likely experienced post-emplacement mobility (Fig. 10b). This is shown by the collection of pre-CES boulders within the central drainage canyon that exceed the limit of simulated RAMMS boulders (Fig. 10b), indicating a transport mechanism other than rock-fall. This result has implications for rockfall hazard studies because boulder locations not reflective of cliff detachment and subsequent downslope displacement by bouncing, slid-ing, and rolling (that is, rockfall) should be excluded from any data set before assessing the potential rockfall hazard and associated risk. Furthermore, paleoseismic studies attempt-ing to determine the timattempt-ing and recurrence interval of prehis-toric rockfall events should avoid using boulders with com-plex post-emplacement mobility histories.
The absence of any pre-CES boulders exceeding the RAMMS_2 maximum runout distance (with the exception of rockfalls within valleys) (Fig. 10b) implies that the mapped pre-existing boulders were deposited prior to deforestation of the Purau hillslopes and are prehistoric (i.e., deposited prior to European arrival) in age. This result is consistent with prehistoric boulder ages determined at the Rapaki study site where the youngest emplacement ages for pre-CES boul-ders are∼2–6 ka (Mackey and Quigley, 2014; Borella et al., 2016b).
5.6.3 RAMMS_3
RAMMS_3 highlights the increased spatial extent (including maximum runout distance) of rockfalls that could result from more widespread detachment within the Purau source rock, particularly for detachment sites overlying hillslopes where boulder trajectories are not as strongly influenced (i.e., cap-tured) by nearby valleys. Although we caution against using RAMMS_3 as a rockfall hazard map, the model results do provide a first-order indicator of low-lying areas that are most susceptible to future rockfall hazard and suggest that devel-opment at the S1 and S2 sites could be adversely impacted by future rockfall events (Fig. 10c). Assuming terrain character-istics remain similar, sites 3–5 are unlikely to be impacted by rockfall boulders in the future, although additional map-ping and related structural studies of the volcanic source rock is required to determine the most vulnerable rockfall source areas.
5.7 Interpretations of strong ground motion data Preceding studies provide some insight into possible strong ground motion characteristics at Rapaki and Purau during theMw=6.0 and 6.2 earthquakes. The study by Kaiser et
Pleas-Figure 12.CES and pre-CES rockfall boulders within drainage valleys at Rapaki(a, c)and Purau(b, d–f)study locations. Drainage valleys contain a high amount of pre-CES rockfall boulders, which impacts the trajectory or path of CES rockfalls and reduces or stops runout distance.
ant (henceforth Ksites), all of which are north-facing slopes in the Port Hills. They found that both morphological fea-tures as well as properties of the wave propagation me-dia control frequency-dependent amplification. Significant ground motion amplification was observed at 1–3 Hz fre-quency range on top of narrow, steep-sided ridges. At these low frequencies (f), seismic wavelengths (λ) are compara-ble to ridge width of Ksites. Therefore, seismic waves in the 1–3 Hz frequency band appear to excite natural resonance (or natural frequency;fn), optimizing ground motion.
It is interesting to evaluate the implications of the low-frequency observations of Kaiser et al. (2014) to the Ra-paki and Purau rockfall sites. Both these sites are located at higher elevations than Ksites. Thus, their ridge width (∼400–500 m) is somewhat less than that at Ksites (∼600– 1000 m). Using this information, we estimatefnto be<5 Hz
(see Supplement).
Whether ground motion withfnwas excited at these sites
depends on the amount of energy carried by seismic waves in that frequency band. This information is contained in the
morphologi-Figure 13.Velocity spectra for the 13 June 2011Mw=6
earth-quake recorded at station D13C. No path corrections are applied.
cal features including elevation makes D13C a desirable sta-tion to understand ground mosta-tion at Purau.
We computed velocity spectra of east and north compo-nents of the station D13C (Fig. 13) to qualitatively assess seismic energy transmission through our rockfall sites. We find that the transition from the flat spectrum to a rapid fall off occurs at ∼3–4 Hz. This means that the 13 June 2011 Mw=6 earthquake carried most of its energy at
frequen-cies less than ∼3–4 Hz. Together with our estimates offn
(<5 Hz), we can thus infer that the passage of seismic waves excited natural resonance at the Rapaki and Purau sites. The combined effects of natural resonance and wave focusing to-wards the ridge crest (Hartzell et al., 1994; Bouchon and Barker, 1996) in these hard rock sites have the potential to optimize shaking, promoting rockfalls.
It is interesting to note, however, that D13C recorded the lowest peak velocities (223 and 178 mm s−1) and
displace-ments (38 and 74 mm) of the four stations considered here (Fig. 7c). Out of these stations, it is also the only station that recorded no acceleration above 0.3 g on any component. These features of the wavefield are not surprising because distance from D13C to epicenter of theMw=6 earthquake
is twice (∼9 km) as large as that from the other stations (∼4.5 km). For this reason, it is likely that other possible ef-fects (e.g., rock mass weakening by prior CES earthquakes), in addition to strong ground motions from theMw=6
earth-quake, were responsible for triggering major rockfalls at the study sites. Unfortunately, the D13C station was not in opera-tion at the time of these previous larger earthquakes to assess severity of ground motion. Nonetheless, records from sta-tions closest to D13C indicate that those sites have exceeded the 0.3 g peak ground acceleration (PGA) threshold impor-tant for engineering considerations. For instance, LPCC sta-tion located∼6 km from D13C recorded 0.3 and 0.9 g PGA following the Mw=7.1 andMw=6.2 events respectively
(Bradley and Cubrinovski, 2011). Moreover, extrapolation of PGA contours of Bradley (2012) suggests that D13C and Rapaki sites experienced PGAs exceeding 0.25 and 0.45 g during Mw=7.1 and Mw=6.2 earthquakes respectively.
Some of the rockfall sites investigated herein might have had
reached a critical failure threshold prior to being triggered by the 13 June 2011Mw=6 earthquake.
Particle velocity and motion hodograms (Fig. 7a–e) also carry directional information of particle behavior in addi-tion to intensity. Past studies show that seismic wave po-larizations are amplified in directions perpendicular to frac-ture surfaces, weakening the coherence between outer blocks of rock with bedrock during the passage of a seismic wave (Kleinbrod et al., 2017; Burjánek et al., 2018). If blocks of rock are primed for failure by previous events, this effect can produce rockfalls in earthquakes as small as local mag-nitude 4.0 (Keefer, 1984). The velocity hodogram of D13C exhibits a strong ENE–WSW component. Note that this di-rection makes roughly∼30 to∼60◦angle with rock faces at PD2–PD4, and RAP sites (Fig. 7c). Thus, it is reasonable to assume that particle velocities in this dominant direction are favorable for triggering rockfalls particularly if the rock faces were primed for failure. The angle between this domi-nant velocity component and the rock face at PD1 site, how-ever, appears to be less than∼20◦and possibly is not as fa-vorable for triggering rockfalls as for other sites. On the other hand, the particle motion hodogram has two dominant direc-tions: WNW and WSW. Depending on the strike of the rock face, either one of these directions can orient particle motion favorably for rockfalls. For instance, site RAP has a rock face strike of 25◦, which is sub-parallel to the WSW particle mo-tion direcmo-tion. However, the WNW particle momo-tion direcmo-tion makes a steep angle with the rock face and thus can promote rockfalls. Combining information from particle velocity and motion hodograms, we hypothesize that directional aspects were favorable to rockfall triggering at the Rapaki and Purau sites.
rockfalls because the rockfalls have been remobilized after their initial emplacement.
Prior to the CES, rockfall hazard was not considered a ma-jor risk in Banks Peninsula and surrounding areas (Townsend and Rosser, 2012), including the Port Hills of southern Christchurch, where damage was most critical and five fatal-ities occurred (Massey et al., 2014). To date, we are aware of only four studies that have dated pre-CES rockfalls in Banks Peninsula (Mackey and Quigley, 2014; Borella et al., 2016b; Sohbati et al., 2016; Litchfield et al., 2016), and all of these investigations were undertaken after the CES. We assume this was primarily because there were few records of his-torical rockfall occurrence, and of those described (Lundy, 1995), none hinted at the potential for future widespread cliff collapse and rockfall in the region. However, the ge-ologic record (i.e., prehistoric rockfalls) provides evidence that rockfall events of similar magnitude (or greater) have occurred in the past. In regions devoid of historical or con-temporary rockfalls, pre-existing rockfalls represent the only empirical proxy for evaluating local rockfall behavior and provide valuable input for rockfall modeling and risk assess-ment studies. Existing rockfalls provide important data for predicting rockfall volumetric, lithologic, and morphologic (i.e., boulder shape) characteristics, but a thorough consider-ation of landscape evolutionary chronologies (including de-forestation) and post-emplacement mobility scenarios is re-quired before pre-existing rockfalls can be confidently used as future spatial indicators.
6 Conclusions
The spatial distributions and physical–geological properties of individual (n=1093) rockfall boulders deposited at two sites in Banks Peninsula prior to the 2010–2011 Canter-bury earthquake sequence (CES) are compared to boulders (n=185) deposited during the CES. Pre-CES to CES boul-der ratios range between∼5:1 and 8.5:1 respectively, sug-gesting preservation of multiple pre-CES rockfall events with a flux analogous to or smaller than CES events, and/or pre-CES event(s) of larger flux. Pre-pre-CES and pre-CES boulders at one site (Purau site) have statistically consistent power law frequency–volume distributions between 1.0 to>100.0 m3. At the Rapaki site, CES boulders have smaller and more clustered volumetric distributions that are less well fit by power laws compared with the pre-CES data, interpreted to reflect variations in rockfall source characteristics through time. Boulders of volcanic breccia (VB) have a larger binned-percentage of large volume boulders and more equant boul-der aspects relative to coherent lava (CL) boulboul-der lithologies at both sites, revealing lithologic controls on rockfall phys-ical properties. The maximum runout distances for Rapaki CES VB and CL boulders are greater than that of pre-CES boulders of equivalent lithologies, volumes, and morpholo-gies. This is interpreted as an effect of anthropogenic
defor-estation on the hosting hillslope, which enabled CES boul-ders to travel further than their pre-CES counterparts due to reduced resistance from vegetation. At Purau, isolated geo-morphic domains exhibit this same effect, however in other intra-site locations, pre-CES boulder locations exceed runout distances of CES boulders. This is interpreted to reflect post-depositional mobility of prehistoric boulders via debris flows and other surface processes, reduction of CES boul-der runouts in channels due to collisional impedance from pre-CES boulders, and heterogeneity in the CES boulder dis-tributions, which reduced the likelihood of large runout boul-ders occurring due to smaller volumetric fluxes. The shadow angle method is a reliable predictor for pre-CES and CES rockfall runout at both sites. At Rapaki, the pre-CES and CES rockfall data are best fit using a 2nd order polyno-mial regression, while at Purau rockfalls require a variety of data fits (e.g., linear, log, and polynomial), suggesting intra-site geomorphic and geologic factors affecting rockfall hazard are spatially variable. Bare-earth and forested numer-ical modeling suggest that the majority of pre-CES rock-falls were emplaced before deforestation of the Purau hill-slopes and enable identification of boulder sub-populations that have likely experienced post-emplacement mobility. The RAMMS_3 model effectively shows the potential spatial ex-tent of rockfalls that could result from more widespread de-tachment within the Purau source rock and provides a pre-liminary indicator of low-lying areas most susceptible to fu-ture rockfall hazard. More in-depth rockfall hazard analy-ses (including numerical rockfall modeling) are required at Purau and should consider the implementation of boulder morphologies, terrain parameters, and hillslope vegetation attributes developed in this study. Our research highlights the challenges of using rockfall distributions to characterize future rockfall hazards in the context of geologic and geo-morphic variations, including natural and anthropogenically influenced landscape changes.
Appendix A
Table A1.Friction parameters chosen for each terrain type in RAMMS.
µmin µmax ε Drag layer β κ
coefficient
Volcanic rock 0.7 2.0 0 0.3 50 0.5 Loess and volcanic colluvium 0.45 2.0 0 0.5 30 0.6 Loess 0.3 2.0 0 0.5 30 0.5 Valley terrain 0.2 2.0 0 0.9 25 0.5
Figure A2.Conceptual diagram of hillslope illustrating the source rock cliff and the talus slope. The reach angle(a)and shadow angle(b)
are shown. Sketch modified from Evans and Hungr (1993), Wieczorek et al. (2008), and Copons et al. (2009).