Available online:
https://edupediapublications.org/journals/index.php/IJR/
P a g e | 7 7 4The Optical System Controller MPPT Improved Under
Conditions of Partial Shade
1.
P. VENKATESH, 2.
D. CHANDRA SEKHAR
1PG Scholar, Department Of EEE,Sri Sai Educational Society's Group of Institutions, Kodad.
2Assistant Professor, , Department Of EEE,Sri Sai Educational Society's Group of Institutions, Kodad.
Abstract
There exists a variety of maximum power point tracking (MPPT) techniques, each having its own merits and demerits. Under partial- shading conditions, the conventional tracking techniques fail to guarantee successful tracking of the global maximum power, ie the conventional MPPT methods such as perturb and observe and incremental conductance may converge on local maximum power point resulting in significant reduction of power generated. This paper discusses about an improved technique for tracking global maximum power point of photovoltaic arrays that has better performance under partial shading conditions. The first stage in this method is to find out global maximum power point among the local maxima. Once the global maximum power point is found then by adjusting the duty ratio, the voltage corresponding to maximum power can be found out. The control is then transferred to perturb and observe algorithm stage. This technique could be applied for both stand alone and grid connected PV system. A comparison study between a SEPIC converter and a buck boost converter with the above mentioned algorithm has also been carried out in order to verify the performance of both the converters. The above mentioned converters have been designed for 150W at a switching frequency of 10 KHz. Modified algorithm has been simulated using MATLAB/Simulink and results are obtained. Partial shading condition was modelled in MATLAB/Simscape and analysed the solar array characteristics under various shading conditions. From the simulation results it was found that the SEPIC converter is much more efficient and is highly suitable for photo voltaic applications.
Key Words: Partial shading, DC-DC converters, Global maximum power point, SEPIC converter.
1.
INTRODUCTION
The demand for energy is increasing day by day with the growth of world population. However, the natural energy resources don’t grow with time instead gets depleted due to over usage. This has lead to a hike in energy cost and an increase in the emission of greenhouse gases. Solar energy has been identified as the most abundant resource of future energy and is becoming a strong competent to fossil fuel. Recent advancements in photovoltaic (PV) technology made access to solar energy more economical [1] than in the past. The future of Indian energy sector is expected to be dominated by solar energy.
Photovoltaic cells when connected together form a panel and a number of panels contribute to form a solar array. The PV array consists of a number of panels connected in series and parallel topologies. With varying levels of irradiation during the day, the array output can vary in a wide range. This effect is expected. But unexpected shading effects due to dusts, clouds, leafs, branches of trees and buildings causing shading on cells or part of modules or panels. Under these partial shading conditions, the Power versus voltage characteristics of the solar array will contain one global maximum along with many local maxima. The global maxima correspond to maximum power while the others correspond to much lower powers [2]. Around 30% power loss will take place even
though only one cell in the PV module is shaded. As the number of shaded cells increases, the amount of power loss also will be increases (nearly 80%). Under partial shading conditions, conventional MPPT methods may not be able to track maximum power irrespective of the change in irradiance conditions. At the local maximum power point it may converge resulting in reduction of PV panel output. Due to this reason the overall PV system efficiency gets degraded [3]-[4]. An efficient MPPT system which can be used even under partial shading conditions efficiently is discussed in this paper.
Organization of this paper is as follows: a description about the MPPT system is given in Section II, SEPIC converter characteristics is dealt in section III, section IV presents the implementation of partial shading effect, Global MPPT is described in section V and simulation results are presented in section VI.
2.
SYSTEM DESCRIPTION
Basic block diagram of photovoltaic maximum power point tracking system implemented using SEPIC converter is shown in Fig.1. System load is supplied from solar panel with the
help of SEPIC converter. The array voltage VPV and current
IPV is sensed by suitable sensors and is given as input to the
T
panel to operate at the maximum power point of the P-V curve. Load impedance is adjusted by changing the duty ratio of the converter which is connected as an interface between the panel and the load.
In this work, SEPIC serves as the dc-dc converter and its duty ratio is adjusted to track maximum power transfer from PV array to the load.
Fig .-1: General block diagram of an MPPT system
Under partial shading conditions multiple local maxima will appear on the power-voltage characteristics of solar PV system in that only one will be global maximum power point. The above mentioned situation is shown in the power-voltage curve of partially shaded array in Fig.2. The conventional MPPT methods converge at local maximum power points and the efficiency of the solar PV system reduces considerably.
The above mentioned MPPT system can be applied to either grid connected solar PV applications or standalone applications. Here Single Ended Primary Inductor (SEPIC) converter is used as DC-DC power converter so that the output voltage can be made constant irrespective of the input voltage variations.
The global MPPT technique used here is performed in three consecutive steps,
a) Constant input power mode
b) PV array voltage regulation
c) Perturb and observe (P&O) stage
The switch is controlled by either PWM1 or PWM2 control
signals provided from the MPPT controller. This aspect is explained in the following section.
3.
SEPIC CONVERTER
Since the SEPIC converter is a modified form of an ordinary buck-boost converter, it has some advantages [5]-[6] over conventional buck boost converters. The circuit diagram of single-ended primary inductance converter as shown in Fig.3
L1
Vs
Fig -3: Circuit diagram of SEPIC-converter
The output of a SEPIC converter is non-inverting but the output of a buck boost converter is inverting. In this SEPIC converter, MPP tracking is much easier because the amount of input current ripple present is non-pulsating. Since the switch present in SEPIC converter is directly connected to ground only low side driving is required which is easier than high side driving used in buck-boost converter. Additionally, the SEPIC converter is highly efficient compared to buck-boost converter.
The voltage gain of a SEPIC converter is given by,
V
D
V
o
D
t
on1
D
pv (1)Where is the duty ratio of the converter switch, Vo is
s
Fig -2: Power vs Voltage for a partially shaded PV array the output voltage of the converter and Vpv is the input voltage
which is fed from the solar array. The control signal of PWM1 is produced by comparing the panel current Ipv with a control
C1
Available online:
https://edupediapublications.org/journals/index.php/IJR/
P a g e | 7 7 6signal, which is a sawtooth wave derived from the basic equations of SEPIC converter.
For stand-alone applications, the output voltage Vo has to be
constant even if it is connected to the grid or to the battery bank. For stand-alone battery charging application [7]-[8], the SEPIC converter acts in buck mode for reducing the panel voltage to constant value. But for grid interface, the SEPIC converter has to work in the boost mode. The input power of the converter can be controlled by varying the amplitude of the control signal and it is called constant input power mode operation.
4.
IMPLEMENTATION OF PARTIAL SHADING
EFFECT
A Solar panel has been simulated in MATLAB/Simscape and is discussed in this section. Twenty solar cells are connected in series to form a string which acts as a module. Each cell
having an open circuit voltage Voc= 0.9 V and short circuit
current Isc = 0.63 A. The combination of such modules forms a
solar panel. A number of panels interconnected forms solar
array, of maximu m power 39.2 W at Vm = 65.6 V and Im=0.59
A. In order to create partial shading effect using Simulink, a diode is connected in antiparallel to each cell. This is done to avoid avalanche breakdown which would create hot spots on the solar cell which may lead to the damage of entire solar cell.
At a standard irradiance condition of 1000W/m2 the solar cell
produces rated power which can be observed from volt-current and volt-power characteristics. Fig.4 shows the solar cell modeling for partial shading conditions.
Fig -4: Modeling of solar cell for partial shading condition
The irradiance value can be changed manually and the corresponding variation in irradiance can be seen. As the
irradiance value decreases from 1000W/m2the panel voltage
and current also reduces considerably which further results in the reduction of panel power output. In order to overcome this condition, modified maximum power point tracking method as explained in this paper can be used to track available maximum power from the panel. Fig.5 shows the Simulink model of the solar panel under partial shading conditions.
Fig -5: Simscape model of solar panel
Fig.6 shows the Power - Voltage characteristics under normal
irradiation conditions (1000W/ m2) without partial shading.
The magnitude of voltage (VM) corresponding to maximum
power (PM) is also shown.
Fig -6: Power-voltage curve under 1000 W/m2
The Current-Voltage characteristics of the designed panel are
shown in Fig.7 at 1000W/m2. Current and voltage magnitudes
corresponding to maximum power is represented as IM and
Fig - 7: Current-voltage curve under 1000 W/m2
The Power-Voltage characteristics of the designed solar panel under Partial shading condition created using Simulink is shown in Fig.8.
Fig -8: Power-voltage curve under partial shading condition
Positions of global and local maximum power points are marked in the figure. Similarly current voltage characteristics of panel under partially shaded condition are shown in Fig.9 with global and local maximum power points marked in it.
Fig -9: Current-voltage curve under partial shading condition
It can be observed that under partial shading condition, multiple maximum power points has been created. Out of these maximum power points only one will be global maximum power point and the remaining power points will be local maximum power points.
5.
GLOBAL MAXIMUM POWER POINT
TRACKING
The maximum power point tracking method under partial shading condition [9] is explained in this section.Fig.10 shows the flowchart of the global maximum power point tracking algorithm. The entire logic can be divided in to two parts
a) Global search algorithm
b) Local search algorithm
Initially the global tracking process is performed and the voltage magnitude corresponding to each maximum power point is identified. There will be one global maximum power point among the local maximum power points. The value of voltage magnitude corresponding to maximum power is stored in microcontroller memory. The control algorithm adjusts the duty cycle to adjust the converter input impedance to make it operate at global maximum power point. Once the global maximum power point has been reached then the control is moved from global loop and enters to local loop.
The local loop contains some ordinary MPP tracking method such as Perturb & Observe, Incremental Conductance etc. The
SEPIC converter is switched by using either PWM1 or PWM2.
PWM1 signal is generated with the help of global tracking
Available online:
https://edupediapublications.org/journals/index.php/IJR/
P a g e | 7 7 8L o cal M P P {P & O / IC}
Initia liz a tio n o f Global MP P T
p ro gram variab les
P old = 0
Dn ew = 0 .1
Measure Vnew , Inew
Voltag e regulatio n
Dn ew = Dold - d D
Mea su r e Vnew
P n ew < P o ld
Vn ew< Vmax
Adju st the amp letu d e o f co n tro l signal till
GM P P reach ed T imer
interru p t YES
START
NO dP>0 YES
V(K)-V(K-1)
>0 V(K)-V(K-1) <0
Decrease array
voltage Increase array voltage Decrease array voltage Increase array voltage
Update history
difference are in the negative direction then there is a increase in the array voltage.
Fig -11: Flowchart of the P & O algorithm
6.
SIMULATION RESULTS
The SEPIC converter has been selected for this MPPT
converter. Simulation was perfo rm ed using
Fig -10: Flowchart of the GMPPT algorithm
Perturb and observe is the most common MPPT method. It is simple and easy to develop; only a few parameters are required for calculation. Once the global maximum power point has been found out then the control is locate to P & O loop and the tracking is done around global maximum power point.
According to Perturb and Observe algorithm [10] due to a perturbation in output voltage by a small increment, if the resulting changes in power ΔP is positive, then we can move in the direction of MPP and we keep on perturbing in the same direction. If the value ΔP is negative, we are going away from the direction of MPP and the sign of perturbation supplied has to be changed. The P&O algorithm operates by periodically perturbing the operating voltage and comparing it with the previous instant. If the power difference ΔP and the voltage difference ΔV, both in the positive direction then there is an
increase in the array voltage. If either the voltage difference or the power difference is in the negative direction then there is a decrease in the array voltage. If both the voltage and power was performed with the help of SEPIC and Buck-Boost converter. Both the converters has been designed for 150 W and 20 % inductor current ripple. Global MPPT technique was employed here. Simulation diagrams of SEPIC and Buck- Boost converter supplied from solar panel is shown in Fig.12 and Fig.13 respectively
Fig -12: Simulink model of the MPPT controller using SEPIC P(K)=V(K)*I(K)
Vm ax = Vold
C alc ulate Po wer P new = Vnew * Inew
NO
NO
Y
E
S
Y
E
S
N
O
N
O
Y
E
S
N
O
Fig -13: Simulink model of the MPPT controller using Buck- Boost converter
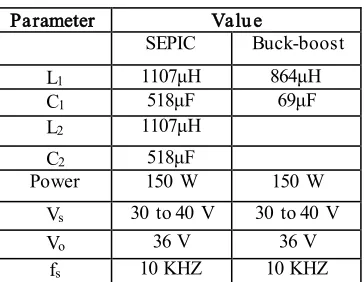
Design parameters and ratings of the SEPIC and Buck-Boost converter is as per table 1.
Table I: Converter Parameters
Parameter Valu e
SEPIC Buck-boost
L1 1107μH 864μH
C1 518μF 69μF
L2 1107μH
C2 518μF
Power 150 W 150 W
Vs 30 to 40 V 30 to 40 V
Vo 36 V 36 V
fs 10 KHZ 10 KHZ
From the simulation results first difference which was observed is in the output voltage of the converters. Buck- Boost Converter produces an inverted output voltage while the SEPIC has non inverted output. The output voltage waveforms of both converters are shown in Fig.14.
Fig -14:Output voltages of SEPIC and Buck-Boost converter
Similarly the converters were also compared for efficiency by
measuring their output power . For 1000 W/m2 irradiance and
25 oC ambient temperature, the output power obtained is
138.5W in the case of a SEPIC converter as shown in Fig.15. Similarly for a buck boost converter, the output power is only 133W. Thus from Fig.15 it is clear that maximum power tracked using SEPIC converter is greater than buck-boost converter. Hence the efficiency of SEPIC converter is higher than buck-boost converter.
Fig -15:Output power of SEPIC and Buck-Boost converter
In Fig.16, different irradiance condition and the corresponding power using MPPT technique is shown. Different irradiance values have also been shown in Fig.16.
Fig -16: Maximum panel power and tracked maximum power under different irradiance conditions at 298 K
Available online:
https://edupediapublications.org/journals/index.php/IJR/
P a g e | 7 8 0The maximum power from the panel and the output power of the SEPIC converter under different irradiance conditions and at a temperature of 350K is shown in Fig.17. From these graphs it can be seen that under varying irradiance condition the maximum power obtained from the panel is also varying. The voltage which gives maximum power point also varies in accordance with change in irradiance. The performance of SEPIC converter is better compared to buck-boost converter and is most suited for photo voltaic applications.
Fig -17: Maximum panel power and tracked maximu m power under different irradiance conditions at 338 K
7.
CONCLUSIONS
Under partial shading conditions and rapidly varying irradiance conditions conventional MPPT methods fail to track real maximum power point. To overcome this situation, an improvement in conventional MPP tracking algorithm is done and integrated with SEPIC converter. The above mentioned MPPT system is able to track the real maximum power point under constant and varying weather conditions. The comparative study with buck-boost converter shows the added advantage of SEPIC converter for photo voltaic applications.
REFERENCES
[1] “Trends in photovoltaic applications. Survey report of selected IEA countries between 1992 and 2006,” Int. Energy Agency Photovoltaic Power Syst.,Paris, France, Tech. Rep. IEA-PVPS T1-16:2007, 2007
[2] H. Patel and V. Agarwal, “Maximum power point tracking scheme for PV systems operating under
partially shaded conditions,” IEEE Trans.
Ind.Electron., vol. 55, no. 4, pp. 1689–1698, Apr. 2008. [3] E.V. Paraskevadaki and S. A. Papathanassiou,
“Evaluation of MPP voltage and power of mc-Si PV
modules in partial shading conditions,” IEEETrans.
Energy Convers. vol. 26, no. 3, pp. 923–932, Sep. 2011.
[4] Y. H. Ji ,Suwon, D.Y. Jung , C. Yue Won , B. K Lee “Maximum Power Point Tracking Method for PV
Array under Partially Shaded Condition”, IEEE
International Conferenceon, Sept. 2009 , Page(s):307 – 312
[5] D. W. Hart “Power Electronics” 1ST ed., New York: 2011.
[6] J. Betten, “Benefits of a coupled-inductor SEPIC converter”, Power Management.
[7] S. J. Chiang, H.J. Shieh, and M.C. Chen, “Modelling and Control of PV Charger System with SEPIC
Converter”, IEEE Trans. Ind. Electron, vol.56, no. 11,
pp.4344-4353, Nov. 2009.
[8] N. Mohan, T. Undeland, and W. Robbins, Power Electronics: Converters, Applications and Design, 2nd ed., New York:Wiley, 11995, pp. 164–172. [9] E. Koutroulis, ”A New Technique for Tracking the
Global Maximum Power Point of PV Arrays
Operating Under Partial-Shading Conditions”, IEEE
journal of Photovolt, vol. 2, no. 2, april 2012.
[10] S. Alsadi, B. Alsayid, “Maximum Power Point Tracking Simulation for Photovoltaic Systems Using Perturb and Observe Algorithm” International Journal of Engineering and Innovative Technology (IJEIT) vol. 2, Issue 6, Dec. 2012.
AUTHOR’S PROFILE:
1.
P.VENKATESH
PG Scholar, Department Of EEE. Gandhi Academy Of Technical Education, Ramapuram (kattakommu Gudem), Chilkur(M), Kodad, Telangana 508206.
2.D.CHA NDRA SEKHA R