ISSN (Print) : 2320 – 3765 ISSN (Online): 2278 – 8875
I
nternational
J
ournal of
A
dvanced
R
esearch in
E
lectrical,
E
lectronics and
I
nstrumentation
E
ngineering
(A High Impact Factor, Monthly, Peer Reviewed Journal)
Website: www.ijareeie.com
Vol. 8, Issue 7, July 2019
A Newton Raphson Based Algorithm for
Enhancement of Voltage Stability through
Optimal Placement of Shunt Facts Controller
D. Sathyanarayana
2, Bindu
1Associate Professor, Department of Electrical and Electronics Engineering, University B.D.T College of Engineering, Davanagere, Karnataka, India1
PG Student (Power Systems), Department of Electrical and Electronics Engineering, University B.D.T College of Engineering, Davanagere, Karnataka, India2
ABSTRACT: The work is concerned about voltage stability enhancement therefore it is important to find the week buses of the system. Here IEEE-30 bus test system is considered and implemented, Newton–Raphson load flow algorithm is used to find the voltages and phase angles at each bus, the bus with lowest voltage is treated as a weakest bus at which the shut FACTS Devices is to be connected in order to control the voltage of the week bus. One of the Shunt FACTS devices SVC is Capable of increasing voltage profile and give maximum voltage support not only to the bus where FACTS is connected but at almost all the buses of the system. To this study MATLAB written program is used to find the voltages and phase angles at each bus of IEEE 30 bus system with and without FACTS devices.
KEYWORDS: Load Flow, Newton Raphson, FACTS, SVC, Voltage Stability
I.INTRODUCTION
Voltage collapse may simply be explained as the inability of the power system to supply the required reactive power or because of an excessive absorption of the reactive power by the system itself. To meet the reactive power demand, and to increase the power transmittable capability of lines reactive power compensation is given. Reactive power compensation in power systems can be either shunt or series. Since most loads are inductive and consume lagging reactive power, the compensation required is usually supplied by leading reactive power. The most common form of leading reactive power compensation is by connecting shunt capacitors to the line. Shunt compensation of reactive power can be employed either at load level, substation level, or at transmission le vel.Load demand on distribution system is growing rapidly this is the main driving force for the voltage instability. Voltage instability is the inability of the power system to maintain a proper balance of reactive power and voltage control. This problem can be mitigated using FACTS controllers.The instability is caused by overload and some disturbances in the power system. Most important causes of stability problems
Large disturbance between generation and load
Unfavourable load characteristics
More distance between load sources and load centres
The source voltage is too low
With insufficient load reactive compensation
Reduction of coordination between various control and protective systems
ISSN (Print) : 2320 – 3765 ISSN (Online): 2278 – 8875
I
nternational
J
ournal of
A
dvanced
R
esearch in
E
lectrical,
E
lectronics and
I
nstrumentation
E
ngineering
(A High Impact Factor, Monthly, Peer Reviewed Journal)
Website: www.ijareeie.com
Vol. 8, Issue 7, July 2019
II. POWER FLOW SOLUTION OF NEWTON RAPHSON METHOD
Let us, express the net complex power injection in to the bus as SK=Sgk –Sdk. In this segment, we want to develop the
expression for this measure in terms of network voltages and admittances. And consider that all the quantities in per unit. We can express Sk as:
SK=VK IK* (1)
IK= (2)
Sk =VK ( )* (3)
Equation (3) can be written as
SK= ki-jBik) (|Vk||Vi| θk-θi)
ki-jBik) |Vk||Vi| (cos(θk-θi) + j sin(θk-θi)
SK=PK+QK, we can express above equation as two equations one is real part PK, and the other is imaginary part QK.
PK= Vk||Vi| (Gki cos (θk-θi) + Bki sin(θk-θi) (4)
QK= Vk||Vi|(Gki sin(θk-θi)-Bki cos(θk-θi) (5)
(6)
is the Jacobean matrix. Each elements of the Jacobian matrix is as follows: The diagonal and the off diagonal elements of can be calculated as follows Off diagonal element:
(7)
Diagonal element:
(8) The diagonal and off diagonal elements of can be calculated as follows
Off diagonal element: (9) Diagonal element:
(10)
ISSN (Print) : 2320 – 3765 ISSN (Online): 2278 – 8875
I
nternational
J
ournal of
A
dvanced
R
esearch in
E
lectrical,
E
lectronics and
I
nstrumentation
E
ngineering
(A High Impact Factor, Monthly, Peer Reviewed Journal)
Website: www.ijareeie.com
Vol. 8, Issue 7, July 2019
Off diagonal element:
(11) Diagonal element:
(12)
The diagonal and off diagonal elements are Off diagonal element:
) (13)
Diagonal element:
(14)
IV. OBJECTIVES OF SHUNT COMPENSATION
The transmissible power in the steady state can be increased and the voltage along the line can be controlled by appropriate reactive shunt compensation. The main objective of this reactive compensation is to modify the natural electrical characteristics of the transmission line to make it more compatible with the prevailing load demand. To minimize line overvoltage under light load conditions, the shunt connected fixed or mechanically switched reactors are used, and shunt connected, fixed or mechanically switched capacitors are applied to maintain voltage levels in high load conditions. The main objective of applying reactive shunt compensation in a transmission system is to increase the transmissible power and may be necessary to improve the transmission characteristics in a steady-state as well as the stability of the system.
V. INTRODUCTION TO SVC
The Static Var Compensator (SVC) is a shunt connected static Var generator or absorber whose output is regulated to exchange capacitive or inductive current so as to maintain or control specific parameters of the electrical power supply system (typically bus voltage).It is the variable impedance device in which the current through the reactor is always controlled using back to back connected thyristor valves.
ISSN (Print) : 2320 – 3765 ISSN (Online): 2278 – 8875
I
nternational
J
ournal of
A
dvanced
R
esearch in
E
lectrical,
E
lectronics and
I
nstrumentation
E
ngineering
(A High Impact Factor, Monthly, Peer Reviewed Journal)
Website: www.ijareeie.com
Vol. 8, Issue 7, July 2019
Fig.1. SVC firing angle model Fig.2. SVC total susceptance model
The SVC parameters must be determined in accordance with the compensation requirements. With as the SVC capacity and the bus voltage (voltage at the bus where SVC is to be connected) , the capacitance value and the TCR inductance are:
,
For a given frequency „f‟ Hz:
(15)
A.MODELLING OF SVC:
After evaluating capacitance and inductance values, the initial operating condition of the SVC must be evaluated. Then selection of initial firing angle α, such that under the operating condition the SVC should not interchange power with the AC system. This firing angle resembles to the case when effective reactance‟s and cancels each other. Under this operating condition, the SVC effective reactance must be infinite and thus no current flows through the SVC which indicates that there is no power exchange between the SVC and the AC system. At the TCR conducts fully and the equivalent reactance becomes At the TCR is blocked and its equivalent reactance becomes extremely large i.e. infinite. By using equation 4.3 and 4.4 in cuckoo search algorithm, the reactive power injected by SVC and equivalent reactance of thyristor controlled reactor (TCR) is calculated. The reactive power Qsvc( is givn by:
] (16)
(17)
VI. CASE STUDY AND SIMULATION RESULTS
ISSN (Print) : 2320 – 3765 ISSN (Online): 2278 – 8875
I
nternational
J
ournal of
A
dvanced
R
esearch in
E
lectrical,
E
lectronics and
I
nstrumentation
E
ngineering
(A High Impact Factor, Monthly, Peer Reviewed Journal)
Website: www.ijareeie.com
Vol. 8, Issue 7, July 2019
Fig.3. Standard IEEE 30 Bus Distribution Network.
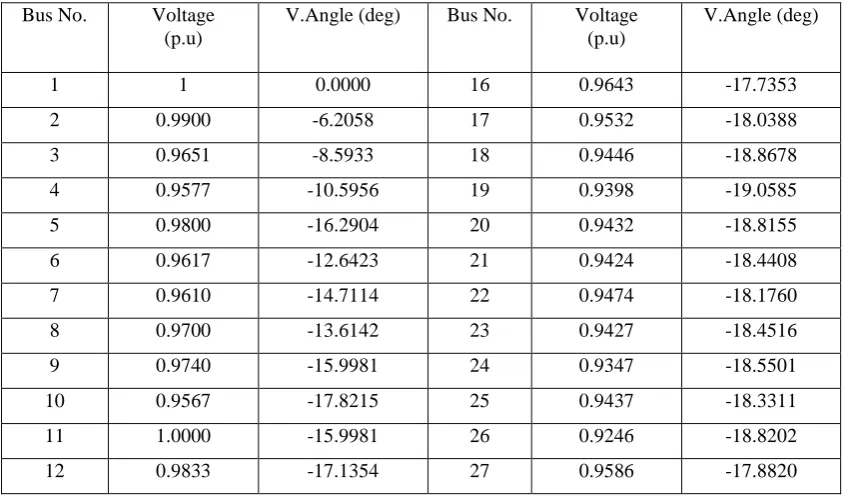
A. CASE 1:This is the base case without any FACTS device in the system. Newton-Raphson (NR) load flow analysis is carried out for IEEE 30 bus system and the system voltage and angle of the test system are obtained. Load flow program is coded in MATLAB to obtain the results. The extent of the voltage magnitude at different nodes of the system is given in Table 5.1. The minimum voltage is 0.9246 in node 26 and 0.9249 in node 30 for the considered base case.
Table 1:The voltage profile of the test system before placement of SVC Bus No. Voltage
(p.u)
V.Angle (deg) Bus No. Voltage (p.u)
V.Angle (deg)
ISSN (Print) : 2320 – 3765 ISSN (Online): 2278 – 8875
I
nternational
J
ournal of
A
dvanced
R
esearch in
E
lectrical,
E
lectronics and
I
nstrumentation
E
ngineering
(A High Impact Factor, Monthly, Peer Reviewed Journal)
Website: www.ijareeie.com
Vol. 8, Issue 7, July 2019
13 1.0000 -17.1354 28 0.9604 -13.3908 14 0.9652 -18.1409 29 0.9373 -19.2878 15 0.9584 -18.1692 30 0.9249 -20.3012
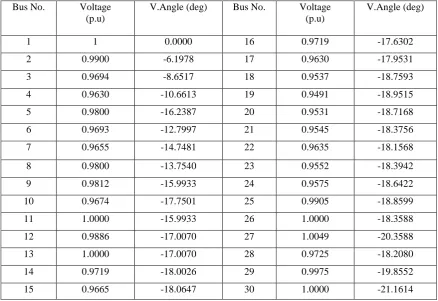
B. CASE 2: In this case, the system improves by connecting two SVC at bus 26 and 30 which are found as a weakest buses from case 1. A SVC model of shunt variable susceptance is incorporated to maintain the magnitude of the bus voltage of bus 26 and 30 equal to 1pu respectively. The SVC retains the voltage magnitude of bus 26 and bus 30 equal to 1pu by injecting reactive power of -0.0298pu to bus 26 and -0.0525 pu to bus 30 respectively, By connecting SVC an overall enhancement in the voltage profile is seen in all most all buses when compared to the system without SVC.
Table 2: The voltage profile of the test system after placement of SVC Bus No. Voltage
(p.u)
V.Angle (deg) Bus No. Voltage (p.u)
V.Angle (deg)
1 1 0.0000 16 0.9719 -17.6302 2 0.9900 -6.1978 17 0.9630 -17.9531 3 0.9694 -8.6517 18 0.9537 -18.7593 4 0.9630 -10.6613 19 0.9491 -18.9515 5 0.9800 -16.2387 20 0.9531 -18.7168 6 0.9693 -12.7997 21 0.9545 -18.3756 7 0.9655 -14.7481 22 0.9635 -18.1568 8 0.9800 -13.7540 23 0.9552 -18.3942 9 0.9812 -15.9933 24 0.9575 -18.6422 10 0.9674 -17.7501 25 0.9905 -18.8599 11 1.0000 -15.9933 26 1.0000 -18.3588 12 0.9886 -17.0070 27 1.0049 -20.3588 13 1.0000 -17.0070 28 0.9725 -18.2080 14 0.9719 -18.0026 29 0.9975 -19.8552 15 0.9665 -18.0647 30 1.0000 -21.1614
ISSN (Print) : 2320 – 3765 ISSN (Online): 2278 – 8875
I
nternational
J
ournal of
A
dvanced
R
esearch in
E
lectrical,
E
lectronics and
I
nstrumentation
E
ngineering
(A High Impact Factor, Monthly, Peer Reviewed Journal)
Website: www.ijareeie.com
Vol. 8, Issue 7, July 2019
Fig.4. Voltage Profile of IEEE 30 Bus System without SVC.
In the fig.5, it shows the voltage profile corresponding to each bus of IEEE 30 bus test system after placement of SVC at optimal location. It is the graph of bus number verses voltage magnitude.
Fig.5. Voltage Profile of IEEE 30 Bus System with SVC at bus 26,30.
ISSN (Print) : 2320 – 3765 ISSN (Online): 2278 – 8875
I
nternational
J
ournal of
A
dvanced
R
esearch in
E
lectrical,
E
lectronics and
I
nstrumentation
E
ngineering
(A High Impact Factor, Monthly, Peer Reviewed Journal)
Website: www.ijareeie.com
Vol. 8, Issue 7, July 2019
Fig.6. Voltage Profile (IEEE 30 bus system) before and after SVC at bus 26 and 30.
VII. CONCLUSION.
Newton Raphson load flow study is performed for IEEE-30 Bus test system with and without shunt FACTS bypass device. It has found that SVC has the ability to improve voltage profile and gives maximum assistance by providing stable and constant voltage support, not only to the bus where SVC is coupled, but also to almost all system buses. And the graph of the bus voltage profile is plotted for with and without shunt FACTS devices for the base case. The main objective of this project work is to maintain voltage stability and that has been reached effectively with the incorporation of SVC, therefore it is possible to maintain the stability of the system.
REFERENCES
[1] S.M. Suhail hussain, N.Vaisali “Identification Of Weak Buses Using Voltage Stability Indicator And Its Voltage Profile Improvement By Using DSTATCOM In Radial Distribution Systems” IEEE Transactions on Power Systems, vol.3 issue 4, pp. 17-23 ,2012.
[2] R.S. AI Abri, Ehab F. EI-Saadany and Yasser M. Atwa," Optimal Method Of Positioning And Sizing To Improve The Margin Of Voltage Stability In A Distribution System Using Distributed Generation," IEEE Transactions on Power Systems, vol. 28, No. I, pp. 326-334, 2013. [3] C. Reis and F.P. Maciel Barbosa, in their document “Line Indices for the Evaluation of Voltage Stability” IEEE Transactions on Power Systems, voI.25.No. 3, pp.1566-1574, 2009.
[4] R. M. Idris, N. M. Zaid in their paper “Optimal Placement of Shunt Capacitor in the Radial Distribution System," 978-1-5090-2547-3/16, 2016 IEEE.
[5] H.B. Nagesh and P.S. Puttaswamy “Improvement of Voltage Stability Margin By Means Of the FACTS Controllers” International Journal of Computer and Electrical Engineering, Vol. 5, No. 2, April 2013
[6] Y. Pavan Kumar1, H.B. PhaniRaju in their paper “Static Voltage Stability Margin Enhancement Using Shunt Compensating Devices,”
Conference on Transmission &Disttribution, 2014.
[7] S. Sivanagaraju, N. Visali, V. Sankar, “Enhancing Voltage Stability of Radial Distribution Systems by Network Reconfiguration” Electrical power components and system vol. 33,issue 5,pp.539-550, 2005.