ABSTRACT
ROBINSON, BRIDGET LYNN. Evaluation of Weed Scouting Methods and the Effects of Glyphosate Drift in North Carolina Peanut (Arachis hypogaea) Production. (Under the direction of Dr. John W. Wilcut.)
EVALUATION OF WEED SCOUTING METHODS AND THE EFFECTS OF GLYPHOSATE DRIFT IN NORTH CAROLINA PEANUT (ARACHIS HYPOGAEA)
PRODUCTION
by
BRIDGET LYNN ROBINSON
A thesis submitted to the Graduate Faculty of North Carolina State University in partial fulfillment of the requirements for the Degree of Master of Science
CROP SCIENCE & AGRICULTURE EDUCATION
Raleigh 2005
APPROVED BY:
__________________________________ _______________________________ Dr. Gary E. Moore Dr. Gail G. Wilkerson
__________________________________ _______________________________ Dr. David L. Jordan Dr. James. L. Flowers
Co-Chair of Advisory Committee
"Cultivators of the earth are the most valuable citizens. They are the most vigorous, the most independent, the most virtuous, and they are tied to their country and wedded to its liberty and interests by the most lasting bands."
23 August 1785
Thomas Jefferson to John Jay
BIOGRAPHY
Bridget Lynn Robinson was born on 14 January 1977 to Don and Sue Robinson of Jefferson, Oregon. She and her younger brother, Nolan, were raised with an appreciation for farming from an early age; spending many happy days working, playing outside, and
traveling around Oregon.
Bridget graduated from Jefferson High School in 1995, and was involved with numerous activities including FFA, 4-H, Choir, Spanish, and School Government. During her trip to the National FFA Convention she decided that her future career would be focused on agriculture education and awareness. She attended Oregon State University where she was involved in the Crop Science Club, the Crops Judging Team, and a course that took her on a two-week tour of European agriculture. The highlight of her undergraduate career was a nine-month study abroad at Lincoln University in Canterbury, New Zealand. She graduated with her degree in Crop Science in May of 1999.
Summers spent working in two research labs; Agri-Seed Testing and the USDA-ARS (National Forage Seed Production Research) were educational and enjoyable. At the USDA, she was introduced to agricultural research as part of a long-term cropping system research project focusing on forage crops. Friendships with Kristine Reid Neese, Bill Gavin, and Dr. Jeffery Steiner were very influential in her decision to pursue graduate education.
In 2000, Bridget began graduate studies at North Carolina State University in the department of Agricultural and Extension Education. She assisted Dr. George Bostick and Dr. Beth Wilson in teaching computing and biotechnology classes, and decided to pursue a degree in Crop Science while concurrently completing her degree in Agricultural Education. She increased her knowledge of research with Dr. John Wilcut’s program as she was
immersed in field research, teaching and presenting at professional meetings. During her third year of graduate work, the opportunity arose to work for Dr. Gail Wilkerson. During her tenure there she continued researching weed science while finishing the requirements for her M.S. Degree.
Bridget is a member of Gamma Sigma Delta and Omicron Tau Theta, as well as numerous professional agronomy societies. She served as secretary of the crop science graduate student association in 2002 & 2003, and competed in the Graduate Weed Contest. In 2002, she received the George Washington Carver award from the National Peanut Board, first place in the graduate student poster competition at the Southern Weed Science Society, third place in the graduate student speaking contest at the American Peanut Research and Education Society, and third place in the graduate student speaking contest at the Crop Protection School.
ACKNOWLEDGEMENTS
I would like to sincerely thank Dr. John Wilcut for serving as my major advisor in Crop Science and Dr. Jim Flowers for serving as my major advisor in Agricultural Education. I would also like to thank Drs. David Jordan, Gail Wilkerson, and Gary Moore for serving on my graduate committee. In addition, I would also like to thank the whole Wilkerson lab for their friendship, guidance and laughs. I am appreciative of the help of Dr. Ian Burke, Scott Clewis, Sarah Hans Lancaster, Dr. Wendy Pline-Srnić, Dr. Andrew Price, Walter Thomas, and Shawn Troxler and would also like to thank my fellow graduate students for their friendships and assistance.
I am grateful to my parents and the rest of my family for encouraging me to set goals, travel, and attain all that I set my mind to do. They have provided the lessons that have taught me the importance of pulling together and working toward goals. I would also like to thank Shep and his family for their love. Shep has always encouraged me to take advantage of my opportunities in school, supported my decisions and laughed with me at my
over-commitment tendencies. I also want to thank Phil and Linda for providing me a home-away-from home during my studies in North Carolina. It is not without the support of Shep, Mom & Dad, Nolan, or Phil & Linda that I would be submitting this thesis
Lastly, I express my thankfulness to God for his blessings, never-ending love, and foresight to create situations that better us.
TABLE OF CONTENTS
Page
LIST OF TABLES……….vii
LIST OF FIGURES ………...viii
LITERATURE REVIEW ………...1
MODELING THE ECONOMICS AND EFFICACY OF ALTERNATIVE SCOUTING METHODS IN PEANUT (Arachis hypogaea L.)………...… 25
Abstract………….……….…... 25
Introduction………... 26
Materials and Methods……….. 29
Results and Discussion….……… 33
Literature Cited……….……… 42
YIELD AND PHYSIOLOGICAL RESPONSE OF PEANUT (Arachis hypogaea L.) TO GLYPHOSATE DRIFT……….……… 61
Abstract….……… 61
Introduction………...….………... 62
Materials and Methods……….. 64
Results and Discussion……….……….... 68
Literature Cited…….……….74
APPENDICIES Appendix A. Observations and Comments from Extension Agents ………... 86
LIST OF TABLES
Modeling the Economics and Efficacy of Alternative Weed Scouting Methods in Peanut (Arachis hypogaea L.)
Table 1. Preemergence (PRE), preplant incorporated (PPI) and at-cracking herbicide treatments applied to peanut fields prior to scouting………...………. 47
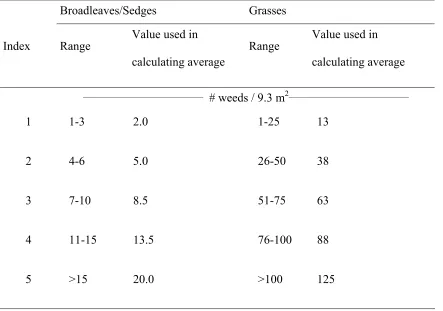
Table 2. Index values, and the associated density ranges for broadleaf, sedge, and grass weeds, where 1 = low population, and 5 = high population. Each weed species contained within the sample area was assigned a rating from 1 to 5………...………. 48
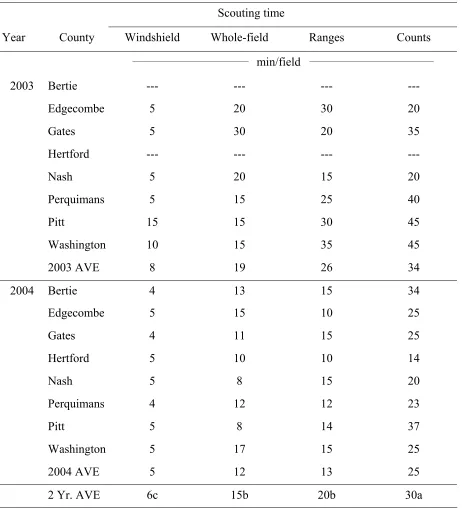
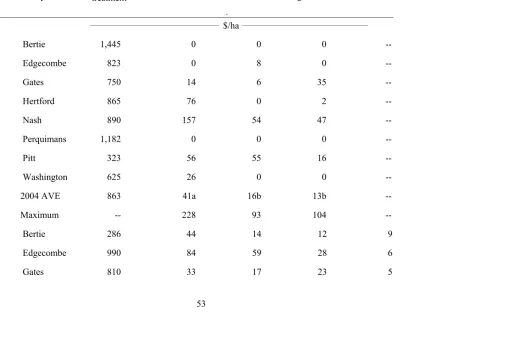
Table 3. Broadleaf, sedge, and grassy weeds observed by one or more scouts using one or more scouting methods in 16 North Carolina peanut fields ……… 49 Table 4. Time (min) required to scout 18 peanut fields using four different scouting methods in North Carolina in 2003 and 2004, averaged over three scouts…………... 52 Table 5. Theoretical net returns (TNR) and loss ($/ha) as estimated by HADSS for the sixteen fields when the windshield, whole-field estimate, range and count methods were used to obtain weed population information..………... 53 Table 6. Scouting methodology and HADSS recommended treatment with a TNR within 10% of the optimal treatment……..……….. 55
Table 7. Herbicide recommendations generated in HADSS compared to extension agent and farmer recommendations……… 56
Yield and Physiological Effects of Peanut Yield and Quality to Glyphosate Drift
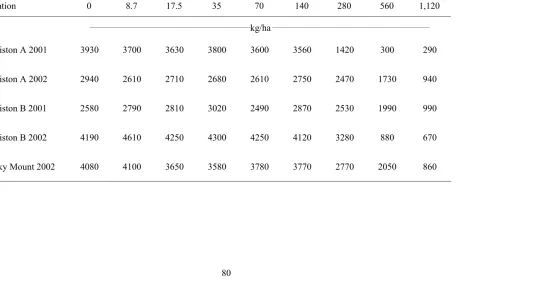
Table 1. Mean pod yields for peanut treated with eight rates of glyphosate in five North Carolina locations………...……….. 80 Table 2. Correlations of pod injury vs. yield, pod injury vs. shikimic acid, and shikimic acid vs. yield in five locations for peanut treated with eight rates of glyphosate in North Carolina ….………...……… 81
LIST OF FIGURES
Modeling the Economics and Efficacy of Alternative Weed Scouting Methods in Peanut (Arachis hypogaea L.)
Figure 1. Field diagram indicating each of three scouts positions in the field when scouting.……….. 58
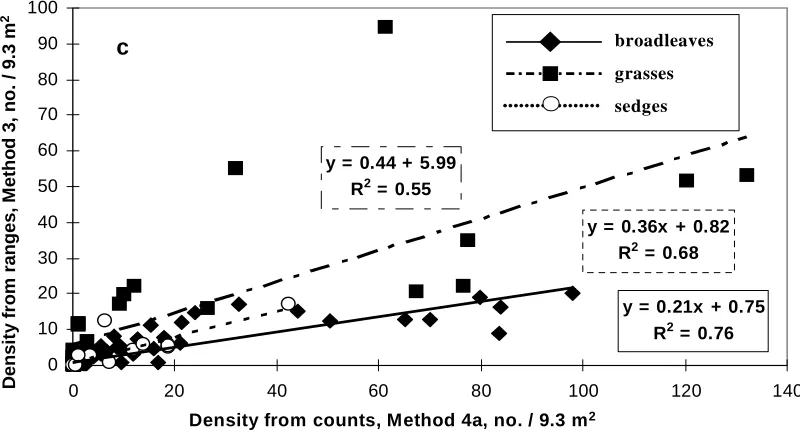
Figure 2. Comparison of estimated weed densities using a) windshield (Method 1), b) whole-field (Method 2), c) range (Method 3) and d) count (Method 4a) scouting methods. Each data point on the graph represents the estimated average density of one species in one field using data from all three scouts.……….. 60
Yield and Physiological Effects of Peanut Yield and Quality to Glyphosate Drift Figure 1. Early peanut injury seven days after treatment in peanut at eight different glyphosate rates in five different locations in North Carolina ………... 82 Figure 2. Shikimic acid accumulation 7 DAT in peanut at eight different glyphosate rates in three different locations in North Carolina ……….. 83 Figure 3. Peanut pod yield reduction (%) at eight different glyphosate rates in five different locations in North Carolina ………. 84 Figure 4. Total precipitation for each location and year: Lewiston-Woodville
(http://cirrus.dnr.state.sc.us/cgi-bin/sercc/cliMAIN.pl?nc4962) and Rocky Mount (http://cirrus.dnr.state.sc.us/cgi-bin/sercc/cliMAIN.pl?nc7400) respectively, compared to the 47 and 48 year average for each location
(http://www.sercc.com/climateinfo/historical/historical_nc.html) ……… 85
1
CHAPTER 1 Literature Review
North Carolina peanut production. Peanut (Arachis hypogaea L.) is an important food crop worldwide and is valued for its oil, for eating out of the shell, as well as for many processed products including peanut butter. It is believed that the center of origin for peanut was the Mato Grosso region of Brazil in South America. The crop was taken to Africa as barter in the slave trade, and eventually brought to be cultivated in the United States. Extensive efforts have been made to catalogue the germplasm, and to breed new cultivars that are better yielding and have disease resistance (Stalker and Simpson 1995). North Carolina is an important area of production for peanut, based upon the climate and soil conditions found in the northeastern part of the state (Sholar et al. 1995). More that 500,000 hectares of peanuts are grown annually in the United States, and approximately 40,000 hectares are in the Virginia-Carolina region (Brown 2005). Most peanut grown in North Carolina are Virginia market-types, and their larger pods are preferred over runner peanuts for eating out of the shell (Sholar et al. 1995; Brown 2005). The smallest Virginia pods may be substituted for runner peanuts and used for making peanut butter (Brown 2005). There is some interest in growing runner and Spanish-type peanuts in North Carolina (Jordan 2005a), but the main production areas for these two peanut types are in Georgia and Texas.
In North Carolina, peanut is usually planted in early May (Jordan 2005a) on raised beds (Henning et al. 1982) in single rows spaced 91 to 102 cm apart (Sholar 1995). Before
2
parasiticum, a soil-borne disease for which there are few treatments except planting resistant varieties and rotating crops every three years (Shew 2005). Typical at-planting treatments include rhizobium innoculant to encourage root nodulation for nitrogen fixation, and aldicarb applied in-furrow to guard against thrips and leafhoppers (Brandenburg 2005). Seasonal applications of lime, nitrogen, phosphorus, and potassium fertilizers ensure that proper soil nutrition is present for peanut growth (Jordan 2005a), and seasonal applications of various herbicides, fungicides and insecticides are used to control common pests (Sherwood et al. 1995; Wilcut et al. 1995). Early season weed control is important for reducing weed competition, and many growers choose to treat with preemergence (PRE) and preplant incorporated (PPI) herbicides at the time of land preparation. Typical weather conditions in North Carolina encourage disease formation, and foliar and soil borne leaf diseases are especially detrimental to yield in late season (Shew 2005). Biweekly fungicide regimes are used to reduce disease populations. Other common treatments include applications of landplaster (gypsum) to encourage pegging and pod formation, and plant growth regulators to create row definition at harvest. Most peanut varieties grown in North Carolina require 142 to 160 days (2,520 to 2,770 growing degree days) to mature (Jordan 2005a). After determining optimal pod maturity (using the hull-scrape method to determine mesocarp color) (Williams and Drexler 1981) peanuts are inverted and picked in September and October.
3
such as sunlight, water and nutrients (Barbour et al. 1994). Additionally, weeds serve as hosts for pests, interfere with insecticide and fungicide deposition, and impede harvest when they become entangled in harvest equipment (Wilcut et al. 1995). Some of the most common weeds in the southeastern U.S. VC region include common lambsquarters (Chenopodium album. L.), common ragweed (Ambrosia artemesiifolia L.), common cocklebur (Xanthium strumarium L.), various Ipomoea species, various Amaranthus species, yellow nutsedge (Cyperus esculentus L.) and various annual grasses (Bridges et al. 1994).
Crop rotation and cultivation are two cultural practices that can help manage weeds,
insects, and soil-born diseases from year to year in peanut. Drawbacks to cultivation include damage to peanut pegs which increases the incidence of stem and pod diseases, and turning over of new weed seeds in the soil profile (Jordan 2005b). Chemical weed control can be achieved using PRE or PPI herbicides early in the season based upon weed species present in past years, or postemergent (POST) herbicides based upon weed species that have emerged in the current year. PRE and PPI herbicides rarely provide season-long control of the whole spectrum of weeds (Wilcut et al. 1995), and are often amended with POST herbicides in peanut (Jordan 2005b). Weed control is important for reducing yield losses as well as reducing the number of weeds deposited in the soil seed bank, which potentially reduces the number of seeds that will germinate in subsequent growing seasons.
4
General threshold models have been developed and validated for many pests (including weeds and insects) and a wide variety of crops in recent years (Black et al. 1993; Jensen et al. 2000; Holsapple and Whinston 1996; Renner et al. 1999). Decision models have been
developed for specific crops including corn (Zea mays L.) (Buhler et al. 1996a), cotton (Gossypium hirsutum L.) (Hearne and Bange 2002; Bange et al. 2003; Scott et al. 2001), soybean [Glycine max (L.) Merr.], (Berti and Zanin 1997; Buhler et al. 1996b; Monks et al. 1995), sugarbeet (Beta vulgaris) (Schribbs et al. 1990), sunflower (Helianthus annus)
(Castro-Tendero and Garcia-Torres 1996), and wheat (Triticum aestivum) (Kwon et al. 1995; Pasqual 1994).
Other threshold models are focused upon the specific relationships between herbicides and crops (Forcella et al. 1996; Jensen et al. 2000; Stigliani and Resina 1993; Swinton and King 1994). HADSS, (Herbicide Application Decision Support Software) is a computer program developed at North Carolina State University that is currently in use for corn, cotton,
soybean, and peanut (Bennett et al. 2003; Sturgill et al. 2003) in North Carolina.
5
The use of DSS programs helps users to consider all aspects of the economic decision making process that surrounds the management of the crop including: the value of the crop, herbicide and application costs, herbicide efficacy, estimated yield loss if weeds are not controlled, and crop/weed competition relationships (Wilkerson et al. 1991).
Basing herbicide applications on HADSS (Jordan et al. 1999; MacDonald et al. 1998; Scott et al. 2002; White and Coble 1997) and similar decision aids (Rankins et al. 1998) has been just as (and sometimes more) effective as prophylactic applications. The extensive validation projects have increased awareness of these tools, and shown that their use can increase
profitability at the farm level if scouting costs can be kept within reason.
Weed scouting in peanut. Development of decision models has driven research of sampling methods in crops, and decision models provide a basis for evaluation of the scouting
techniques. Most weed scouting procedures are based upon guidelines developed for insects and diseases because many of the same biological premises hold true for all three types of pests (Berti et al. 1992; Gold et al. 1996; Johnson et al. 1996; Krueger et al. 2000). For optimal sampling, fields should be scouted not only for weed presence, but also for size, number and species diversity.
6
features of the field. Wiles and Brodahl (2004) found that there were several factors that influence weed growth patterns in a field, including past management of the field, seed bank density, seed size, method of dispersal, and density, and especially type of irrigation in the field. Tillage was also found to be a factor in their study, showing that there were differences between furrow-irrigated fields and fields with center pivot irrigation. Another confounding aspect of weed scouting is the human error element (Wiles et al. 1993). Scouts may
miscount, over or underestimate weed densities, tend toward larger or smaller populations of weeds in the field, or follow a pattern when moving through the field.
Scouting methods have been explored and debated in the literature, resulting in many different conclusions. Methods can be evaluated by the cost of the sampling method as compared to the value of the information collected and recommendations generated (Nyrop et al. 1986). The bottom line of weed sampling is to obtain an accurate enough estimate of weed species and populations to prescribe an effective uniform treatment for the field (Wiles 2005). It is not enough to simply know that weeds are non-uniformly distributed in
7
sample quadrats. The quadrat is either counted or not counted when it contains a certain number of weeds and utilizes a pre-set cut-off point. In censored sampling (also called presence/absence sampling), weeds in each quadrat are counted and the cut-off point is zero (Gold et al. 1996). Both of the latter methods are used in entomology, and lend themselves to site specific applications (Krueger et al. 2000). Various automated scouting methods have also been explored, with images being captured via GPS (Gerhards and Christensen 2003; Rew et al. 1996). At this time, computer generated weed maps are still in the developmental phases and tend to be cost prohibitive to the average farmer.
Site-specific weed control is based upon the premise that a grower does not need to spray an entire field to kill weeds that may only occur in small portions of the field, (Johnson et al. 1996). One method that has been investigated is variable-rate herbicide application utilizing grid sampling (a field is divided into a systematic grid and weeds are counted or estimated within each grid) (Wilkerson et al. 2004). Research has shown that in some cases these methods could greatly reduce herbicide applications by as much as 70% (Wilkerson et al. 2004), however this approach may not be practical in production fields due to the time and cost associated with this level of scouting (Clay et al. 1999). Cost evaluations have also shown that these methods also may not be attractive to growers due to the specialized equipment that is needed for variable-rate herbicide applications.
Due to the time and cost of in-depth scouting, growers often make herbicide
8
the weeds, or if the rate of herbicide exceeds that which is really needed for adequate control, the grower may accumulate unnecessary expenses. While the optimal herbicide treatments are more likely to be chosen with more in depth scouting procedures, less intensive scouting procedures can also result in choosing the correct herbicide recommendation – however the margin for error is much greater with less intensive scouting (Wiles et al. 1992b).
Economic Thresholds. When weed densities reach levels that could cause economic losses due to reduced crop yield and quality, and the benefit of treatment outweighs the cost of treatment, an economic threshold is set (Coble and Mortensen 1991; Zimdahl 1988). In pest control, economic thresholds have been explored for weeds, insects, and plant pathogens. Economic thresholds, first proposed by entomologists, have slowly been adopted by weed scientists. Economic thresholds are set for individual species, and can become complicated when multi-species weed complexes exist in a field (Wilkerson et al. 2002).
A model that estimates yield loss as a function of weed density (Cousens 1985) has been utilized in HADSS and other pesticide DSSs. Additionally, weed species are assigned a relative competitive index (CI) on a scale from 0 to 10 (Coble and Mortensen 1991;
9
2, 4, and 8 plants/7.6m of row, respectively (Brecke and Royal 1990). Various research has shown that a weed-free period of 4 to 6 weeks in peanut will significantly reduce yield losses in peanut (Buchanan et al. 1982).
An action threshold is defined as the time when you decide to take action, and do something to control the pest (Radosevich et al. 1997). Threshold values for some weed species may be adjusted to take into consideration the impacts of that weed on subsequent crops grown in that field, the weed’s impact upon crop value and ease of harvest, or the role of that weed as a host to other pests (Radosevich et al. 1997). Additionally, if a crop is stressed by drought, or being attacked by several other pests, you may choose to lower the action threshold in order to take action sooner.
Glyphosate Use. Glyphosate is a non-selective broad spectrum herbicide that effectively controls over 300 grass, sedge, and broadleaf weeds (Franz et al. 1997). It is the active ingredient in Roundup®, and many other glyphosate formulations. Absorbed on-contact through the leaves of a plant, glyphosate is highly mobile within the phloem of plants, making it an effective herbicide for perennial plants. Environmentally, the mammalian toxicity of glyphosate is low. Glyphosate is also relatively safe in the environment because it is adsorbed onto soil particles and is not easily leached into groundwater.
10
enzyme target of glyphosate, it affects many physiochemical and physiological processes that are essential to plant growth (Cole 1985).
First discovered in the early 1970s, glyphosate was registered by Monsanto (Baylis 2000). USDA statistics show that the use of glyphosate has increased: in 1996, 4, 13, and 25% of the land was treated with glyphosate in corn, cotton, and soybean, respectively. In 2003 19, 69, and 87% of the land was being treated for corn, cotton, and soybean (National Agriculture Statistics Service 1997, 2004).
Herbicide Resistant Crops. The introduction of the glyphosate resistance gene (Brashaw et al. 1997) into crops in 1996 has caused an enormous shift in weed control practices. Moving from the use of a wide range of PRE, PPI and POST herbicides to an all-inclusive application of glyphosate across a range of crops represents an opportunity for improved weed
management (Wilcut et al. 1996). Glyphosate and other broad-spectrum herbicides, such as glufosinate, were historically applied in burndown and PRE situations, but now producers plant herbicide resistant crops and may repeatedly apply the herbicide throughout the growing season as needed (Mendelson 1998; Shaner 2000). This paradigm shift also raises concerns about the development and control of herbicide resistance in weedy relatives (Shaner 2000), as well as the control of volunteer herbicide resistant-weeds within herbicide resistant crops (York et al. 2005).
The increase of glyphosate use has been most evident in U.S. soybean, and cotton production (Owen 2000; Shaner 2000), and less evident in U.S. corn production. Glyphosate-resistant (GR) Roundup Ready® cotton was first commercially available to
11
cotton varieties, and growers have experienced far less problems. GR soybean was first available on a limited basis in 1997. GR corn was first available in 1998, but its acceptance in the U.S. has been less aggressive than that of both GR cotton and GR soybean.
In North Carolina, there were over 40,000 hectares of peanut grown in the 2002 growing season (Brown 2005). During the same year GR cotton cultivars were planted on more than 75% of the cotton hectarage in North Carolina (A. C. York, personal communication; National Agricultural Statistics Service 2002). Additionally, 80 to 90% of the soybean hectarage and 15% of the corn hectarage in North Carolina are planted to GR varieties (E. J. Dunphy; A. C. York, personal communication).
Herbicide Drift. The majority of the agricultural chemicals used to control pests are applied as liquid spray droplets. In environmental situations that favor volatilization and
redeposition, these droplets can drift away from the intended target. Improper application techniques (Wauchope et al. 1982) and windy weather can influence the occurrence of drift. Applications of herbicides in temperature inversions can also encourage the occurrence of drift. Droplet size is the single most important factor in reducing drift, with highly driftable droplets measuring <105 μm. Research has shown that a number of spray nozzles (Jones et al. 2003) - especially air induction nozzles (Hanks et al. 2002) and drift adjuvants reduce drift (Jones et al. 2002) and do not negatively affect levels of weed control.
12
between 1/10th and 1/100th of the applied rate (Al-Khatib and Peterson 1999), which is considered to be sub-lethal, but nonetheless damaging to susceptible crops. Drift has been shown to be more damaging when it occurs early in a plant’s growth cycle (Snipes et al. 1992), but is not always correlated to yield loss (Ellis and Griffin 2002) and may need to be recurring in order to cause yield losses (Gilreath et al. 2001).
Spray drift and herbicide uptake in a plant can be influenced by a number of factors
13
LITERATURE CITED
Al-Khatib, K. and D. Peterson. 1999. Soybean (Glycine max) response to simulated drift from selected sulfonylurea herbicides, dicamba, glyphosate, and glufosinate. Weed Technol. 13:264-270.
Askew, S. D., W. A. Bailey, G. H. Scott, and J. W. Wilcut. 2002. Economic assessment of weed management for transgenic and nontransgenic cotton in tilled and nontilled systems. Weed Sci. 50:512-520.
Askew, S. D. and J. W. Wilcut. 1999. Cost and weed management with herbicide programs in glyphosate-resistant cotton (Gossypium hirsutum). Weed Technol. 13:308-313. Bange, M. O., S. A. Deutscher, D. Larsen, D. Linsley, and S. Whiteside. 2003. A handheld
decision support system to facilitate improved insect pest management in Australian cotton systems. Comp. and Elec. in Agric. 43:131-147.
Barbour, J. C., D. C. Bridges, and D. S. NeSmith. 1994. Peanut acclimation to simulated shading by weeds. Agron. J. 86:874-88.
Baylis, A. D. 2000. Why glyphosate is a global herbicide; strengths, weaknesses and prospects. Pest. Manag. Sci. 56:299-308.
Bennett, A. C., A. J. Price, M. C. Sturgill, G. S. Buol, and G. G. Wilkerson. 2003.
HADSSTM, Pocket HERBTM, and WebHADSSTM: Decision aids for field crops. Weed Technol. 17:412-420.
Berti A. and G. Zanin. 1997. GESTINF: a decision model for post-emergence weed management in soybean (Glycine max (L.) Merr.). Crop Prot. 16:109-116. Berti A., G. Zanin, G. Baldoni, C. Grignani, M Mazzondini, P. Montemurro, F. Tei, C.
14
applicability of a sequential sampling method to integrated weed management. Weed Res. 32:39-44.
Black, I. D. and C. B. Dyson. 1983. An economic threshold level for spraying herbicides in cereals. Weed Res. 33:279-290.
Brandenburg, R. L. 2005. Peanut insect and mite management. In 2005 Peanut Information. Raleigh, NC: North Carolina State University Coop. Ext. Ser. Series AG-331. pp. 61-77.
Brashaw, L. D., S. R. Padgette, S. L. Kimball, and B. H. Wells. 1997. Perspectives on glyphosate resistance. Weed Technol. 11:189-198.
Brecke, B. J. and S. S. Royal. 1990. Cocklebur interference in peanuts. Proc. South. Weed Sci. Soc. 43:329.
Bridges, D. C. 1994. Impact of weeds on human endeavors. Weed Technol. 8:392-395. Brown, A. B. 2005. 2004 outlook and situation. In 2005 Peanut Information. North
Carolina State University Coop. Ext. Ser. Series AG-331. pp. 1-15.
Buchanan, G. A., D. S. Murray, and E. W. Hauser. 1982. Weeds and their control in peanuts. In H. E. Patee and C. T. Young (eds.) Peanut Science and Technology. Amer. Peanut Res. Educ. Soc., Yoakum, TX. pp. 209-249.
Buhler, D. D., R. P. King, S. M. Swinton, J.L. Gunsolaus, and F. Forcella. 1996a. Field evaluation of a bioeconomic model for weed management in corn (Zea mays). Weed Sci. 44:915-165.
15
Castro-Tendero, A. J., and L. Garcia-Torres. 1996. SEGMAGI – an expert system for weed control decision making in sunflowers. Crop Prot.14:543-548.
Clay, S. A., G. J. Lems, D. E. Clay, F. Forcella, M. M. Ellsbury, C. G. Carlson. 1999. Sampling weed spatial variability on a fieldwide scale. Weed Sci. 47:674-681. Clay and Johnson. 2002. Scouting for weeds. Crop Management. Online Resource:
Doi:10.1094/cm_2002_1206_01. Published Dec 2002.
Coble H. D. and D. A. Mortensen. 1991. The threshold concept and its application to weed science. Weed Technol. 6:191-195.
Cole, D. J. 1985. Mode of action of glyphosate – a literature analysis. In E. Grossbard and D. Atkinson (eds.). The Herbicide Glyphosate. Butterworths: London UK. pp. 37-67. Cousens R. 1985. A simple model relating yield loss to weed density. Ann. Appl. Biol.
107:239-252.
Culpepper, A. S., and A. C. York. 1999, Weed management in glufosinate-resistant corn (Zea mays). Weed Technol. 13:324–333.
Culpepper, A. S., A. C. York, R. B. Batts, and K. M. Jennings. 2000, Weed management in glufosinate- and glyphosate-resistant soybean (Glycine max): Weed Technol. 14:77–88. Ellis, J. M. and J. Griffin. 2002. Soybean (Glycine max) and cotton (Gossypium hirsutum)
response to simulated drift of glyphosate and glufosinate. Weed Technol. 16:580–586. Feng, P.C.C, T. Chiu, and R. D. Sammons. 2003. Glyphosate efficacy is contributed by its
16
Forcella, F., R. P. King, S. M. Swinton, D. D. Buhler, and J. L. Gunsoleus. 1996. Multi-year validation of a decision aid for integrated weed management in row crops. Weed Sci. 44:650-661.
Franz J. E., M. K. Mao, J. A. Sikorski. 1997. Uptake, transport and metabolism of
glyphosate in plants. In Glyphosate: A unique global herbicide. ACS monograph 189. Gerhards R. and S. Christensen. 2003. Real-time weed detection, decision making and patch
spraying in maize, sugarbeet, winter wheat and winter barley. Weed Res. 43:385-392. Gilreath, J. P., C. A. Chase, S. J. Locascio. 2001. Crop injury from sublethal rates of
herbicide. III. Pepper. HortSci. 36:677-681.
Gold, H. J., J. Bay, and G. G. Wilkerson. 1996. Scouting for weeds, based on the negative binomial distribution. Weed Sci. 44:504-510.
Hanks, J. E., E. J. Jones, G. H Wills, and R. E Mack. 2002. Effects of nozzle types and glyphosate formulations on spray droplet size and patterns. Proc. South. Weed Sci Soc. 55:190.
Hearn, A. B. and M. P. Bange. 2002. SIRATAC and CottonLOGIC: persevering with DSSs in the Australian cotton industry. Agric. Syst. 74:27-56.
Henning, R. J., A. H. Allison, and L. D. Tripp. 1982. Cultural practices. In Peanut Science and Technology H. E. Pattee and C. T. Young, (eds.). Am. Peanut Res. and Educ. Soc. Yoakum, TX. pp. 123-138.
17
Jensen, A. L., P. S. Boll, I. Thysen, and B. K. Pathak. 2000. Pl@ntInfo – a web-based system for personalized decision support in crop management. Comput. Electron. Agric. 25:271-293.
Johnson, G. A., D. A. Mortensen, L. J. Young, and A. R. Martin. 1996. Parametric
sequential sampling based on multistage estimation of the negative binomial parameter k. Weed Sci. 44:555-559.
Jones, E. J., J. E. Hanks, G. D. Wills, and R E. Mack. 2003. Effect of drift control adjuvants on glyphosate applied with extended range spray nozzles. Proc. S. Weed. Sci. Soc. CD-ROM.
Jones, E. J., J. E. Hanks, and G. D. Wills. 2002. Effect of different nozzle types on drift and efficacy of Roundup Ultra. Mississippi Agricultural and Forestry Experiment Station Technical Bulletin. Mafes Bulletin #1119.
Jordan, D. L. 2005a. Peanut production practices. In 2005 Peanut Information. North Carolina State University Coop. Ext. Ser. Series AG-331. pp. 17-33.
Jordan, D. L. 2005b. Weed management in peanuts. In 2005 Peanut Information. North Carolina State University Coop. Ext. Ser. Series AG-331. pp. 35-60.
Jordan, D. L., G. G. Wilkerson, and D. W. Krueger. 2003. Evaluation of scouting methods in peanut (Arachis hypogaea) using theoretical net returns from HADSSTM. Weed Technol. 17:358-365.
18
Krueger, D. W., G. G. Wilkerson, H. D. Coble, and H. J. Gold. 2000. An economic analysis of binomial sampling for weed scouting. Weed Sci. 48:53-60.
Kwon, T. J., D. L. Young, F. L. Young, and C. M. Boerboom. 1995. PALWEED:WHEAT: a bioeconomic decision model for postemergence weed management in winter wheat (Triticum aestivum). Weed Sci. 43:595-603.
Lindquist, J. L., J. A. Dielman, D. A. Mortensen, G. A. Johnson, and D. Y. Wyse-Pester. 1998. Economic importance of managing spatially heterogeneous weed populations. Weed Technol. 12:7-13.
Lyon, L. L., J. W. Keeling, P. A. Dotray, L. K. Blair, G. G. Wilkerson, and J. W. Wilcut. 2000. Validation of the cotton HADSS model for weed management on the Texas southern high plains. Proc. South. Weed Sci. Soc. 53:219-220.
MacDonald, G. E., D. C. Bridges, and B. J. Brecke. 1998. Validation of HERB computer decision aid model for peanuts. Proc. South. Weed Sci. Soc. 51:216.
McCarty, M. T., and H. D. Coble. 1983. Grass interference in peanuts and soybeans. Proc. South. Weed. Sci. Soc. 36:51
Mendelson, J. 1998. Roundup: the world’s biggest-selling herbicide. The Ecologist. 28:270-275.
Monks, C. D., D. C. Bridges, J. W. Woodruff, T. R. Murphy, and D. J. Berry. 1995. Expert system evaluation and implementation for soybean (Glycine max) weed management. Weed Technol. 535-540.
19
National Agriculture Statistics Service, USDA. 1997. Agriculture chemical usage; 1996 Field Crops Summary. Online resource. Accessed on 11 Sept 2005 at
http://usda.mannlib.cornell.edu/reports/nassr/other/pcu-bb/agch0997.txt
National Agriculture Statistics Service, USDA. 2004. Agriculture chemical usage; 2003 Field Crops Summary. Online resource. Accessed on 11 Sept 2005 at
http://usda.mannlib.cornell.edu/reports/nassr/other/pcu-bb/agcs0504.pdf
Nyrop, J. P., R. E. Foster, D. W. Onstad. 1986. Value of sample information in pest control decision making. J. Entomol. 79:1421-1429.
Owen, M.D.K. 2000. Current use of transgenic herbicide-resistant soybean and corn in the USA. Crop Prot. 19:765-771.
Pankey, J. H., J. L. Griffin, J. M. Ellis, G. G. Wilkerson, and A. C. Bennett. 2000. Validation of HADSS computerized decision aid in Louisiana soybeans. Proc. South. Weed Sci. Soc. 53:254.
Pasqual, G. M. 1994. Development of an expert system for the identification and control of weeds in wheat, triticale, barley and oat crops. Comp. and Elect. In Agriculture. 10:117-134.
Pline, W. A., J. W. Wilcut, S. O. Duke, K. L. Edmisten, and R. W. Wells. 2002. Tolerance and accumulation of shikimic acid in response to glyphosate applications in glyphosate-resistant and non glyphosate-glyphosate-resistant cotton (Gossypium hirsutum L.). J. Agric. Food Chem. 50:506-512.
20
Rankins, A., D.R. Shaw, and J.D. Byrd. 1998. HERB and MSU-HERB validation for soybean (Glycine max) weed control in Mississippi. Weed Technol. 12:88–96.
Ray, T. B. 1989. Herbicides as inhibitors of amino acid biosynthesis. In P. Boger and G. Sandmann. (eds.). Target Sites of Herbicide Action. Boca Raton, FL: CRC Press. pp. 112-114.
Renner, K. A., S. M. Swinton, and J. J. Kells. 1999. Adaptation and evaluation of the WEEDSIM weed management model for Michigan. Weed Sci. 47:338-348. Rew, L. J. and R. D. Cousens. 2000. Spatial distribution of weeds in arable crops; are
current sampling and analytical methods appropriate? Weed Res. 41:1-18.
Rew, L. J., G. W. Cussans, M. A. Mugglestone, and P.C.H. Miller. 1996. A technique for mapping the spatial distribution of Elymus repens, with estimates of the potential reduction in herbicide usage from patch spraying. Weed Res. 36:283-292.
Schönbrunn, E., S. Eschenburg, W. A. Shuttleworth, J. V. Schloss, N. Amrhein, J.N.S. Evans, and W. Kabsch. 1998. Interaction of the herbicide glyphosate with its target enzyme 5-enolpyruvylshikimate 3-phosphate synthase in atomic detail. Proc. Natl. Acad. Sci. 98:1376-1380.
Schribbs, J. M., D. W. Lybecker, and E. E. Schweizer. 1990. Bioeconomic weed
management models for sugarbeet (Beta vulgaris) production. Weed Sci. 38:436-444. Scott, G. H., S. D. Askew, J. W. Wilcut, and A. C. Bennett. 2002. Economic evaluation of
HADSSTM computer program in North Carolina peanut. Weed Sci. 50:91-100.
21
Shaner, D. L. 2000. The impact of glyphosate-tolerant crops on the use of other herbicides and on resistance management. Pest Manag. Sci. 56:320-326.
Shaw, D. R. 2005. Translation of remote sensing data into weed management decisions. Weed Sci. 53:264-273.
Sherwood, J. L., M. K. Beute, D. W. Dickson, V. J. Elliot, R. S. Nelson, C. H. Opperman, and B. B. Shew. 1995. Biological and biotechnical control in Arachis diseases. In Advances in Peanut Science H.E. Pattee and H.T. Stalker, (eds.). Am. Peanut Res. and Educ. Soc. Stillwater, OK. pp. 160-206.
Shew, B. 2005. Peanut disease management. In 2005 Peanut Information. North Carolina State University Coop. Ext. Ser. Series AG-331. pp. 79-101.
Sholar, J. R., R. W. Mozingo, and J. P. Beasley, Jr. 1995. Peanut cultural practices. In Advances in Peanut Science H.E. Pattee and H.T. Stalker, eds. Am. Peanut Res. and Educ. Soc. Stillwater, OK. pp. 354-382.
Snipes, C. E., J. E. Street, and T. C. Meuller. 1992. Cotton (Gossypium hirsutum) injury from simulated quinclorac drift. Weed Sci. 40:106-109.
Stalker, H. T., and C. E. Simpson. 1995. Germplasm resources in Arachis. In Advances in Peanut Science H.E. Pattee and H.T. Stalker, eds. Am. Peanut Res. and Educ. Soc. Stillwater, OK. pp. 14 - 53.
Steinrucken, H. C. and N. Amrhein. 1980. The herbicide glyphosate is a potent inhibitor of 5-enolpyruvylshikimic acid-3-phosphate synthase. Biochem. Biophys. Res. Commun. 94:1207-1212.
22
Sturgill, M. C., G. G. Wilkerson, J. W. Wilcut, A. C. Bennett, and G. S. Buol. 2003. HADSS 2003 User’s Manual. Raleigh, NC: Res. Bull. 192, Crop Science Department, NCSU. Swinton, S. M. and R. P. King. 1994. A bioeconomic model for weed management in corn
and soybean. Agric. Syst. 44:313-335.
Thomas, W. E., I. C. Burke, B. L. Robinson, W. A. Pline-Srnic, K. L. Edmisten, R. Wells, and J. W. Wilcut. 2005. Yield and physiological response of nontransgenic cotton (Gossypium hirsutum) to simulated glyphosate drift. Weed Technol. 19:35-42.
Thornton, P. K., R. H. Fawcett, J. B. Dent, and T. J. Perkins. 1990. Spatial weed distribution and economic thresholds for weed control. Crop Prot. 9:337-342.
Wauchope, R. D., E. P. Richard, and H. R. Hurst. 1982. Effects of simulated MSMA drift on rice (Oryza sativa). II. Arsenic residues in foliage and grain relationships between arsenic residues, rice toxicity symptoms, and yields. Weed Sci. 30:405-410/
Weisz, R., S. Fleisher, and Z. Smilowitz. 1995. Site specific integrated pest management for high value crops: sample units for map generation using the Colorado potato beetle (Coleoptera: Chrysomelidae) as a model system. J. Econ. Entom. 88:1069-1080.
White, A. D. and H. D. Coble. 1997. Validation of HERB for use in peanut. Weed Technol. 11:573-579.
Wilcut, J. W., A. C. York, W. J. Grichar, and G. R. Wehjte. 1995. The biology and
management of weeds in peanut (Arachis hypogaea). In H. E. Pattee and H. T. Stalker, (eds.) Advances in Peanut Science. Amer. Peanut Res. and Educ. Soc., Stillwater, OK. pp. 207-244.
23
Agricultural, Environmental, Economic, Regulator, and Technical Aspects. Lewis Publishers, Boca Raton. pp. 213-230.
Wiles, L. J., G. G. Wilkerson, and H. J. Gold. 1992a. Value of information about weed distribution for improving postemergence control decisions. Crop Prot. 11:547-554. Wiles, L. J., G. G. Wilkerson, H. J. Gold, and H. D. Coble. 1992b. Modeling weed
distribution for improved postemergence control decisions. Weed Sci. 40:546-553. Wiles, L. J., G. W. Oliver, A. C. York, H. J. Gold, and G. G. Wilkerson. 1992c. Spatial
distribution of broadleaf weeds in North Carolina soybean (Glycine max) fields. Weed Sci. 40:554-557.
Wiles, L. J., H. J. Gold, and G. G. Wilkerson. 1993. Modeling the uncertainty of weed density estimates to improve post-emergence herbicide control decisions. Weed Res.. 33:241-252.
Wiles, L. J. and M. Brodahl. 2004. Exploratory data analysis to identify factors influencing spatial distributions of weed seed banks. Weed Sci. 52:936-947.
Wiles, L.J. Sampling to make maps for site-specific weed management. 2005. Weed Sci. 53:228-235.
Wilkerson, G. G., A. J. Price, A. C. Bennett, D. W. Krueger, G. T. Roberson, and B. L. Robinson. 2004. Evaluating the potential for site-specific herbicide application in soybean. Weed Technol. 18:1101-1110.
Wilkerson, G. G., L. J. Wiles, and A. C. Bennett. 2002. Weed management decision
24
Wilkerson, G. G., S. A. Modena, and H. D. Coble. 1991. HERB: Decision model for postemergence weed control in soybean. Agron. J. 83:413-417.
Williams, E. J., and J. S. Drexler. 1981. A non-destructive method for determining peanut pod maturity. Peanut Sci. 8:134:141.
York, A. C., and H. D. Coble. 1977. Fall panicum interference in peanuts. Weed Sci. 25:43-47.
York, A. C., J. B. Beam, and A. S. Culpepper. 2005. Control of volunteer glyphosate resistant soybean in cotton. J. of Cotton Sci. 9:102-109.
25
CHAPTER 2
Modeling the Economics and Efficacy of Alternative Weed Scouting Methods in Peanut (Arachis hypogaea L.).
Abstract: On-farm trials were conducted in eight different peanut-producing counties of North Carolina in 2003 and 2004. A total of 16 unique fields were scouted, and weed species and density data were collected using four different scouting methods. The herbicide
decision support system HADSS was used to determine expected net return, yield loss ($ and %), and total treatment costs for each field. Net returns were averaged for optimal treatments in each field to determine the whole-field expected net return. Values of theoretical net return for the optimal treatment in each field ranged from $244 to $1,444 per ha, and averaged $867 per ha for all sixteen fields. Forty-four different weed species were found. The windshield method required the least amount of time to complete, but was also the least accurate when making herbicide recommendations. Using the whole-field estimate method, a wide range of weed species were observed that were not always documented when using the range or count method. The range method, while relatively accurate overall, was best when weeds numbered 35 or less. The range method was slightly more accurate at estimating broadleaf weed densities than grass or sedge weed densities. Herbicide recommendations using the count method were more accurate due to quality of data collected. The count method was also the most expensive method based upon the time required for completion (30 min). The theoretical maximum loss for fields scouted using the windshield method was as high as $528/ha. The windshield method resulted in accurate (top 10%) herbicide recommendations at least 82 and 77% of the time in 2003 and 2004,
26 Nomenclature: Peanut, Arachis hypogaea L.
Additional index words: decision support system, economic threshold, integrated pest management, weed management, weed interference, and weed scouting.
Abbreviations: DSS, decision support systems; HADSS, Herbicide Application Decision Support System; IPM, integrated pest management; POST, postemergence; PPI, preplant incorporated; PRE, preemergence; TNR, theoretical net return.
INTRODUCTION
Agronomic weeds tend to grow in patches (Cardina et al. 1997, Wiles et al 1992c), and postemergence (POST) herbicide recommendations are often made using limited knowledge about the overall spatial composition of weed species present in a particular field (Clay and Johnson 2002). Mistakes in herbicide decision-making can be costly to growers if
unnecessary herbicide expenses are incurred, or if a herbicide treatment is chosen that is not effective at controlling the weed spectrum in the field (Wiles et al. 1992b). Research has shown that accurate scouting procedures are important for choosing an economical and effective herbicide treatment plan (Gerhards and Christensen, 2003; Wiles et al. 1992b), and prove to be essential in profitable peanut (Arachis hypogaea L.) production (Jordan 2003). Additionally, the scouting procedures need to be specifically designed to account for the biology of weeds, and not simply adapted from other areas of research (Rew and Cousens 2000) such as entomology and plant pathology.
27
Pasqual 1994; Scott et al. 2002; White and Coble 1997; Wilkerson et al. 2002). HADSS,1 (Herbicide Application Decision Support Software) is designed to assist growers (and those advising them) in the selection process for PRE (preemergence) and POST herbicides based on efficacy and cost (Bennett et al. 2003; Wilkerson et al. 2002). The North Carolina version of HADSS is currently in use for corn (Zea mays L.), cotton (Gossypium hirsutum L.),
soybean [Glycine max (L.) Merr.], and peanut (Bennett et al. 2003; Sturgill et al. 2003). Herbicide recommendations generated by HADSS utilize economic thresholds (Cousens 1985), which incorporate projected yield and value of the crop, herbicide application costs, predicted yield loss if weeds are not controlled, and herbicide efficacy (Bennett et al. 2003). Basing herbicide applications on HADSS or its precursor HERB (Wilkerson et al. 1991) has been as effective as, and sometimes better than, prophylactic applications (Jordan et al. 1999; MacDonald et al. 1998; Scott et al. 2002; White and Coble 1997).
Actual weed populations and distributions cannot be determined until emergence; a busy time for growers, crop consultants, extension agents, and herbicide dealers. In many cases, weed control decisions are based upon past weed populations and/or the effectiveness of herbicide applications made in previous years. Research shows that postemergence herbicide applications based upon scouting data are often more effective at controlling weeds than are general herbicide applications based upon past programs (Jordan et al. 2003; Munier-Jolain et al. 2002). When weed scouting does occur, it is usually done quickly and from a limited vantage point in the field (roadside or field entrance) that may not capture the true
distribution and presence of weeds. Additionally, if weed spatial distributions are ignored,
HADSSTM. “Herbicide Application Decision Support System”. Copyright 1994-2005. North Carolina State
28
and users assume a regular distribution of weeds instead of an irregular population a DSS may over or underestimate yield loss or recommend an inappropriate herbicide treatment (Wiles et al. 1992a). Research has also shown that while the whole population tends to be clumped, populations of individual weeds are not evenly distributed over the whole field (Wiles et al. 1992c).
Proponents of integrated pest management (IPM) practices are focused on reducing inputs into a system in order to increase profitability and to decrease negative environmental
impacts. IPM methods use multiple control tactics to target pest biology (Buhler et al. 2000). HADSS uses economic thresholds to (1) suggest herbicide options, (2) rank herbicides based on efficacy, (3) recommend herbicide rates (often reduced), and (4) present an overall
estimated economic outlook for the system (inputs, losses, and income). In order for HADSS and similar programs to make accurate herbicide treatment recommendations, users must make a quick but accurate assessment of weeds present in the field. Early assessments of weed distribution and density are very important in row crops because of the potential yield loss from interference (Mutch and Michalak 1985)
Guidelines for specific weed scouting methods in peanut are limited in the literature. Attempts are being made to develop better scouting procedures in row crops that are less time intensive, but will still be cost effective (Gold et al. 1996; Jordan et al. 2003; Krueger et al. 2000; Wiles et al. 1992b). The more time spent scouting and gathering information in the field, the better the recommendation (Krueger et al. 2000; Wiles et al. 1992a); however grid sampling is not practical in production agriculture due to the cost associated with this level of scouting (Clay et al. 1999). Murdock and Murray (2002) found that estimating weed
29
to generate herbicide recommendations in combination with a DSS. Others have suggested that site specific and/or censored weed sampling techniques would reduce time, but still be accurate enough to generate herbicide recommendations (Johnson et al. 1996). The censored techniques include subjective weed sampling where species and densities are recorded (high, medium, or low) or quantitative sampling where there are arbitrary cutoff numbers set as the economic threshold value.
Due to the poor competitive ability of peanut and the need to efficiently dig and invert pods and vines prior to combining, weed management programs have relied heavily on
prophylactic and corrective herbicide applications (Wilcut et al. 1995). Although herbicide programs can be expensive, this approach to weed management has historically been successful in part due to the relatively high value of peanut at the farm level compared with the majority of other row crops. In light of recent changes in federal farm legislation, closer scrutiny of economic decisions regarding pest management at the farm level is needed (Bullen et al. 2002; Chvosta et al. 2002; Jordan et al 1999).
The objectives of this study were: (1) to obtain estimates for scouting times and quality of herbicide recommendations using four different scouting procedures, (2) to compare
herbicide recommendations made by the extension agent (and/or farmer) with those generated by HADSS, and (3) to acquaint extension agents with HADSS and obtain evaluations on performance.
MATERIALS AND METHODS
30
that ranged from 3-4 ha in size, obtaining permission from the grower to establish the scouting trials, and maintaining contact with the grower throughout the season. Fields were generally selected based upon the agents past experience working with the farmer, and the presence of weeds in the field at the time of scouting. Dell Axim2 handheld computers were purchased for each of the county agents, and agents attended at least one training session during the spring to learn how to use the computer and associated scouting programs. The agent and two research assistants visited the field approx. 3-4 weeks post-plant, and scouted weeds using four different methods; recording information on weed species, size and density. Weed populations were counted/estimated in the field in an area measuring approx. 9.3m2 (0.84m x 10m). The agent visited the field in two follow-up trips to record weed populations remaining after herbicides were applied by the grower. Fourteen of the sixteen (88%) fields were treated with PRE, preplant incorporated (PPI), and at-cracking herbicides prior to scouting (Table 1), while two of the sixteen fields received no herbicide treatment prior to scouting.
Based on input from local crop consultants and extension agents, four unique scouting methods were developed and used to obtain weed density estimates and counts from each field. The four methods were: Method 1 - (windshield): scouts stood at the entrance to the field; estimating and recording weed species and densities visible from that point. Method 2 - (whole-field estimate): Scouts walked through the field in a loop pattern and took note of weed species present as they walked. Weed densities were recorded after scouts completed the loop. Method 3 - (range): Scouts walked through the field in the same general loop pattern, stopping in six randomly selected areas of the field (18 different unique areas total).
31
At each stop, scouts independently estimated weed densities using a range of 1-5 (Table 2) for broadleaf, sedge, and grass weeds (where one is a very low population and five is a very high population). This method was intended to mimic the scouting methodology utilized by several commercial crop consultants in North Carolina (A. Averitt, personal communication, 2002). Method 4 - (count): Scouts walked through the field using the same technique from method 3, however scouts did not estimate weed populations, but rather counted individual weed species at each of the 6 stops. In 2004 the count method was performed twice in each field (method 4a and 4b) to provide an independent estimate of weed population densities (using counts from 18 locations within the field) against which data from all four scouting methods could be compared. For each method, all three scouts traveled together through the field, but scouted areas approximately 30 m apart (Figure 1). Times were recorded for each scouting method in each field.
The first step in data analysis was to determine the optimal treatment for each field and to estimate theoretical net return over herbicide investment (TNR) for all other possible treatments. HADSS Version 2005 was used to determine TNR for every potential
postemergence treatment for all 16 fields. TNR was based upon expected weed-free yield, herbicide prices, peanut selling price ($500/ton), weed competitiveness, and herbicide efficacies. Soil moisture (adequate in all fields), and weed size used in HADSS were based on conditions in the field at the time of scouting. Projected weed-free pod yield was
32
treatment. The treatment with the highest TNR averaged across all 18 scouting stops within a field was considered to be the optimal treatment. All treatments were ranked in terms of TNR calculated in this manner, and the loss for any treatment was calculated as the
difference between its TNR and that for the optimal whole-field treatment. In 2004, the data from the two separate scouting loops using Method 4 performed by each scout were used to provide independent estimates of TNR for each potential treatment.
The next step in data analysis was to obtain a treatment recommendation from HADSS using estimated weed densities from each of the three scouts using each scouting method. These recommendations were compared in terms of TNR, percent of times the
recommendation was in the top 10% of recommendations in TNR, and time required for completion. In 2003, only Methods 1, 2, and 3 were compared using TNR estimated using Method 4 data; in 2004, all four scouting methods were compared. Methods 1, 2, 3, and 4a were compared in terms of TNR estimated from data collected using Method 4b, then Methods 1, 2, 3, and 4b were compared using TNR estimated from data collected using Method 4a. A field average density was estimated for each weed species for Method 3 data by translating the index recorded for each scouting stop to the weed density shown in Table 2. The density estimates for all six stops were then averaged to provide a weed density estimate for each scout.
33
methodology using the count method in 2004, and counties were treated as a blocking factor. Log loss values were square root transformed to stabilize variances. Main effects and
interactions for the optimal net return were tested and reported for each scouting method. Mean separations were performed on transformed and non-transformed data using Fisher’s protected LSD test (p>0.05).
RESULTS AND DISCUSSION
Weed Populations. Forty-four different grass, sedge and broadleaf weed species in the cotyledon to 4 leaf stage were found across the 18 fields at the time of scouting (Table 3), and may represent weeds that are hard to control with soil-applied herbicides (Jordan 2005). Weed populations varied considerably from field to field; in Washington county in 2003 19 different species were found, whereas in Pitt county in 2004, only four weed species were found. Weed populations were considerably reduced with postemergence herbicide
treatments following the first scouting trip, and the agent rarely found weed densities which required herbicide treatment in subsequent scouting trips.
Scouting Time. Scouting fields for weeds increases the overall cost of weed control (Berti et al. 2003), so the time required to accomplish this task is important. Average scouting times for each of the methods are as follows: windshield method = 6 minutes per scout, whole-field estimate method = 15 minutes per scout, range method = 20 minutes per scout, count method = 28 minutes per scout (Table 4). The count method (Method 4) was the most precise
34
Scouting Accuracy. When weed densities were estimated by averaging the estimates from all three scouts in each field, the windshield, whole-field, and range scouting methods all tended to overestimate density slightly at low densities and underestimate density
substantially at high densities, compared to the count method (Figure 2). The windshield method gave less predictable density estimates than the other methods, as indicated by the very low R2 value. Density estimates made using count data from the two separate loops in 2004 (Methods 4a and 4b) were found to be highly correlated (Figure 2d). Colbach et al. (1999) found that random sampling (ranges or counts in this study) resulted in the best representation of the weed species present in the scouting process by not over- or under-representing species. It is surmised that the success of a particular sampling method depends on the actual distribution of weeds in the field: even the windshield method was relatively accurate in fields where weed populations were fairly uniform across the field, e.g., Hertford County in 2004 (data not shown). Research in North Carolina soybean fields (Wiles et al. 1992b) found that those with aversions to making risky herbicide recommendations should take the extra care to scout fields thoroughly, and to not assume that weeds are regularly distributed across a field. The addition of multiple weed species into the yield loss
calculations makes a decision much more complicated than in situations where only a single species is considered (Brain and Cousens 1990) because weeds compete with each other as well as with the crop (Cousens et al. 1984).
35
very high weed densities were underestimated using this method. Field average densities using count data ranged from 0.1 to 132, and from 0.1 to 98 weeds per 9.3 m2 for grass and broadleaf species, respectively. Although it might be possible to construct a rating system that gave a more accurate estimate of field average weed population densities, the ranges used in this study were designed to reflect those used by professional scouts in North Carolina which are based in part on a consideration of potential damage from a given weed population. Yield loss is not a linear function of density. For example, a broadleaf weed with a competitive index of 5 on a 0 to 10 scale is estimated by HADSS to cause a 64% yield loss with a density of 20 weeds per 9.3 m2 and a 72% loss with a density of 40.
It is interesting to note that the number of weed species observed in a given field varied from method to method. A larger number of weed species were found using Method 2 when scouts looped through the field, noting all species as they walked, than using either Method 3 or 4 when scouts stopped at a limited (18) number of places in the field, recording only the weeds found in those locations. When summed over all three scouts, average number of weed species found per field using each method was as follows: windshield method – 5.6; whole-field estimate method – 10.2; range method – 6.9; count method – 6.7. This finding suggests that the weeds in these fields were not uniformly distributed across the field. Rew and Cousens (2001) remark that weeds are unique in that there are usually several weed species that are present in large numbers, and a large number of species that are only present in very low numbers scattered throughout the field. It should be noted that the purpose of scouting is primarily to assist in making sound weed management decisions rather than solely to
36
sampling rapidly exceeds the value, when the objective is solely to make a herbicide decision (Wiles et al 1993; Krueger et al. 2000).
The spatial distribution of weeds is not the only possible source of sampling error that might occur when making postemergence herbicide decisions. Individual scouts also have a certain level of error depending on years of experience and tendency to over or underestimate actual weed populations (Wiles et al. 1993). Scouts may also unknowingly gravitate toward areas in the field with higher or lower weed densities.
Herbicide Recommendations. Research suggests that late season weed infestations may contribute to yield losses due to interference with harvest (Scott et al. 2002). In that research, net returns in 12 of 24 standard POST herbicide application systems were improved with the use of the HADSS system, and in all cases the net returns were at or above what would have been present for the traditional POST herbicide systems in North Carolina peanut. In the present study, intensive scouting efforts (range and count methods) significantly increased the accuracy of herbicide recommendations, and resulted in higher TNR than did scouting techniques that relied on field-wide estimates (windshield method).
Values of TNR for the optimal treatment in each field ranged from $244 to $1,444 per ha, and averaged $867 per ha for all sixteen fields (Table 5). As expected, counting weeds in a specific area (9.3 m2) resulted in slightly more accurate herbicide recommendations in most cases than did methods that involved estimates. Average dollars lost per ha in 2003
increased from $17 to $41 using the range and windshield methods respectively, and in 2004 from $15 to $56 using the range and windshield methods, respectively.
37
spatial variation in weed populations, scouting methods that involved walking through the field resulted in higher TNR and different herbicide recommendations than did the
windshield method where estimates were taken from only one vantage point. The theoretical maximum loss for these fields was quite high when based upon data collected using the windshield method, up to $528/ha (Table 5). This theoretical yield loss is high because the optimal herbicide treatment would not have been chosen using that scouting data, and weed pressure would have decreased peanut yields. Obviously, these losses are artificial in that they assume no corrective action will be taken even in the event of catastrophic herbicide failure. Other long-term research has confirmed that threshold-based weed management strategies prove to be more cost effective than spraying the typical herbicide regime every year (Munier-Jolain et al. 2002).
38
agent/grower recommendations that occurred in the top 10% of the HADSS recommendations.
HADSS Evaluation. One of the aims of this research was to increase awareness of HADSS in the local agricultural community. Extension personnel involved with this project were quite experienced with peanut production, and had been involved with the profession for an average of 18 years. Agents were encouraged to provide feedback on the utility of the program, grower perceptions of the program, as well as the user-friendliness of the handheld computers via survey questions (Appendix 1.)
Overall, agents regarded the HADSS program favorably, and following extensive training sessions and several seasons of practical use in the field, were quite competent with using the program to give recommendations. In general, agents thought that HADSS was useful, and was best used for early season decision-making in peanut. Additionally, agents remarked that the program was especially useful during the growing season because it was mobile, and they were better prepared to answer questions from growers in person or over the telephone because they always had access to the program. Both agents and growers expressed
39
possible that the scale used for the range method (Table 2) and the resulting calculations that were necessary for recording differences between the values for grasses and broadleaves might have been confusing to the scouts. Increased familiarity with this scouting method in Year 2 decreased time required to scout each field by half (Table 4).
Research has shown that adoption of information technology into farming systems is slow, but more successful when mediated by extension personnel (Kuhlman and Brodersen 2001). Research with Texas cotton growers showed that most growers were involved with some IPM practices, and average net return from the farm increased as the number of IPM
practices increased (Thomas et al. 1990). Other research has shown that peanut farmers are more likely to accept new ideas in the area of IPM when they are given the chance to learn the concepts in person (Troost et al. 1992). There were positive correlations between
acceptance of the IPM program and age, level of education, and familiarity with the new IPM concepts. Several agents confirmed this in the questionnaire; stating that in order to increase farmer use of HADSS, they would need to be able to use the program first-hand to see the results (Appendix 1). Feedback from this study showed that growers are less likely to use a DSS for herbicide decision making on the farm, but would rather rely on their own
knowledge or consult respected professionals like extension agents or crop consultants. Agents also mentioned that although the growers were very interested in the methods and results of this study, they were unlikely to make significant changes from their current practices. Growers were also concerned over weed escapes in portions of the field if current populations did not warrant treatment, as well as the time required for scouting.
40
cost, the cost of handheld computers at this time might be prohibitive of widespread adoption of HADSS use in the field.
There was enough interest in this research that users asked for more programs to be developed that could be installed on the handheld computer and incorporated into their profession. Future proposed improvements include the capability for long-term storage of HADSS on an SD memory card that would preserve the program in the event of a low battery, and also facilitate easier software updates. At the conclusion of the study, users requested additional updates to the program and continued to request yearly updates (including herbicide price changes and weed additions) to the program. Agents also mentioned that a weed identification program rich in photographs would be helpful as they were scouting fields and entering information into HADSS.
In summary, scouting efforts, whether minimal or extensive, almost always improved herbicide decisions and resulted in greater TNR’s to the grower. More in-depth scouting efforts may be slightly more costly, but will most likely pay for themselves due to higher net returns, improved weed control, and reduction in risk. The effectiveness of utilizing different scouting procedures may vary between fields, and the value of more intensive scouting methods depends upon the weed spectrum present. In this study, it was shown that even when minimal scouting efforts were made using method 1, herbicide recommendations were almost always within 10% of the optimal recommendation. Theoretical losses as high as $528 per hectare were observed in situations where the optimal herbicide treatment was not selected.
41
Applying herbicides only when economically justified, and selecting the most appropriate treatment based upon efficacy data may increase the profitability of peanut production systems and is certainly more responsible to the environment. Additionally, programs such as HADSS allow users to examine herbicides within another class or family of herbicides, which is important in light of recent concerns about resistance issues.
ACKNOWLEDGMENTS
The author wishes to thank the peanut growers of North Carolina and Cooperative Extension Service Field Faculty: Al Cochran, James Pearce, Richard Rhodes, Byron
Simonds, Paul Smith, Lewis Smith, Charlie Tyson, Sam Uzzell, and Frank Winslow for their scouting assistance. Additionally, gratitude is expressed to Cavell Brownie, professor in the Department of Statistics, for her statistical support. Appreciation is expressed to the USDA-CSREES for financial funding of this project.