Optimization Based Approach for Land,
Water and Human Resources Management: A
Comparative Study
Dr. Mutnuru Srinivasa Rao1, Prof. Quamrul Hassan2
Lecturer (Group ‘A’), Department of Civil Engineering, AryaBhatt Institute of Technology (ABIT), DTTE, Government of Delhi, Delhi, India1
Professor, Faculty of Engineering and Technology, Jamia Millia Islamia, New Delhi, India2
ABSTRACT: The study area Nuh region, Haryana state, India, lies between 270 59' 30.4" to 280 13' 40.3" North Latitude and 760 57' 20.5" to 770 10' 58.38" East longitude. It has predominant rural demography with agriculture and agro-based dairy & poultry business as back bone to its economy. Analysis of the existing scenario of the study area in terms of water, land and human resources was carried out to identify key parameters. These were used as input to MATLAB based optimization modelto obtain optimal cropping policy and corresponding water and human labour requirementswith emphasis on food and nutritional security, employability, environmental concerns and agro-based business of the region. A comparative study among the policies, which were obtained from different objectives viz.:1. Maximization of net benefits; 2. Minimization of water use; 3. Minimization of emissions; and 4. Maximization of human labour employment, have been carried out.
KEYWORDS: MATLAB, Optimization, Maximization, Minimization, Food Security, Objectives, Net Benefits.
I. INTRODUCTION
The importance of agriculture sector in sustaining economic growth in developing countries, with limited cultivable land & growing population pressure, has been recognized way back in 1970’s during Green Revolution. During this period continuous expansion of farmland and dual cropping policy on existing farmland took place in Haryana and Punjab [1, 2].In India, the scope for horizontal expansion of land was virtually exhausted and the entire rainfall is uncertain and occurs within a short span of few days (within about 300 hours). Therefore, expansion of irrigation facilities, multiple sequences of crops, optimal cropping and water use policies are becoming critical requirements in agricultural sustainability [3, 4]. Food and Agriculture Organization (FAO) [5] has enunciated that the agriculture is an important engine of growth of rural economy and poverty reduction, yet this sector is underperforming in many countries.Department of Agriculture and Cooperation (DoAC) of Ministry of Agriculture, GOI in its report on State of Indian Agriculture [6] reiterated thatagriculture is a critical sector of the Indian economy&forms the resource base for a number of agro-based industries and agro-services. FAO [7] advocated that integration of approaches according to local conditions, optimal utilization of natural resources and maximizing benefits & minimizing trade-offs should be given higher priority to achieve the goals of reducing poverty and malnutrition as well as sustainable inclusive growth. Attempts have been made by various researchers (list exhaustive) [8, 9, 10, 11, 12, 13] to study the optimal allocations of land, water, and other resources, multiple crop models in irrigated agriculture and are of the opinion that linear programming is one of the best tools for optimal allocation of resourceswhere various crops are competing for a limited quantity of land and water resources. Rao [14] has reviewed that at least four Nobel prizes were awarded for contributions related to linear programming.
problems and requirements of the study area were studied.In the second stage, the data pertaining to land resources, water resources, human resources and other aspects were collected and procured and analysed to compute the key parameters. In the third stage, optimization model, comprises of objective function(s) and constraints conforming to the needs of the study area, was developed. Analysis was carried outusing MATLAB.
II. RELATED WORK
IDENTIFICATION OF STUDY AREA
Mewat is one of the 21 districts of Haryana state of India. It was carved out as the 20th district from erstwhile Gurgaon and Faridabad districts on 4th April 2005 with its head quarter at Nuh. Nuh region falls under the Sub-Tropical, Semi-arid climatic zone with hot temperature mainly characterized by extreme dryness of air in summer. It is the land of a community locally called as “Meos” and is predominantly rural in demography. The main occupation of the people of this region is agriculture and agro-based dairy business. Domestic, agricultural and agro-based industrial needs including livestock demands are major demands of the region. As there is no river in Nuh region its agriculture is based on rain fed, canal water & groundwater.Potable drinking water is a problem in the region. Water supply was augmented by Rajiv Gandhi Ranney Well Drinking Water Supply Augmentation Project (known as ranney well project) scheme [13, 15, 16, 17].The groundwater levels of the Mewat district from the year 1974 to 2006 showed a negligible (0.03 m/year) declining trend of water level (Arya 2011). There are 22 observation wells in Nuh region that are identified. In Nuh regions sand layers are few and the whole lithology is made up of clay and kankar and whereas electric conductance varied between 358 to 9210 micromhos/cm at 250 C in the study area. The shallow groundwater up to a depth of 20 m was by and large fresh and fit for irrigation. Some parts were affected by water logging condition near Nuh, Malab and Akaira villages. It is also observed that water logging conditions are more in post-monsoon season resulted in salinity and thus declining agricultural production. Quality of groundwater varies widely within a small area and CGWB recommended micro level survey by taking every village as a unit. Also observed that salinity in the area has led to formation of silty-clay (Sand: 0-20; silt: 40-60; clay: 40-60) soil and its salt affected variety is called solonchak [17, 18, 19].
DATA ACQUISITION & ANALYSIS
Assessment of Water Resources & Requirements
This consists of assessing total water resources available for the study area and computing total water demands for all sectors excluding irrigation. For the study area, available water resources are divided into four categories: (i) Canal water resources, (ii) Net groundwater available, (iii) Run-off water and (iv) Ranney well water. Similarly, Water demands excluding irrigation are evaluated into four categories: (i) Basic water requirement, (ii) Livestock and poultry requirement, (iii) Industrial requirement and (iv) Water for future allocations. The difference between total water available and total demands excluding irrigation is computed and used as total water available for irrigation in the model. The water input contains both surface water and groundwater and used as surface water input and groundwater input. Further water requirements of each crop are computed and used as input to the model.
Assessment of canal water resources
Net canal water availability for irrigation have been computed by deducting seepage losses (during conveyance) & other losses from gross water supply at the head of canal. Water supply at the head of the canal is obtained by multiplying discharge, in cumecs, and operating time in seconds. Seepage losses were calculated according to the case of Ghaggar basin canal systems seepage losses computed by Tyagi [21], Yangchan [22], Maitry [19] and Rao [13]. Other losses assumed as 20% [19], [13].All the computations related to estimation of total canal water availability in monsoon and non-monsoon seasons of all canals and computations have been done using MATLAB.
Assessment of groundwater resources
The groundwater balance equation used by Khare [8], Rao[9, 13] and Maitry[19]was used. Net groundwater availability obtained from CGWB reports on groundwater resource and development potential of the study areaMaitry [19]and up to 60% development of net groundwater availability considered as safe category is adopted in thestudy.
Assessment of runoff-water
Assessment of runoff water of the study area is estimated by using the empirical equations already developed by Uttar Pradesh Irrigation Research Institute (UPIRI) [23].
Ranney well water
At present Rajiv Gandhi drinking water supply augmentation project supplying about 55 lpcd of water to 28 villages of Nuh region. Ranney Well Water available for these identified villages of the region is computed for the prospective population of the year 2011.
Basic Water requirements
Different organizations, agencies and individuals have given different norms of water requirements and 100 lpcd (including UFW) is assumed for computing basic water requirements of the study area [13].
Livestock & poultry water requirement
Actual values of water requirements of livestock and poultry depends on many variable such as climate and cultural practices and different agencies recommended different quantities and 30 lpcd is used for assessing livestock (cattle) and 20 lpcd per 100 for poultry water requirement of the study area [13]
Industrial and future allocations
Growth rate demand of 7% [13] for future allocations of water for industrial needs was assumed.
Assessment of water requirements of crops
Food and Agriculture Organization (FAO- 56) methodology was used to compute the amount of water needed by the various crops to grow optimally.
Land Resources
The area under different crops during present study duration for both kharif and rabi seasons, irrigated and non-irrigated areas, socio economic characteristics of the farmers and crop production activities in terms of inputs, outputs and their prices, other related information constituted the bulk of the data collected and obtained from Office of Deputy Director of Agriculture and Office of Chief executive officer (CEO), Nuh, Mewat.
Human Resources
Environmental aspects
Emissions as N2O&CO2and CO2 Equivalents (CO2e)
Intergovernmental Panel on Climate Change (IPCC) and Inter International Food Policy Research Institute (IFPRI) guidelines were used to compute N2O and CO2emissions. The international standard practice is to express greenhouse
gases in carbon dioxide (CO2) equivalents or CO2e [25,13]
Minimum area required
Indian Council of Medical Research’s (ICMR) & National Food Security Act (NFSA) guide lines were used compute the minimum cropping area required for different crops [26, 27].
III. DEVELOPMENT OF MODEL FOR DIFFERENT OBJECTIVES
OBJECTIVE 1
Maximization of Net Benefits
nd j nc i i j i j A NR Z MAX 1 1 , , )(
...(
1
)
nc= number of crops
nd= number of divisions (villages) of the study area (=119) NBj,i= net benefits from ith crop of jth division (village)
Aj,i= area of ith crop of jth division(village)
OBJECTIVE 2
Minimization of Water Use
nd j nc i i j i j A NIR Z 1 1 ,,
(
2
)
i j
NIR, Net Irrigation Requirement of ith crop of jth village
OBJECTIVE 3
Minimization of Emissions
nd j nc i i j i j A FU Z 1 1 , ,)
3
(
i jFU
, Fertilizer Use of ith crop of jth villageOBJECTIVE 4
Maximization of Human Labour Employment
nd j nc i i j i jA
HLR
Z
1 1 ,,
(
4
)
i j
HLR
, Human Labour Requirement (in man-days) of i thcrop of jth village
CONSTRAINTS
1. Total water required by all crops shall be less than or equal to total available water in that year.
2. Groundwater draft is always less than or equal to net groundwater available
3. Total irrigated area in Kharif season shall be less than or equal to cultivable area in kharif season
4. Total irrigated area in Rabi season shall be less than or equal to cultivable area in Rabi season
5. Total emissions (as CO2 from groundwater pumping) from optimal cropping pattern shall be less than or equal
to total emissions from existing cropping pattern
7. Minimum area under each crop should be such that it shall satisfy food and nutritional requirements of study area
8. Maximum area under each crop should be such that it shall satisfy storage and marketing requirements of the area
9. Total domestic water required (DWR) for the population of the region should be less than or equal to total water allocated for domestic water use consumption
10. Total water required for livestock water use should be less than or equal to total water allotted for livestock water use consumption
11. Total water required for Industrial water use should be less than or equal to total water allotted for Industrial water use consumption
12. Total net benefits from the proposal shall be greater than or equal to the total benefits from existing condition.
13. Total human labour employment generated by the policy shall be greater than or equal to the human labour employment generated by the existing condition.
IV. ANALYSIS OF THE MODEL& DISCUSSIONS
MATLAB Based Optimization Model
Linprog(linprog.m) module of MATLAB was used for analysing the developed optimization LP model for various objectives.The particulars of ‘linprog’ are briefly described in following sections and syntax is tabulated in Table 1.
linprog:It solves linear programming problems specified by
such x
fT
x
min that
ub x lb
beq x Aeq
b x A
)
5
(
Table 1: Syntax of “linprog”
A The matrix of coefficients of linear inequality constraints: Ax b b Vector of coefficients of corresponding right-side vector: Axb Aeq The matrix of coefficients of linear equality constraints:
Aeq
x
beq
Beq Vector of coefficients of corresponding right-side vector:
Aeq
x
beq
f The vector of coefficients for the linear term in the linear equation
f
T
x
x Vector of design variables
lb, ub Lower and upper bound vectors (or matrices).
Objectives 1 & 4 are of maximization (coefficients of objective function are"−") and objectives 2 & 3 are of minimization(coefficients of objective function are" + "). These objectives were subjected different constraints as discussed above (inequality constraints-"≥"&"≤"). These arefurther subjected to four conditions- A, B, C and D based on cropping areas as given below.
Condition A:
i. lb ≥ area based on food requirements ii. ub ≤ area based on storage requirements
Condition B:
i. lb ≥ 0 ii. ub- no bounds
Condition C:
i. lb ≥ 0 ii. ub- no bounds (except tomato ≤ 100)
Condition D:
i. lb ≥ area based on food requirements ii. ub- no bounds (except tomato ≤ 100)
While analyzing the model solutions were obtained in such a way that all constraints including conditions (A, B, C and D) and sub-conditions were satisfied and exitflag remained ‘1’ (exitflag=1 means solution optimal). The results are presented in Table no’s 2, 3, 4 and 5. Area in ha, Water Use in ha.m, Net benefits in Million , labour in man-days and N2O in kg per year.
Table 2- Proposal based on Maximization of Net Benefits
Crop Name Area Water Use Net Benefits Labour N2O
Paddy 1996.00 2385.22 54.591 381236 719 Pearl Millet 12583.00 3661.65 94.624 1509960 15729 Sorghum 16808.00 857.21 103.873 2134616 16808 Fodder 2584.00 279.07 11.085 328168 2584 Dhaincha 100.00 22.00 0.298 8200 20 Kharif Pulses 1856.00 974.40 37.120 152192 371 Barley 15296.88 6103.46 334.543 2921704 15297 Mustard 1980.00 845.46 30.710 237600 1980 Tomato 100.00 69.00 8.608 12700 300 Wheat 14631.12 8778.67 418.889 1858152 21947 Berseem 2349.00 845.64 10.805 192618 2349 Rabi Pulses 1570.00 832.10 34.540 128740 314 Total 71854.0 25653.88 1139.686 9865886 78417
Table 2 depicts the details of optimal cropping areas of different proposed crops that can be irrigated and corresponding water use details, net benefits, labour employment and emission details for the proposal based on maximization of net benefits.
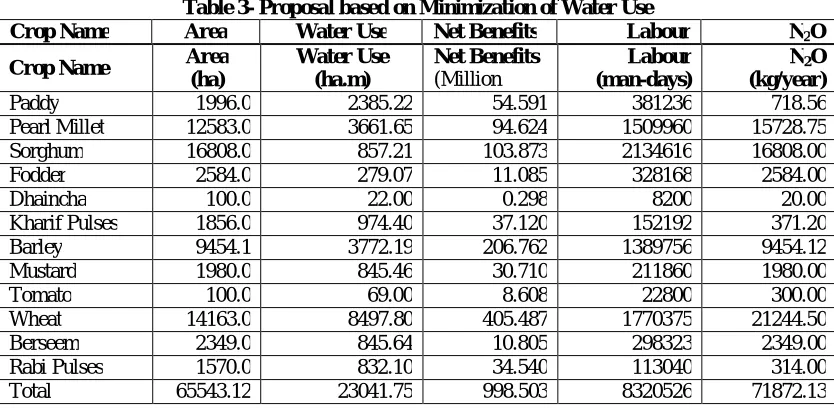
Table 3- Proposal based on Minimization of Water Use
Crop Name Area Water Use Net Benefits Labour N2O
Crop Name Area
(ha)
Water Use (ha.m)
Net Benefits
(Million )
Labour (man-days)
N2O
(kg/year)
Paddy 1996.0 2385.22 54.591 381236 718.56 Pearl Millet 12583.0 3661.65 94.624 1509960 15728.75 Sorghum 16808.0 857.21 103.873 2134616 16808.00 Fodder 2584.0 279.07 11.085 328168 2584.00 Dhaincha 100.0 22.00 0.298 8200 20.00 Kharif Pulses 1856.0 974.40 37.120 152192 371.20 Barley 9454.1 3772.19 206.762 1389756 9454.12 Mustard 1980.0 845.46 30.710 211860 1980.00 Tomato 100.0 69.00 8.608 22800 300.00 Wheat 14163.0 8497.80 405.487 1770375 21244.50 Berseem 2349.0 845.64 10.805 298323 2349.00 Rabi Pulses 1570.0 832.10 34.540 113040 314.00 Total 65543.12 23041.75 998.503 8320526 71872.13
Table 4- Proposal based on Minimization of Emissions (i.e. Fertilizer Use)
Crop Name Area
(ha)
Net Benefits
(Million )
Water Use (ha.m)
Labour (man-days)
N2O (kg/year)
Paddy 1996.0 54.590 2385.22 381236 718.56 Pearl Millet 12583.0 94.624 3661.65 1509960 15728.75 Sorghum 5966.1 36.870 304.27 757689 5966.06 Fodder 2584.0 11.085 279.07 328168 2584.00 Dhaincha 100.0 0.297 22.00 8200 20.00 Pulses 10602.7 212.053 5566.40 869418 2120.53 Barley 279.0 6.101 111.32 41013 279.00 Mustard 1980.0 30.709 845.46 211860 1980.00 Tomato 100.0 8.608 69.00 22800 300.00 Wheat 14163.0 405.486 8497.80 1770375 21244.50 Berseem 2349.0 10.805 845.64 298323 2349.00 Rabi Pulses 5785.0 127.269 3066.05 416520 1157.00 Total 58487.71 998.503 25653.88 6615562 54447.40 Labour Male/Day 17352 Labour Female/day 5784
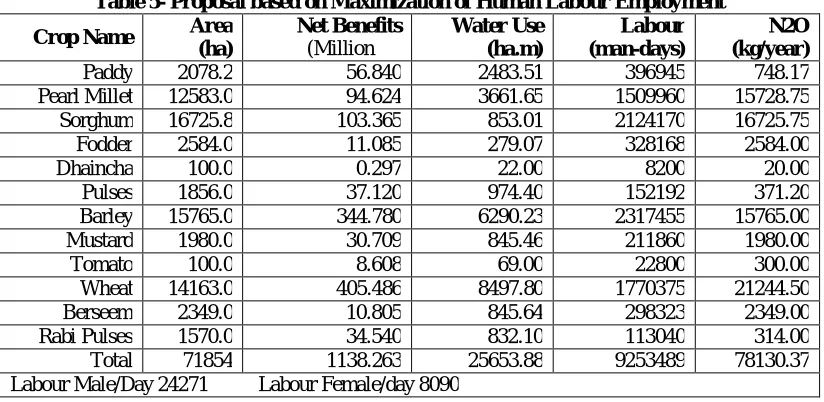
Tables 4 and 5 depicts details of optimal cropping areas, net benefits, water use, human labour employment and emissions as N2O for the proposals based on minimization of emissions and maximization of human labour
employment respectively.
Table 5- Proposal based on Maximization of Human Labour Employment
Crop Name Area
(ha)
Net Benefits
(Million )
Water Use (ha.m)
Labour (man-days)
N2O (kg/year)
Paddy 2078.2 56.840 2483.51 396945 748.17 Pearl Millet 12583.0 94.624 3661.65 1509960 15728.75 Sorghum 16725.8 103.365 853.01 2124170 16725.75 Fodder 2584.0 11.085 279.07 328168 2584.00 Dhaincha 100.0 0.297 22.00 8200 20.00 Pulses 1856.0 37.120 974.40 152192 371.20 Barley 15765.0 344.780 6290.23 2317455 15765.00 Mustard 1980.0 30.709 845.46 211860 1980.00 Tomato 100.0 8.608 69.00 22800 300.00 Wheat 14163.0 405.486 8497.80 1770375 21244.50 Berseem 2349.0 10.805 845.64 298323 2349.00 Rabi Pulses 1570.0 34.540 832.10 113040 314.00 Total 71854 1138.263 25653.88 9253489 78130.37 Labour Male/Day 24271 Labour Female/day 8090
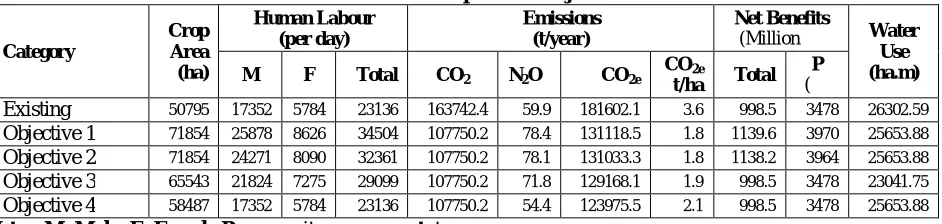
The proposals based on different objectives were compared in Table 6 and it was observed that all the proposals were performing better than the existing scenario. The proposal based on maximization of net benefits projected to irrigate 41.45, 0, 9.63 and 22.85 percent more than existing, objective 2, 3 and 4 respectively. It was also observed that proposal based on objective 1 expected to provide 49.13, 6.62, 18.57 and 49.13 percent more employment opportunities than existing, objectives 2, 3 and 4 respectively to the available population of the study area. In respect of emissions as CO2e (tonne/ ha) proposal based on objective-1 anticipated to emit50, 0, 5.2 and 14.3 percent less emissions than
all objectives, which was 2.46 percent less than that of existing condition. It was assessed that objective 3 utilized 10.18 percent less water than allocated.
Table 6- Model output of all objectives
Category
Crop Area
(ha)
Human Labour (per day)
Emissions (t/year)
Net Benefits
(Million ) Water Use (ha.m)
M F Total CO2 N2O CO2e
CO2e
t/ha Total P ( )
Existing 50795 17352 5784 23136 163742.4 59.9 181602.1 3.6 998.5 3478 26302.59
Objective 1 71854 25878 8626 34504 107750.2 78.4 131118.5 1.8 1139.6 3970 25653.88
Objective 2 71854 24271 8090 32361 107750.2 78.1 131033.3 1.8 1138.2 3964 25653.88
Objective 3 65543 21824 7275 29099 107750.2 71.8 129168.1 1.9 998.5 3478 23041.75
Objective 4 58487 17352 5784 23136 107750.2 54.4 123975.5 2.1 998.5 3478 25653.88
Note:- M: Male F: Female P: per capita per annum t: tonne
V. CONCLUSION
Out of all the policies evolved based on different objectives, as discussed earlier, the policy based on maximization of net benefits (i.e. objective 1) performed better in optimal utilization of land, water and human resources. Thus evolved policy suggests optimal utilization of land resources by providing maximum cropping area to suitable required crops, optimal utilization of water resources, fulfilment of food security requirements of the region with increased cropping areas of required crops, fulfilment of nutritional security of the region to help poverty alleviation andeliminating malnutrition, consideration of demands of livestock requirements and hence thrust on agro-based business, consideration of human labour employment and social development, consideration of Environmental concerns to reduce emissions of greenhouse gases to reduce global warming phenomena and more net benefits infers increased per capita and enhancement of financial status of the people of the region
REFERENCES
[1] Abrol, I.P., “ Sustaining rice-wheat system productivity in the Indo-Gangetic plains: watermanagement-related issues.” Agric. Water
Manage., 40, 31-35, 1999:.
[2] Karshenas, M., “International resources flows and development” In Economic Crises I and Third world Agriculture, Ed., Singh, A. and
Tahurabai, H., Academic Press,London, 1993.
[3] Mohan, L., “Economic efficiency of cropping pattern under different sources of irrigation”, thesis of Master of Science (Agriculture),
Dep. of Ag. Economics, University of Agricultural Sciences, Dharwad, 2005.
[4] Rao, K. H., “Contribution of irrigation to factor productivity in agriculture”,, Ind. J. of Agricultural Economics, 47(3): 497, 1992.
[5] FAO, “The role of women in agriculture”, ESA working paper on 11-02, Ag. Eco. Dev. Division, the Food and Agriculture Organization
of United Nations, retrieved from www.fao.org/economic/esa,2011.
[6] DoAC, “Annual report on State of Indian Agriculture 2011-12 of Department of Agriculture and Cooperation (DoAC)”, Ministry of
Agriculture, Government of India (server-3\3832AGRI\Final Report SIA-Press\Index) retrieved from http://agricoop. nic.in/ SIA 11
1213312.pdf, 2012.
[7] FAO, “Climate Smart Agriculture”- source book, Food and Agriculture Organization of United Nations, 1-545, retrieved from
http://www.fao.org / docrep /018 / i3325e/i3325e.pdf, 2013.
[8] Khare, D., “Distributed modeling of conjunctive use in a canal command”, PhD thesis, department of civil engineering, IIT Roorkee,
India, 1994.
[9] Rao, M. S., “conjunctive use planning of water resources- a case study”, unpublished M.E. thesis, Department of civil engineering and
applied mechanics, SGSITS, DAVV, Indore, India, 1996.
[10] Sethi, L., Nageshkumar, D., Panda, S. N., and Mal, B. C., “Optimal crop planning and conjunctive use of water resources in coastal river
basin, water resources management”, Kluwer Academic management, 16: 145-169, 2002.
[11] Karamouz, M., Zahraie, B., Kerachian, R., and Eslami, A., crop pattern and conjunctive use management: a case study, ASCE J. of
Irrigation and Drainage, 59(2), 161-173, 2008.
[12] Rao, M. S., Hassan, Q., and Ahsan, N., “Management of water resources in evolving sustainable agricultural planning policies for Nuh
region, Haryana, India, I. J. of Environmental Research and Development (IJERD), 3(7), 26-29, 2013.
[13] Rao, M. S., GIS and Remote Sensing based Approach for Sustainable Water Resources Management, unpublished PhD thesis, Faculty of
[14] Rao, S. S., “Engineering optimization- theory and practice”, John Wiley & Sons Inc., New Age International (P) Ltd., Publishers, New Delhi, India, 129-130, 2000.
[15] DDMP, “District Disaster Management Plan, report of deputy commissioner, Mewat-Nuh”, 1-74, retrieved from
http://revenueharyana.gov.in/ html/ disastermgt/ddmp / DDMP _ Mewat.pdf, 2011.
[16] CDAP, “Comprehensive District Agriculture Plan for rashtriya krishi vikas yojana of 11th five year plan”, retrieved from
http://www.rkvyharyana.com/Files/ CDAP/ Mewatcdap.pdf, 2010
[17] CGWB, “Central Ground Water Board: water year 2007”, Ground water information booklet, Mewat district, Haryana, India, retrieved
from http:// cgwb. gov.in/District_Profile/ Haryana/ Mewat.pdf, 2007.
[18] Arya, V. S., Sultan Singh, Rao, G. S. and Hooda, R.S., “Sub-Soil Water Quality Studies Using Remote Sensing and GIS”, I. J. of Sci.
Tech. 6, 71-76, retrieved from www.ewijst.org, 2011.
[19] Maitry, R. S., “Allocation of water resources for optimal cropping pattern- a case study”, Water Technology Centre, Indian Agricultural
Research Institute, Pusa, Delhi, 2010.
[20] CASA,“Stakeholder consultation on resource use dynamics and technology needs- the case of Mewat”, Haryana, India, retrieved from
http://www. agricasa.org.in/ pdf/CASA_Workshop1.pdf, 2011.
[21] Tyagi, N. K., Srinivasulu, A., Kumar, A., and Tyagi, K. C., “Modeling of conjunctive use water resources”. Hydraulics and economic
revolution, Bulletin no:6/50, CSSRI, Karnal, India, 43-43, 1995.
[22] Yangchan, J., Kumar, V., Kaledhonkar, M. J., and Kothari, M., “Water balance approach to assess water availability for irrigation”, J. of
water management, 24(2), 79-91, 2006.
[23] UPIRI, “Uttar Pradesh Irrigation Research Institute: Rainfall-runoff studies for a few Himalayan and Bundelkhand catchments of Uttar
Pradesh”, TM 30-RR (HY-31), 1960.
[24] Kaur, B., Sidhu, R. S., and Vatta, K., “Optimal crop plans for sustainable water use in Punjab”, Ag. Eco. Res. Rev. 23, 273-284, retrieved
from http://ageconsearch . umn.edu/ bitstream/96936/2/8-B-Kaur.pdf, 2010.
[25] IFPRI,“Greenhouse Gas Mitigation issues for Indian Agriculture, International Food Policy Research Institute (IFPRI) sustainable
solutions for ending hunger and poverty”, supported by Consultative Group on International Agricultural Research (CGIAR), Environment and Production Technology Division, IFPRI discussion paper 00900, 1-60, retrieved from http://www.ifpri.org /sites / default/files/ publications/ ifpridp00900.pdf, 2009.
[26] NFSA, “The National Food Security Act, 2013”, The Gazette of India, Part II Section I notification dated 10th September 2013 retrieved
from http://indiacode.nic.in/acts-in-pdf/202013.pdf, 2013.
[27] ICMR, Nutrient requirements and recommended dietary allowances for Indians: A report of the expert group of Indian Council of Medical