Abstract— A real time implementation of Fuzzy logic controller (FLC) for a spherical tank to control liquid level is studied. Control of liquid level in a spherical tank is highly non-linear due to variation in the area of cross section of level system with change in shape .System identification of spherical tank system is done using black box model which is identified to be non-linear and approximated to be a First order plus dead time model .Here the conventional controller parameters are designed based on Ziegler-Nicholas method and its servo and regulatory responses are compared with Fuzzy logic controller based on Mamdani model. From the response curve, obtained using the above controllers, that fuzzy logic controller gives much improved performance which is measured in terms of overshoot, rise time, set point tracking and performance indices when compared to other conventional controllers
Index Term— Fuzzy Logic Controller, PI Controller, Spherical Tank, System Identification
I. INTRODUCTION
The industrial application of liquid level control is tremendous especially in refineries petroleum and chemical process industries. Usually, level control exists in some of the control loops of a process control system. An evaporator system is one example in which a liquid level control system is a part of control loop. Evaporators are used in many chemical process industries for the purpose of separation of chemical products. Level control is also very important for mixing reactant process. The quality of the product of the mixture depends on the level of the reactants in the mixing tank. Mixing reactant process is a very common process in chemical process industries and food processing industries. Many other industrial applications are concerned with level control, may it be a single loop level control or sometimes multi-loop level control. In some cases, level controls that are available in the industries are for interacting tanks. Hence, level control is one of the control system variables which are very important in process industries. Nowadays, chemical engineering systems are also at the heart of our economics. The process industries such as refineries petrol, petro-chemical industries, paper making and water treatment industries require liquids to be pumped, stored in tanks, and then pumped to another tank. In the design of control system, one often has a complicated mathematical model of a system that has been obtained from fundamental physics and chemistry. The above mentioned industries are the vital industries where liquid level and flow
control is essential. Many times the liquids will be processed by chemical or mixing treatment in the tanks, but always the level fluid in the tanks must be controlled, and the flow between tanks must be regulated. Level and flow control in tanks are the heart of all chemical engineering systems
The controller designed using fuzzy logic implements human reasoning that has been programmed into fuzzy logic language (membership functions, rules and the rules interpretation). It is interesting to note that the success of fuzzy logic control is largely due to the awareness to its many industrial applications. An industrial interest in fuzzy logic control as evidenced by the many publications on the subject in the control literature has created an awareness of its interesting importance by the academic community.
II. MATHEMATICAL MODELING
It is quite often the case that we have to design the control system for a process before the process has been constructed. In such a case we need a representation of the process in order to study its dynamic behavior. This representation is usually given in terms of a set of mathematical equations whose solution gives the dynamic or static behavior of the process. The process considered is the spherical tank in which the level of the liquid is desired to be maintained at a constant value. This can be achieved by controlling the input flow into the tank. The spherical tank is shown in Fig.1. Using the law of mass, Rate of accumulation of mass in the tank = Rate of mass flow in – Rate of mass flow out.
Fig.1 Spherical tank
Design and Implementation of Fuzzy Logic
Controller for Dynamic System
S.Rajendran
1, Dr.S.Palani
21
Mookambigai College of Engineering, Keeranur, Pudukkottai, Tamil Nadu, India-622502 2Director / Sudharsan College of Engineering, Sathyamangalam, Pudukkottai, TamilNadu, India
3 1
3 2
Let
q -Inlet flow rate to the tank(m /min)
q -Outlet flow rate to the tank(m /min) h-Height of the spherical tank(m)
H-Height of the liquid level in the tank at any time't'(m) R-Top radius of the spherical tank(m)
r-Radius of the spherical tank at a particular level of height h(m)
The level in spherical tank at any instant is obtained by making mass balance equation as indicated below:
1 2 (1)
dv
q q
dt
where V is the Volume of the tank
3
4
(2) 3
V
hApplying the steady state value,
2
4
3 ( ) (3) 3
s s s
VV h h h
2
( ) 4 s ( ) (4) V s
h H s2 s (5)
q c h
where „c‟ is the valve coefficient
1 2
2 2
1
( ) ( ) (6)
2 s s
q q s ch hh
Linearizing the nonlinearity in the spherical tank
2
( )
( ) , ( ) (7)
2 s t
c H s
Q s H s
R h Where 2 2 ( ) s t h R Q s
1( ) 2( ) ( ) (8)
Q s Q s sV s
2 1
( )
( ) (4 s) ( )
t
H s
Q s s h H s
R
2
1( ) R1 (4 1 s 1) ( )
Q s
R h s H s1 ( )
(9)
( ) 1
t
R H s
Q s s
where
4
R ht s2Thus the equation.9 gives the model of the system.
III. REAL TIME SYSTEM
A. Block diagram
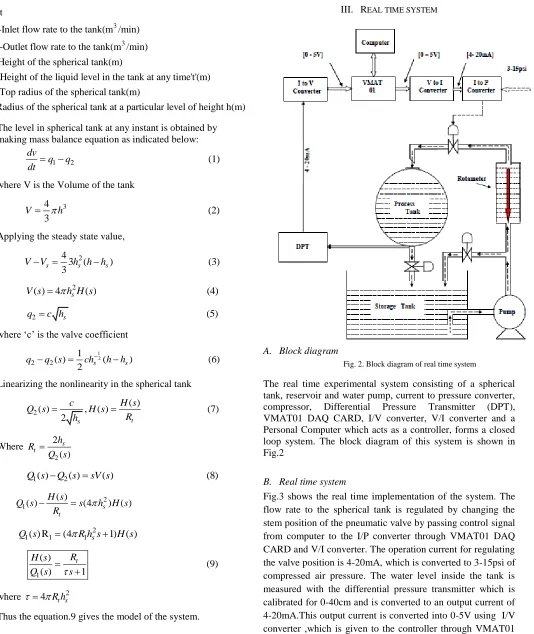
Fig. 2. Block diagram of real time system
The real time experimental system consisting of a spherical tank, reservoir and water pump, current to pressure converter, compressor, Differential Pressure Transmitter (DPT), VMAT01 DAQ CARD, I/V converter, V/I converter and a Personal Computer which acts as a controller, forms a closed loop system. The block diagram of this system is shown in Fig.2
B. Real time system
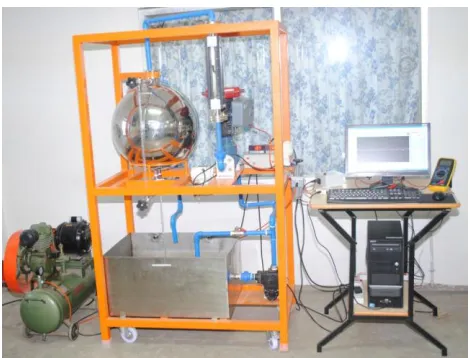
Fig. 3. Real time implementation
C. Specifications of real time system
The specifications of the real time can be represented as follows
Parts Name Details
Spherical tank
Body Material :SS 316 Diameter :500mm Capacity :200 litres
Storage Tank Capacity :200 litres Body Material :SS 316
Differential Pressure Transmitter
Make : AB
Type : Capacitance Input : 2.5 -250)mbar Output : 4-20mA
Rotameter
Make :Tellien/Equivalent Flow Rate :(100 – 1000)LPH Type :Variable Area Float Material :SS 316
Control Valve
Type : Pneumatic air to close
Input : 3-15psi
Pump
Make :Tullu/Kirlosker Flow Rate :1500 LPH Supply Voltage :230VAC/50Hz
Air Regulator Size : ¼” BSP Range : 0-2.2bar
I/P Converter
Make : ABB Input : 4-20mA Output : 0.2 -1bar
V/I Converter
Model : Electronic Input : 1-5V Output :4-20mA
I/V Converter
Model : Electronic Input : 4-20mA Output :1-5V
Pressure Gauge Range : (0-30)psi Range :(0-100)psi
NI6009 DAQ
CARD
Input : 8 Nos. Output : 2 Nos.
IV. SYSTEM IDENTIFICATION
System identification for the spherical tank system is done using black box modeling in real time. For fixed input flow rate and output flow rate, the spherical tank is allowed to fill with water from (0-40)cm height. At each sample time, the data from differential pressure transmitter i.e. between (4-20) mA is being collected and fed to the system through the serial port RS-232 using VMAT01 interface module. Thereby the data is scaled up in terms of level (cm). Using the open loop method, for a given change in the input variable, output response for the system is recorded. Ziegler and Nichols have obtained the time constant and time delay of a FOPTD [First order plus time delay] model by constructing a tangent to the experimental open loop step response at its point of inflection. The tangent intersection with the time axis at the step origin provides a time delay estimate; the time constant is estimated by calculating the tangent intersection with the steady state output value divided by the model gain. Cheng and Hung have also proposed tangent and point of inflection methods for estimating FOPTD model parameters. The major disadvantage of all these methods is the difficulty in locating the point of inflection in practice and may not be accurate. Prabhu and Chidambaram have obtained the parameters of the first order plus time delay model from the reaction curve obtained by solving the nonlinear differential equations model of a distillation column. Sundaresan and Krishnaswamy have obtained the parameters of FOPTD transfer function model by letting the response of the actual system and that of the model to meet at two points which describe the two parameters
andL
. The proposed timest
1 andt
2 , are estimated from a step response curve. This time corresponds to the 35.3% and 85.3% response times. The time constant and time delay are calculated as follows.
0.67(
t
2
t
1)
[10]
L
1.3
t
1
0.29
t
2 [11]At a fixed inlet flow rate, outlet flow rate, the system is allowed to reach the steady state. After that a step increment in the input flow rate is given and various readings are noted till the process becomes stable in the system. The experimental data are approximated to be a FOPDT. Therefore the model for the above system is given by
Change in output Change in input
p
K , KP-Proportional gain
Transfer function [12] 1
Ls K ep
s where 1 2 2 1
1.3 0.29 delay time 0.67( ) time constant
L t t
t t
TABLE I
Model Parameters for Different Regions
Operating Region
Height (cm) Kp
L
I 0 -7.5 cm 2.01 270.68 60.6
II 7.5 -11 cm 4.94 387.93 835.02
III 11-13 cm 6.273 575.53 822.5
IV 13- 18 cm 5.78 894.45 502.66
V 18 -23 cm 6.32 866.98 506.47
V. CONTROLLER DESIGN A Design of PI Controller:
After deriving the transfer function model, the design of controller tuning is done using the method proposed by Skogestad. The PI controller settings are
1
C
P
L
K
K
,
I
[13]Controller gain
K
P depends inversely on model gainK
. It isalso reasonable that
I
as slow processes have large valuesof
, and thus
I should also be large for satisfactorycontrol. As
c decreases,K
P increases. This is because a quicker approach to set point requires more strenuous controlaction and thus there is justification for a larger value of
K
P.Using the PI controller tuned values; the setup was run for the different set points in real time. Then load disturbances at different intervals were given in the tank. The variation in the level was recorded in both the cases. The above mentioned Skogestad setting is also used to find the controller settings for different zones which are given in Table2
B Design of Fuzzy Logic Controller
Fuzzy logic is a part of artificial intelligence or machine learning which interprets a human‟s actions. Fuzzy techniques have been successfully used in control in several fields. Fuzzy logic is a form of logic whose underlying modes of reasoning are approximate instead of exact. The general idea about fuzzy logic is that it takes the inputs from the sensors which is a crisp value and transforms it into membership values ranging from 0 to 1. Unlike crisp logic, it emulates the ability to reason and use approximate data to find solutions. Fuzzy logic controllers (FLCs) are knowledge-based controllers consisting of linguistic “IF-THEN” rules that can be constructed using the knowledge of experts in the given field of interest. Variety
controller structures are used in the literature. However for the present study, the fuzzy logic controller whose block diagram represented in Fig. 4 is used.
TABLE II
PI Tuning Parameters for Different Regions
Region
Tuning Parameters
KP
I(sec)0 -7.5 cm 0.0456 0.0136
7.6 -11 cm 0.029 0.0063
11-13 cm 0.1912 0.028
13- 18 cm 0.1389 0.00609
18 -23 cm 0.116 0.00346
Fig. 4. Block diagram of Fuzzy Logic Controller
Fig. 5. Membership Function for Error
Fig. 6. Membership Function for Change of Error (CE)
Fig.7. Membership Function for Control valve output (CV)
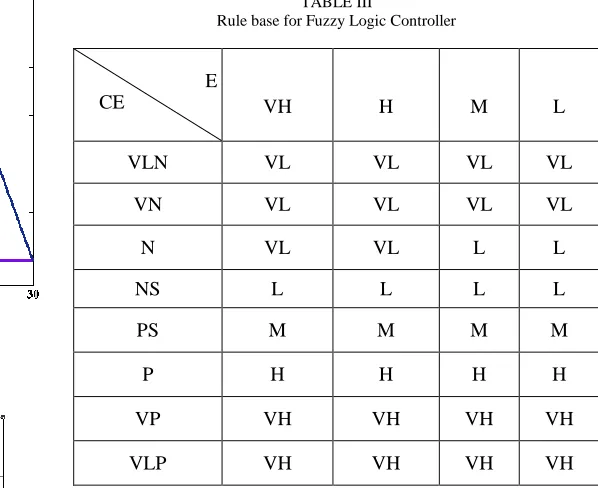
TABLE III
Rule base for Fuzzy Logic Controller
VH H M L
VLN VL VL VL VL
VN VL VL VL VL
N VL VL L L
NS L L L L
PS M M M M
P H H H H
VP VH VH VH VH
VLP VH VH VH VH
VI. RESULTSANDDISCUSSIONS
The FLC is applied to the real time control of liquid level system using VMAT01 module. The performance of the fuzzy controller is compared with conventional PI controller. The FLC is implemented for a sequence of set points 7.5 cm, 11cm, 13 cm, 18 cm, and 23 cm and is compared with a PI controller. The variations of level with time for the sequence of set point changes for both the controllers are shown in Fig.8 to Fig.12. It is observed that FLC tracks the set point changes faster than the conventional controller. The FLC follows the set point without oscillation than the PI controller. The response to track the given set point in a FLC is immediate when compared to the PI controller even though the initial rise time is higher as shown in Fig 8. The settling time of the FLC for a set point change is better than the PI as shown in Fig 10 to Fig.12. The peak time, maximum overshoot and settling time are calculated for both controllers and are shown in Table 4 for set point changes. From the calculated values it is clear that FLC is having lesser peak time, and provides no oscillatory behavior and exhibits no overshoot compared to PI controller.
Fig. 8. Servo Response for a set point 7.5cm
Fig. 9. Servo Response for a set point 11 cm
Fig. 10. Servo Response for a set point 13 cm
Fig. 11. Servo Response for a set point 18 cm
Fig. 12. Servo Response for a set point 23 cm
TABLE IV
Time domain Comparison of Controllers for Different Set Point
PARAMETER SET POINT CONTROLLER
PI FUZZY
Peak Time(Sec)
7.5 cm 3.9 3.85
11 cm 3.9 10
13 cm 3.39 3.15
18 cm 8.65 20
23 cm 6.19 28.12
Overshoot
7.5 cm 9.18 7.75
11 cm 13.75 10.73
13 cm 16.45 15.22
18 cm 24.21 18.25
23 cm 29.91 24
Settling Time(Sec)
7.5 cm 168 61
11 cm 152 96
13 cm 178 117
18 cm 249 218
23 cm 247 141
VII. CONCLUSION
REFERENCES
[1] Abdelelah Kidher Mahmood, Hussam Hamad Taha. Design Fuzzy logic controller. IJESE, Vol.1, Issue- II, 2013: pp.23-26
[2] Ziegler G and Nichols N B. Optimum setting for Automatic controllers. Trans ASME1942; 64:pp. 759-768.
[3] Chidambaram M. Applied Process Control. Mumbai, INDIA: Allied Publishers PVT. Limited, 2004
[4] Sathish Kumar J, Poongodi and Rajasekaran. Modelling and Implementation of LabVIEW Based Non- linear PI Controller for a Conical Tank. Journal of Control & Instrumentation, 2010; 1: pp.1-9
[5] Bhubaneswar N S, Uma G and Rangaswamy T R. Adaptive and optimal control of a non-linear process using intelligent controllers. Applied Soft Computing, 2009; 9: pp.182-190 [6] Takagi T and Sugeno M. Fuzzy identification of systems and its
application to modeling and control. IEEE trans Syst Man Cybernetics, 1985; 15:pp.116-132
[7] Anandanatarajan R, Chidambaram M and Jayasingh T. Design of controller using variable transformations for a nonlinear process with dead time. ISA Trans 2005; 44:pp. 81-91.
[8] Berk P, Stajnko D, Vindis P, Mursec B and Lakota M.Synthesis water level control by fuzzy logic. International OCSCO World Press, 2011; 45: pp.204- 210.
[9] Sivanandam S N, Sumathi.S and Deepa S N. Introduction to Fuzzy Logic using MATLAB Springer.Verlag Berlin Heidelberg, 2007
Dr. Palani Sankaran is Director and Professor, Department of
Electronics & Communication Engineering. He has obtained Bachelor
Degree in Electrical Engineering from University of Madras1966, M. Tech in Control Systems Engineering from IIT, Kharagpur in 1968 and Ph.D. in Control Systems Engineering from University of Madras in 1982. He has wide teaching experience over four decades in National institute of Technology, Government of INDIA
He has published more than 100 research papers in reputed national and international journals and conferences. He is the author of the books titled Automatic Control Systems, Signals and Systems, and Digital Signal
Processing. Under his guidance six candidates were awarded Ph.D degree and
10 candidates are doing Ph.D in Anna University, Chennai
Currently he is working as Director and Professor in the department of Electronics and Communication Engineering, Sudarsan Engineering College, Anna University Chennai, India
Rajendran Subbiah received B.E. degree in Electrical and Electronics