CopyrightÓ2009 by the Genetics Society of America DOI: 10.1534/genetics.109.101782
Estimating Selection Intensity on Synonymous Codon Usage
in a Nonequilibrium Population
Kai Zeng*
,†,1and Brian Charlesworth*
*Institute of Evolutionary Biology, School of Biological Sciences, University of Edinburgh, Edinburgh EH9 3JT, United Kingdom and†State Key Laboratory of Biocontrol and Key Laboratory of Gene Engineering of the Ministry of Education,
Sun Yat-Sen University, Guangzhou 510275, China Manuscript received February 13, 2009 Accepted for publication July 15, 2009
ABSTRACT
Codon usage bias is the nonrandom use of synonymous codons for the same amino acid. Most population genetic models of codon usage evolution assume that the population is at mutation–selection–drift equilibrium. Natural populations, however, frequently deviate from equilibrium, often because of recent demographic changes. Here, we construct a matrix model that includes the effects of a recent change in population size on estimates of selection on preferredvs.unpreferred codons. Our results suggest that patterns of synonymous polymorphisms affecting codon usage can be quite erratic after such a change; statistical methods that fail to take demographic effects into account can then give incorrect estimates of important parameters. We propose a new method that can accurately estimate both demographic and codon usage parameters. The method also provides a simple way of testing for the effects of covariates such as gene length and level of gene expression on the intensity of selection, which we apply to a largeDrosophila melanogasterpolymorphism data set. Our analyses of twofold degenerate codons reveal that (i) selection acts in favor of preferred codons, (ii) there is mutational bias in favor of unpreferred codons, (iii) shorter genes and genes with higher expression levels are under stronger selection, and (iv) there is little evidence for a recent change in population size in the Zimbabwe population ofD. melanogaster.
C
ODONS specifying the same amino acid are called synonymous codons. These are often used non-randomly, with some codons appearing more frequently than others. This biased usage of synonymous codons has been found in many organisms such as Drosophila, yeast, and bacteria (Ikemura1985; Duretand Mouchiroud 1999; Hershbergand Petrov 2008). Conventionally, synonymous codons for a given amino acid are divided into two classes: preferred and unpreferred codons (Ikemura1985; Akashi1994; Duretand Mouchiroud 1999). Several observations indicate that codon usage is affected by natural selection. First, in species with codon usage bias, preferred codons generally correspond to the most abundant tRNA species (Ikemura1981). Second, highly expressed genes usually have higher codon usage bias than genes with low expression (Sharpand Li1986; Duretand Mouchiroud1999; Heyand Kliman2002). Third, the synonymous substitution rate of a gene has been shown to be negatively correlated with its degree of codon usage bias (Sharpand Li1986; Bierne and Eyre-Walker2006). The most commonly citedexplan-ations of the apparent fitness differences between preferred and unpreferred codons are selection for translation efficiency, translational accuracy, and mRNA stability (Ikemura 1985; Eyre-Walker and Bulmer 1993; Akashi1994; Drummondet al.2005). Recently, it has been proposed that exon splicing also affects codon usage bias (Warneckeand Hurst2007).
From a population genetics perspective, the extent of codon usage bias is ultimately a product of the joint effects of mutation, selection, genetic drift, recombina-tion, and demographic history. The Li–Bulmer model of drift, selection, and reversible mutation between preferred and unpreferred codons at a site is the most widely used model (Li 1987; Bulmer 1991; McVean and Charlesworth1999). Applications of this model generally assume that the population is at mutation– selection–drift equilibrium. However, empirical studies have suggested that changes in the strengths of various driving forces may not be unusual. For example, in Drosophila melanogaster, there is evidence that the pop-ulation size (Li and Stephan 2006; Thornton and Andolfatto2006; Keightleyand Eyre-Walker2007; Stephan and Li 2007), recombinational landscape (Takano-Shimizu 1999), and mutational process (Takano-Shimizu 2001; Kern and Begun 2005) may have changed significantly over the species’ evolution-ary history.
Supporting information is available online athttp://www.genetics.org/ cgi/content/full/genetics.109.101782/DC1.
1Corresponding author: Institute of Evolutionary Biology, School of Biological Sciences, University of Edinburgh, Ashworth Laboratories, King’s Bldgs., W. Mains Rd., Edinburgh EH9 3JT, United Kingdom. E-mail: [email protected]
Such changes cause departures from equilibrium. Theoretical models show that it takes a very long time, proportional to the reciprocal of the mutation rate, for the population to approach a new equilibrium state (Tachida2000; Comeronand Kreitman2002). Before reaching equilibrium, the population often shows coun-terintuitive patterns of evolution (Eyre-Walker1997; Takano-Shimizu1999, 2001; Comeronand Kreitman 2002; Comeron and Guthrie 2005; Charlesworth and Eyre-Walker 2007). Despite these theoretical results, details of the patterns of polymorphism and substitution rates following a recent change in popula-tion size, and their effects on estimates of strength of selection, have not been determined.
The above findings point to the importance of incorporating nonequilibrium factors into the study of codon usage bias. To this end, we extend the Li–Bulmer model to allow population size to vary over time, by representing the evolutionary process by a transition matrix. By analyzing this matrix model, we show that a recent change in population size can result in erratic patterns of codon usage and that methods failing to take into account these demographic effects can give false estimates of the intensity of selection.
To solve these problems, we propose a new method, which does not require polarizing ancestral vs. de-rived states using outgroup data (cf. Cutter and Charlesworth 2006), but requires only knowledge of preferredvs.unpreferred states defined by patterns of codon usage. We use information on both poly-morphic and fixed sites, which enables both mutational bias and the strength of selection to be estimated, in contrast to previous methods that use information on polymorphisms alone. Simulations indicate that this method can accurately estimate both demographic and codon usage parameters and can distinguish between selection and demography. We use the new method to analyze a largeD. melanogasterpolymorphism data set (Shapiro et al. 2007) and find evidence for natural selection on synonymous codons. We use our approach to show that genes with shorter coding sequences and higher levels of expression are under signifi-cantly stronger selection than longer genes with lower expression.
MATERIALS AND METHODS
Description of the model: We consider a diploid Wright– Fisher population (Ewens2004, p. 21), whose size in
gener-ationtisNt. At an autosomal nucleotide site, two variants,A anda, can occur. Mutation is reversible: the per generation mutation rate fromatoAisu, and the rate in the opposite direction isku. The fitnesses of the three possible genotypes, AA,Aa, andaaare 1, 11
2s, and 1s, respectively (the genic selection model). Denote the number of occurrences of allele A in generation t by X(t). If X(t) ¼ i, and assuming that mutation precedes selection, the frequency ofAafter muta-tion is
x*ðtÞ ¼ i 2Nt
ð1kuÞ11 i
2Nt
u: ð1Þ
After selection, this becomes
xðtÞ ¼x
*ðtÞ1 ð1=2Þsð1x*ðtÞÞ
1sð1x*ðtÞÞ : ð2Þ
The transition probability forX(t) is thus
pijðtÞ ¼PrfXðt11Þ ¼jjXðtÞ ¼ig
¼ 2Nt11
j
ðxðtÞÞjð1xðtÞÞ2Nt11j: ð3Þ In Equations 1–3, we have 0#i#2Ntand 0#j#2Nt11.
Let fj(t) ¼ Pr(X(t) ¼ j) be the probability that A is representedjtimes in the population at timet. This satisfies the relation
X2Nt
j¼0
fjðtÞ ¼1: ð4Þ
Standard Markov chain theory (Karlin and Taylor 1975)
implies the recursion relationship
fjðt11Þ ¼
X2Nt
i¼0
fiðtÞpijðtÞ; 0#j#2Nt11: ð5Þ
In an equilibrium population with constant sizeN, Equation 5 can be written as
fj¼
X2N
i¼0
fipij; 0#j#2N: ð6Þ
Equation 6 is a system of linear equations subject to the requirement given in Equation 4.
Following the method used to calculate the frequency spectrum of polymorphic sites under the infinite-sites model (e.g., Equation 16 in McVeanand Charlesworth1999), we
can decomposefj(t) into two subprocesses:
fjðtÞ ¼fA;jðtÞ1fa;2NtjðtÞ; 1#j #2Nt1: ð7Þ
Here, fA,j(t) is the probability that the mutant allele A is currently represented j times in the population, having originated at a site fixed for a. We call these mutations ‘‘a / A polymorphic mutations.’’ The second subprocess involves mutations originating at sites fixed forA, such that the mutant alleleais currently represented 2Ntjtimes in the population (i.e., Ais represented jtimes); these areA/a polymorphic mutations. For the first subprocess, we have the following recursion formula
fA;jðt11Þ
¼ X
2Nt1
i¼1
fA;iðtÞpijðtÞ1f0ðtÞp0jðtÞ; 1#j #2Nt111: ð8Þ
The first term on the right describes the dynamics of sites that are polymorphic in thetth generation, and the second term describes newa/Apolymorphic mutations. This formula is analogous to Equation 3 of Evans et al. (2007), which was
supporting information,Figure S1. While the application of our model to data analysis does not depend critically on the infinite-sites assumption, this is likely to be a good approxi-mation in practice and is valid for the simulations described in the first part of theresultssection.
From the two subprocesses, the proportion of polymorphic sites originating from sites previously fixed fora,Pa, is given by
PaðtÞ ¼
P2Nt1
j¼1 fA;jðtÞ
P2Nt1
j¼1 ðfA;jðtÞ1fa;jðtÞÞ
: ð9Þ
The proportion of polymorphic sites that originated from sites previously fixed forA,PA, can be calculated similarly. Further-more, we can calculate the rate at which a site currently fixed forais replaced by a site fixed forA, denoted byraA(t):
raAðtÞ ¼
X
2Nt11
j¼1
fA;jðt1Þpj;2Ntðt1Þ1f0ðt1Þp0;2Ntðt1Þ:
ð10Þ
Similarly, we can calculate the rate, rAa(t), at which a site currently fixed forAis replaced by a site fixed fora. Thus, the total substitution rate is
rðtÞ ¼raAðtÞ1rAaðtÞ: ð11Þ
In an equilibrium population, Equations 7–11 are indepen-dent oft.
Statistical methods: In this section, we use the theory developed above to construct two new methods that are based on the frequencies of preferredvs.unpreferred variants at nucleotide sites and do not require the use of an outgroup to infer ancestral vs. derived states, extending the similar approach of Cutterand Charlesworth(2006). Letdibe
the number of sites at which alleleAis representeditimes in a sample ofnalleles from a population. The frequency dis-tribution for the sample,d, is a vector of all thedi’s (0#i#n); this includes cases where the sample is fixed for eitherAora. We start with the simple case where the population is at equilibrium, denoted as L0. The population dynamics are
determined by the parametersN,u,k, ands. However, if all evolutionary forces are weak so that the diffusion approxima-tion holds, the state of a sample from the populaapproxima-tion is described by the compound parametersu¼4Nuandg¼2Ns (Ewens2004, Chap. 5). The distribution of the numbers of
copies ofAper site in the population can be calculated by solving Equation 6 numerically (see below). We write this distribution asf, which is a vector with 2N11 elements. The log-likelihood for the sample,d, is the
L0ðdjg;u;kÞ ¼
Xn
i¼0
di3log
X2N
j¼0
fj n
i j 2N
i
1 j
2N
ni
" #
:
ð12Þ
In Equation 12, we have adopted the ‘‘conventional’’ as-sumption that sites behave independently of each other (Akashiand Schaeffer1997; Eyre-Walker1997; McVean
and Vieira1999; McVeanand Charlesworth2000; Maside
et al.2004; Cutterand Charlesworth2006; Galtieret al.
2006). Although this assumption is unrealistic, it is mathemat-ically tractable and seems to work fairly well in practice with relatively free recombination (e.g., with a local recombination rate .2 cM/Mb, K. Zeng, unpublished results; see also
Williamsonet al.2005 and Boykoet al.2008).
To model the effects of a change in population size, we assume that the population is originally at equilibrium with population sizeNb. Its population size then changes instantly
toNaand stays constant for tgenerations, at which point a sample is taken from the population. Hence, the model, denoted asL1, has five parameters:gb(¼2Nbs),ub(¼4Nbu),k,
g (¼ Na/Nb), and t (¼ t/Na). The demographic model underlyingL1, although somewhat unrealistic, is
mathemati-cally tractable and has been widely used (Williamsonet al.
2005; Li and Stephan2006; Keightleyand Eyre-Walker
2007; Boykoet al.2008).
Let the distribution of the numbers of A per site in the generation just before the change in population size befb. Then the distribution in thetth generation after the change, fa(t) (a vector with 2N
a1 1 elements), can be obtained by iterating Equation 5 withfbas the initial condition. The log-likelihood of the data is now
L1ðdjgb;ub;k;g;tÞ ¼X
n
i¼0
di3log
X2Na
j¼0
fjaðtÞ
n i
j 2Na
i
1 j
2Na
ni
" #
: ð13Þ
Note that, when g¼1 and/or t¼‘, the more complex model, L1(djgb, ub, k, g,t), reduces to the simpler model,
L0(djg,u,k). Here, following Williamsonet al.(2005), we use
a chi-square test with 2 d.f. to distinguish these two models under the assumption that it will yield a conservative test.
Numerical computations: We used standard numerical methods to solve the linear system given in Equation 6: an LU-decomposition procedure followed by one round of numerical improvement (Press et al.1992). The adequacy
of this numerical method was checked by comparing the results with those obtained by iterating Equation 5 (results not shown). To find the maximum-likelihood estimates (MLEs) of the parameters, we used the simplex algorithm (Presset al.1992). Multiple start points were used to make sure
that the global maximum was found. To save computer time, we used a relatively loose search criterion in the simulations, with a sparse grid of values and a relaxed convergence criterion.
When implementing the model, the size of the transition matrix has to be specified. As mentioned above, population dynamics in the diffusion limit are determined by the compound parametersuandg. Hence it is legitimate to ‘‘scale down’’ the population size to give a tractable size of matrix, preserving the u- andg-values for the true population size. This rescaling has been widely used in population genetics (McVeanand Charlesworth2000; Tachida2000; Comeron
and Kreitman 2002; Keightley and Eyre-Walker 2007;
Kaiser and Charlesworth 2009). In our own experience,
rescaling produced reasonable results even whenNwas set to 10 (seeTable S1).
When computing the more complex model given in Equation 13, it was not feasible to use the simplex algorithm to examine the full domain of g [i.e., g 2 (0, ‘)], so we restricted the search tog2(0.05, 20).
Simulation methods:To generate a random sample of sizen under the constant population size model (L0), we first solved
Equation 6 numerically to obtainf. We then determined the population frequency ofA, denoted asx, by sampling fromf. Finally we obtained the number of copies ofAin a sample of sizenby drawing from a binomial distribution with parameters nand x. A similar procedure was used to generate random samples under the more complex model (L1).
Source of data: We applied these methods to a large D. melanogasterpolymorphism data set (Shapiroet al.2007). The
data, which were kindly provided by D. Turissini, contained alignments of 468 autosomal loci. A number of Zimbabwe and cosmopolitan lines were sampled. We used only the Zimbabwe
lines in our analysis because of severe bottleneck effects in the other population that was sampled (Glinka et al. 2003;
Haddrillet al.2005; Liand Stephan2006; Thorntonand
Andolfatto2006). Among the Zimbabwe lines, we used only
those showing the strongest evidence for reproductive iso-lation, the ‘‘strong Z lines.’’ This avoids the possibility that the Z lines with reduced reproductive isolation with the cosmo-politan lines might have been formed by secondary contact with the cosmopolitan lines; these gave an excess of interme-diate-frequency variants in the frequency spectrum when these ‘‘weak’’ Z lines were included in the analysis ( J. Shapiroand
C-.I. Wu, personal communication).
To annotate the data, we downloaded version 5.11 of theD. melanogastergenome data from FlyBase (http://flybase.org/). We then used BLAT (version 34, with default parameters;
http://genome-test.cse.ucsc.edu/kent/exe/linux/) to align the data to the reference genome. We excluded eight loci falling into putatively repetitive regions and one locus falling into a heterochromatic region. For the other loci, we used their genomic locations to obtain estimates of local recombi-nation rate using a well-established method (Singhet al.2005)
(the data were available online from the Petrov laboratory at http://petrov.stanford.edu/cgi-bin/recombination-rates_ updateR5.pl). To reduce the effect of linkage, we analyzed only loci locating in highly recombining regions, defined as regions with a local recombination rate strictly.2.3 cM/Mb (Singhet al.2005). To avoid the complication of alternatively
spliced genes (Iidaand Akashi2000), we retained only loci
overlapping one annotated well-defined coding region (i.e., starting with a start codon, ending with a stop codon, and possessing no premature stop codon). We further excluded codons where mutations in the first position could change the status of the third codon position (e.g., from fourfold de-generate to twofold dede-generate). Insertions and deletions were also removed. For the genes passing all the above filters, we extracted twofold degenerate codons and defined pre-ferred/unpreferred codons as in Duret and Mouchiroud
(1999). A summary of the data is given in Table 1.
RESULTS
Effects of a change in population size on patterns of
codon usage evolution:In this section, we assumed that
the population size changed instantly fromNbtoNaat
time zero and stayed constant thereafter. AlleleA was
the preferred allele, but mutation was biased toward the unpreferred allele,a(i.e.,k.1). First, we explored the effects of population expansion by assuming that the population size instantly increased 10-fold at time zero (i.e., Na ¼ 10Nb; Figure 1). As reported previously
(Takano-Shimizu 1999; Charlesworth and Eyre -Walker 2007), for a long period after the expansion (38Nagenerations in Figure 1A), the total substitution
rate is higher than that before the expansion. This is due to a sharp increase inraA(the top curve in Figure 1A).
Patterns of polymorphism are also complex (Figure 1B). For example, the frequency of polymorphisms arising from sites fixed fora(Pa) first increases and then
gradually decreases to its new equilibrium level. This behavior ofPais caused by the following dynamics. Just
after the expansion, there are many more sites fixed for ain the population than at equilibrium under the new, larger population size. With the parameter values used in Figure 1, 68% of the sites are expected to be fixed for abefore the expansion, whereas this number decreases to 12% under the new population size. Thus, immedi-ately after the expansion, the chance of occurrence of an a / A mutation is higher than at equilibrium with the new population size. On the other hand, the population expansion changes the scaled selection coefficient fromgb¼2Nbs¼0.3, the value before the
change, toga¼2Nas¼3, the value after the change. As
a result, under the new population size, A /a poly-morphic mutations become more deleterious and are more efficiently purged, whereas a /A polymorphic mutations become more advantageous and are more likely to escape stochastic loss and to segregate at an appreciable frequency. These nonequilibrium dy-namics lead to the transient increase inPa. However, as
time elapses, the number of sites fixed fora gradually decreases, and Pa also slowly decreases to its new
equilibrium value.
Another feature of Figure 1B is of interest: for5Na
generationsPa$PA. This observation is striking because
(i)PA¼Pa¼50%, which occurs twice in Figure 1B when
the two curves intersect, is a pattern expected under an equilibrium population with neutrality (McVean and Charlesworth 1999) and (ii) Pa . PA is expected under an equilibrium model when a is preferred (McVean and Charlesworth 1999), but here a was unpreferred. These results strongly suggest that using predictions made by equilibrium models of codon usage to interpret patterns of polymorphism observed in a nonequilibrium population may lead to very misleading conclusions.
Next, we examined the effects of a reduction in population size. In Figure 2, a 10-fold decrease was assumed (i.e., 10Na ¼ Nb). Immediately after the
re-duction, the total substitution rate, r, is much higher than that before (Figure 2A), consistent with previous results (Takano-Shimizu 1999; Charlesworth and Eyre-Walker 2007). The increase in r is due to in-TABLE 1
Summary of theD. melanogasterpolymorphism data
Ga nb Lc Sd u
We upf Tajima’sDg
182 5.5 14,807 335 0.0107 0.0108 0.0076
aTotal number of loci.
bMean sample size.
cTotal number of twofold degenerate sites.
dTotal number of polymorphic twofold degenerate sites.
eMean value of Watterson’s estimator of (per site)
popula-tion mutapopula-tion rate (Watterson1975). In the calculation,
on-ly twofold degenerate sites were used.
f
Mean nucleotide diversity. In the calculation, only twofold degenerate sites were used.
g
Mean Tajima’s Dstatistic (Tajima 1989). In the
creases in both rAaandraA. Patterns of polymorphism
also show interesting dynamics. Before reaching their new equilibrium values of 54 and 46%, respectively, the difference between PA and Pa increases temporarily
(Figure 2B), mimicking an increase in selection pres-sure on synonymous codons, despite the fact that the selection pressure is greatly reduced due to the sharp decrease in population size. This increased difference betweenPAandPais caused by (i) a transient increase
Figure1.—Patterns of substitution and polymorphism
af-ter a recent population size expansion. We assumed that a dip-loid population of size Nb was originally at equilibrium. At time zero the population size increased instantly 10-fold to Na and stayed constant thereafter. Allele Awas assumed to be the preferred allele. The parameters used were gb ¼ 2Nbs¼0.3,ub¼4Nbu¼0.002, andk¼3. Time was measured in units ofNagenerations. (A) Patterns of substitution. We cal-culated three quantities:raA(the rate at which sites fixed for alleleawere replaced by sites fixed for alleleA; see Equation 10),rAa(the rate at which sites fixed forAwere replaced by sites fixed fora), andr¼raA1rAa, the total substitution rate. Shown are the ratios of the values of these quantities after the change in population size to their equilibrium values before the change. (B) Patterns of polymorphism.PA(orPa) is the proportion of polymorphic sites originating from sites previ-ously fixed forA(ora) (see Equation 9).
Figure2.—Patterns of substitution and polymorphism
af-ter a recent population size shrinkage. We assumed that a dip-loid population of size Nb was originally at equilibrium. At time zero the population size decreased instantly 10-fold to Na and stayed constant thereafter. AlleleA was assumed to be the preferred allele. The parameters used were gb ¼ 2, ub¼0.02, andk¼3. Time was measured in units ofNa gen-erations. (A) Pattern of substitution. (B) Pattern of polymor-phism. Definitions of the quantitiesraA,rAa,r,PA, andPaare the same as those given in Figure 1.
in the number of sites fixed for A (see Figure S2), which allows more A / a polymorphic mutations to occur, and (ii) a decrease in the total number ofa/A mutations arising each generation. Interestingly, the transient increase in the number of sites fixed for A also results in a brief increase in rAa at 2Na
generations after the contraction.
In brief, the dynamics of codon usage can be rather complex following a recent change in population size. Patterns of polymorphism may imitate those expected under a weaker (Figure 1B) or a stronger (Figure 2B) selection pressure on synonymous codons. Further, these misleading patterns can persist for long periods, as the time required for the population to reach the new equilibrium state is typically very long (e.g., Figures 1 and 2).
The effects of a recent population size change on
methods that assume equilibrium:A number of
meth-ods have been proposed to quantify the selection pressure on synonymous codons using within-species polymorphism data (Akashi and Schaeffer 1997; Maside et al. 2004; Comeron and Guthrie 2005; Cutter and Charlesworth 2006). These methods assume that the population is at mutation–selection– drift equilibrium. However, given the results described above, knowing the performance of these methods in a nonequilibrium population is important. To this end, we used the method of Maside et al. (2004) as an example, due to its simplicity in calculation. This method relies on some well-established diffusion approximations (McVeanand Charlesworth1999). Our simulations suggest that when the population is at equilibrium and there is mutational bias, the method may give slightly biased estimates of g, but this is apparent only when selection is very weak (seeFigure S3).
In Figure 3, the same model and parameters used to obtain Figure 1 were used to generate random samples of size 15 with 10,000 codons at various time points after the population expansion. We used the Masideet al. (2004) method to analyze these samples. As shown by Figure 3A, the mean value of the maximum-likelihood estimate (mean MLE) ofgstarts at a value0.3, the true value before the expansion, and then goes down to a value of 0.5; thereafter, the mean MLE increases monotonically toward the new equilibrium value of 3. Over this time period, the mean MLE of g takes the value of zero twice, atNaand16Nagenerations after
the expansion, respectively. These two special time points correspond to the two occasions whenPA¼Pa¼50% in
Figure 1B. The power of the method to reject neutrality at a significance level of 5% is shown in Figure 3B. There are two dips in the power curve. Not surprisingly, these two significant reductions in power occur when the mean MLE ofgtakes the value of zero. One feature of special note in Figure 3 is that, during the time between the two occasions when the mean MLE ofgis zero, the Maside et al.(2004) method has great power to reject neutral
evolution for the data sets that we simulated. However, theg-value that the method returns has, on average, a different sign from the true value. In other words, the preferred/unpreferred state estimated by the method is the reverse of the true situation. Further investigation Figure3.—Effects of a recent population size expansion
on the Masideet al.(2004) method. The model and
param-eters used were the same as those used to generate Figure 1 (i.e., a 10-fold increase in population size,gb¼0.3,ub¼0.002, andk¼3). At each time point after the expansion in popu-lation size, we randomly generated 500 samples. Each sample was composed of 15 sequences of 10,000 codons. We then used the Masideet al.(2004) method to analyze these samples
suggests that the negative mean MLE was not caused by our incorporation of a strong mutational bias in the simulation (k¼ 3), because the same pattern was observed whenkwas set to one (results not shown).
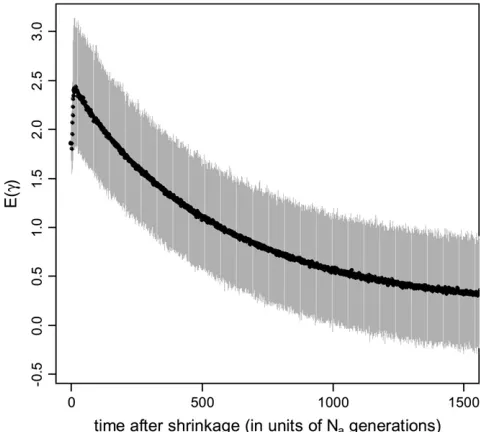
In agreement with the results shown in Figure 2B, there is a brief increase in the mean MLE of g immediately after a reduction in population size (Figure 4), and thereafter the mean MLE decreases steadily toward the new equilibrium value of 0.2. The power of the Maside et al.method to reject neutrality in this case is a mono-tonically decreasing function of time (seeFigure S4).
We also carried out simulations to examine effects of nonequilibrium evolution on the Akashi–Schaeffer method (Akashi and Schaeffer 1997; see Figure S8 and Figure S9) and the Cutter–Charlesworth method (Cutterand Charlesworth2006; seeFigure S10and
Figure S11). Both methods are affected. Interestingly, the Akashi–Schaeffer method overestimates the inten-sity of selection after a population size expansion and falsely infers the sign of g after a population size reduction; these patterns are the reverse of those for the Maside et al. method. The Cutter–Charlesworth method has similar properties to the Maside et al. method.
Taken together, the results suggest that recent pop-ulation size changes can cause methods that assume equilibrium to give misleading results. First, the
esti-mated selection pressure on synonymous codons may be very different from the true value (Figures 3A and 4); second, neutrality may be falsely accepted (Figure 3B).
The performance of the new estimation methods:To
model the effects of a change in population size with the new methods described inmaterials and methods, we constructed two statistical models:L0andL1.L0assumes
that the population is at equilibrium and has three parameters:g,u, andk. L1assumes that the population
is originally at equilibrium with population sizeNb. Then
the population size changes instantly to Na and stays
constant thereafter for tgenerations, at which point a sample is taken from the population. Hence,L1has five
parameters:gb(¼2Nbs),ub(¼4Nbu),k,g(¼Na/Nb), and
t(¼t/Na).
In contrast to previous methods, which do not esti-mate mutational parameters (Akashi and Schaeffer 1997; Masideet al.2004; Comeronand Guthrie2005; Cutterand Charlesworth2006),L0simultaneously estimates mutational (u and k) and selection (g) parameters. Simulation results show that L0 has high
accuracy in estimating all the parameters (Table 2). However, similarly to the Maside et al. method, L0
is susceptible to violation of the equilibrium assump-tion (see Figure S5 and Figure S6). In this case, the behavior of L0is rather similar to that of the Maside et al.method: following a recent population expansion the mean MLE of g first decreases and then slowly increases to the new equilibrium value. The difference is that the mean MLE of g returned by L0 takes a
minimum value of 0.1 and never becomes negative. Estimates ofkanduproduced byL0are also likely to be
biased by recent demographic changes (see Figure S5
andFigure S6).
TheL1method has two more parameters,tandg, and
requires the iteration of Equation 5. Hence, L1 is the
most computationally intense method considered here. Again we did simulations to examine the properties of L1 (Table 3). The accuracy of L1 in estimating the
parameters is generally quite high. Importantly, the method seems to have good power to reject a model with constant population size and to detect selection (Table 3). However, when only a relatively small amount of data is available, the accuracy and power of the L1
method are reduced (see the second set of results in Table 3). In this case, the model with a recent popula-tion size reducpopula-tion seems to be particularly problem-atic: in the simulations, the simplex algorithm we used often failed to converge and returned unrealistic results. Interestingly, reducing the amount of data does not reduce the power of the method to detect selection if the population size is declining, whereas a limited amount of data does reduce the power to detect selection if the population size is increasing. This difference is probably caused by the fact that immedi-ately after a reduction in population size, patterns of Figure4.—Effects of a recent population size reduction on
the Masideet al.(2004) method. The model and parameters
used were the same as those used to generate Figure 2 (i.e., a 10-fold decrease in population size,gb¼2,ub¼0.02, andk¼ 3). At each time point after the reduction in population size, we randomly generated 500 samples. Each sample was com-posed of 15 sequences of 10,000 codons. We then used the Masideet al.method to analyze these samples and obtained a distribution of estimatedg. The solid curve shows the mean of the estimates ofg, and the shaded sleeve indicates where 95% of the probability mass of the distribution lies.
polymorphism can be very selection-like (i.e., PA and
Paare very different; e.g., Figure 2B), whereas after a
population expansion patterns of polymorphism can be more neutral-like (i.e.,PAandPaare close to 50%;
e.g., Figure 1B).
Overall, the L1 method seems to have substantial
power to disentangle selection from demography. This is a useful property because it has long been known that
selection and demography, either acting separately or jointly, can leave very similar traces on polymorphism patterns, and distinguishing them has been a subject of active research (Simonsenet al.1995; Nielsenet al.2005; Williamson et al.2005; Keightley and Eyre-Walker 2007; Zenget al.2007).
Applying the new methods to aD. melanogaster data
set: We used our new methods,L0andL1, to analyze a
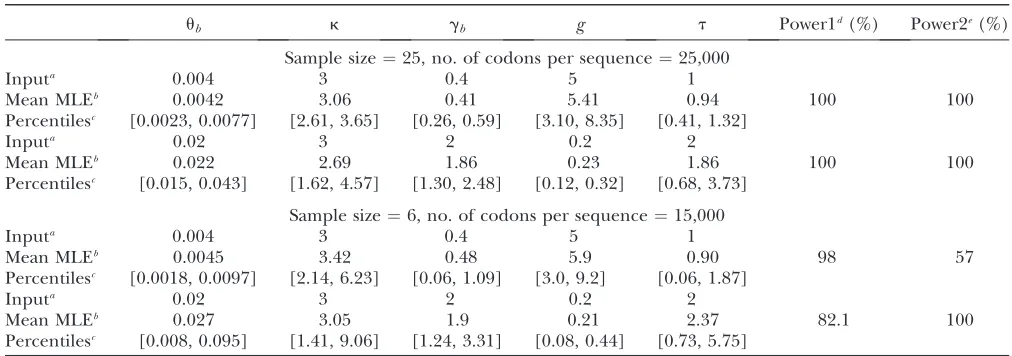
TABLE 3
Performance of theL1method in a nonequilibrium population
ub k gb g t Power1d(%) Power2e(%)
Sample size¼25, no. of codons per sequence¼25,000
Inputa 0.004 3 0.4 5 1
Mean MLEb 0.0042 3.06 0.41 5.41 0.94 100 100
Percentilesc [0.0023, 0.0077] [2.61, 3.65] [0.26, 0.59] [3.10, 8.35] [0.41, 1.32]
Inputa 0.02 3 2 0.2 2
Mean MLEb 0.022 2.69 1.86 0.23 1.86 100 100
Percentilesc [0.015, 0.043] [1.62, 4.57] [1.30, 2.48] [0.12, 0.32] [0.68, 3.73]
Sample size¼6, no. of codons per sequence¼15,000
Inputa 0.004 3 0.4 5 1
Mean MLEb 0.0045 3.42 0.48 5.9 0.90 98 57
Percentilesc [0.0018, 0.0097] [2.14, 6.23] [0.06, 1.09] [3.0, 9.2] [0.06, 1.87]
Inputa 0.02 3 2 0.2 2
Mean MLEb 0.027 3.05 1.9 0.21 2.37 82.1 100
Percentilesc [0.008, 0.095] [1.41, 9.06] [1.24, 3.31] [0.08, 0.44] [0.73, 5.75]
In the simulations, we assumed that the population was originally at equilibrium with population sizeNb. Then the population size changed instantly toNaand stayed constant thereafter fortgenerations, at which point random samples were taken. The parameters weregb(¼2Nbs),ub(¼4Nbu),k,g(¼Na/Nb), andt(¼t/Na). For each combination of parameter values, 100 replicate simulations were run.
a
The parameter values used to generate random samples.
b
Mean value of the maximum-likelihood estimates (MLE).
c
Percentiles [2.5% and 97.5%] of the distributions of the MLEs.
dThe power to reject a model with constant population size at a significance level of 5%.
eThe power to reject neutral evolution at a significance level of 5%.
TABLE 2
Performance of theL0method in an equilibrium population
u k g
Sample size¼15, no. of codons per sequence¼10,000
Inputa 0.01 1 0
Mean MLEb 0.01 1.02 0.0009
Percentilesc [0.008, 0.012] [0.71, 1.45] [0.3772, 0.3488]
Inputa 0.01 3 1
Mean MLEb 0.01 3.01 1.02
Percentilesc [0.008, 0.012] [2.32, 4.10] [0.72, 1.34]
Sample size¼25, no. of codons per sequence¼500
Inputa 0.01 3 2
Mean MLEb 0.01 3.53 1.98
Percentilesc [0.003, 0.019] [1.01, 10.62] [0.79, 3.36]
For each combination of parameter values, we used the matrix model to generate 200 samples. These samples were analyzed usingL0(see Equation 12).
a
The parameter values used to generate random samples.
b
Mean value of the maximum-likelihood estimates (MLE).
c
largeD. melanogaster polymorphism data set (Shapiro et al.2007), summarized in Table 1 (see alsomaterials and methods).
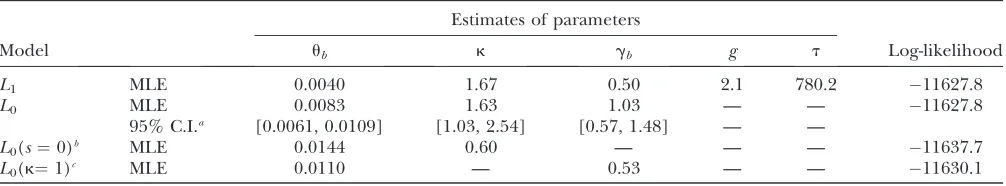
Initial analysis:The results of the analyses are given in Table 4. Interestingly, the simple model,L0, seems to be
sufficient to explain the data: there is essentially no increase in the log-likelihood (lnL) when the data were analyzed usingL1. Further support for this conclusion
comes from the fact that, underL1, the estimate of the
time after expansion,t, is very large, by which time the population has essentially reached a new equilibrium, andL1reduces toL0. For this reason, we were unable to
obtain a 95% confidence interval under L1.
Further-more, consistent with many previous reports (Petrov and Hartl 1999; McVean and Vieira 2001; Nielsen et al. 2007; Keightley et al. 2009), the mutational process is not symmetric, but is biased toward pre-ferred-to-unpreferred changes [L0(k¼1) vs. L0,x2¼
4.6, d.f.¼1,P¼0.03]. In contrast, comparingL0with
the reduced model when the selection coefficient (s) was fixed at zero [i.e.,L0(s¼0)vs. L0], we found strong
evidence for recent selection on synonymous codons (x2¼19.7, d.f.¼1,P¼9.13106). Using the estimated
parameters, the L0 model can accurately predict the
observed data (seeFigure S7). In short, the above results suggest that a model with constant population size and selection acting on synonymous codons is a sufficient explanation of the data.
A more detailed analysis: Although the L0 model
seems to provide a rather good fit to the data, it is highly simplified in that it assumes a single selection coefficient and a single mutational bias parameter for all sites. It has been shown by other researchers that different genes can experience different levels of selection pressure, depending on factors such as gene expression level and length of coding region (Comeron and Kreitman 2002; Masideet al.2004; Comeronand Guthrie2005; Cutterand Charlesworth2006), and that the muta-tional bias parameter can be different for different nucleotides (McVean and Vieira 1999; Petrov and Hartl 1999; Keightley et al. 2009). We therefore introduced additional parameters into theL0model.
First, some of the preferred codons being analyzed differ from their corresponding unpreferred codons by a G to A change at the third codon position, while the rest differ by C to T. We thus extended the model so that each class of codons had its own set of parameters. A maximum-likelihood analysis suggests that this model fits the data much better than the original model (x2¼287.0, d.f.¼3,P,1020). The MLEs are ˆg
GA¼
0.85, ˆgCT ¼1.13, ˆuGA¼0.011, ˆuCT ¼0.007, ˆkGA¼0.95,
and ˆkCT ¼2.26 (lnL¼ 11484.3). However, a model with a common selection coefficient for the two classes of codons fits the data almost equally well (x2¼0.34,
d.f. ¼1, P ¼0.56); the MLEs and the log-likelihood under this model are ˆg¼1.03, ˆuGA¼0.010, ˆuCT ¼0.008, ˆ
kGA¼1.13, ˆkCT ¼2.04, and lnL¼ 11484.5. Thus, we assumed that there was no difference in selection coefficient between G/A or C/T ending codons in the following more elaborate analysis.
Another major determinant of codon usage is the level of gene expression (Duret and Mouchiroud 1999; Heyand Kliman2002). To model this complica-tion, we used data from the UniGene database (http:// www.ncbi.nlm.nih.gov/unigene), employing the total number of expressed sequence tags (ESTs) for a gene as a rough measure of its level of expression (the data were kindly provided by B. Vicoso). We divided the genes into two equal-size groups: low-expression and high-expression genes. We allowed each of group of genes to have its own scaled selection coefficient,glowandghigh,
respectively. By fitting the model to the data, we obtained the following MLEs: ˆglow¼0.82, ˆghigh¼1.25, ˆ
uGA¼0.010, ˆuCT ¼0.008, ˆkGA¼1.14, ˆkCT ¼2.03, and
lnL¼ 11079.3. This new model further improves the fit to the data compared toL0(djg,uGA,uCT,kGA,kCT)
(x2 ¼810.3, d.f. ¼1, P , 1020). In accordance with
the previous reports, our results suggest that highly expressed genes are under stronger selection pressure than genes with low expression levels.
Finally, we considered the effects of coding region length. We divided low- and high-expression genes, respectively, into two equal-size classes: genes with short and long coding regions. We allowed each group of TABLE 4
Analyzing the twofold degenerate codons usingL0andL1
Estimates of parameters
Model ub k gb g t Log-likelihood
L1 MLE 0.0040 1.67 0.50 2.1 780.2 11627.8
L0 MLE 0.0083 1.63 1.03 — — 11627.8
95% C.I.a [0.0061, 0.0109] [1.03, 2.54] [0.57, 1.48] — —
L0(s¼0)b MLE 0.0144 0.60 — — — 11637.7
L0(k¼1)c MLE 0.0110 — 0.53 — — 11630.1
aNinety-five percent confidence interval obtained by 250 bootstrap replicates.
bTheL
0model withs, the selection coefficient, fixed at zero.
cTheL
0model withk, the mutational bias parameter, fixed at unity.
genes to have its own selection coefficient. The MLEs are ˆglow--short¼0.91, ˆglow--long¼0.76, ˆghigh--short¼1.36, ˆ
ghigh--long¼1.17, ˆuGA¼0.010, ˆuCT ¼0.008, ˆkGA¼1.14,
ˆ
kCT ¼2.04, and lnL¼ 11068.6. The improvement in
the fit to the data, compared to the model given in the previous paragraph, is also highly significant (x2¼21.3,
d.f. ¼ 2, P ¼ 2.3 3 105). These results confirm the
finding that genes with shorter coding regions tend to be under stronger selection pressure than those with longer coding regions (Comeronet al.1999; Duretand Mouchiroud1999; Comeronand Guthrie2005).
DISCUSSION
The importance of considering nonequilibrium
factors in the study of codon usage bias:Population–
genetic models of codon usage bias (Li1987; Bulmer 1991; McVeanand Charlesworth1999) have mostly assumed that the population is at mutation–selection– drift equilibrium. As evidence for nonequilibrium situations in Drosophila species accumulates (Takano -Shimizu 1999, 2001; Kern and Begun 2005; Li and Stephan 2006; Thornton and Andolfatto 2006; Stephan and Li 2007), the study of nonequilibrium models has attracted more attention, and some un-expected results have emerged (Eyre-Walker 1997; Takano-Shimizu1999, 2001; Comeronand Kreitman 2002; Comeron and Guthrie 2005; Charlesworth and Eyre-Walker2007).
Our matrix model allows systematic studies of the patterns of polymorphism and substitution following a recent change in population size. We were able to confirm and extend the findings reported in the pre-vious studies. Most importantly, we have carried out the first survey of the performance of statistical methods that assume equilibrium in a situation where such an assumption is violated. We can draw two conclusions. First, patterns of polymorphism can be very misleading after a recent change in population size. For example, they can become very neutral-like after a recent pop-ulation expansion (Figure 1B). In contrast, after a recent population size reduction, patterns of polymor-phism are likely to suggest a level of selection pressure higher than the true value (Figure 2B). Second, using statistical methods that assume equilibrium in a non-equilibrium population can result in erroneous infer-ences of the strength of selection (Figures 3 and 4; see alsoFigure S5,Figure S6,Figure S8,Figure S9,Figure S10, andFigure S11). These findings indicate that it is important to consider nonequilibrium factors in the study of codon usage bias.
Effects of weak selection on synonymous variants:
Contrary to a previous analysis of the same D. mela-nogasterdata set (Keightleyand Eyre-Walker2007), we did not find any evidence for a recent population expansion in the Zimbabwe sample. The main differ-ence between the studies is that synonymous sites were
previously assumed to be neutral. However, as shown here, there is evidence for selection on these sites. According to standard population genetics theory, such a selection pressure can result in an excess of low-frequency variants (Ewens2004, Chap. 5). It is likely that this excess of low-frequency variants was treated by the method of Keightley and Eyre-Walker as the signature of a recent population size expansion. Indeed, when these authors fitted the data using a model with selection on synonymous sites, the support for the expansion event disappeared (see p. 2260 in Keightley and Eyre-Walker2007). Moreover, recent studies have shown that noncoding regions may be under selection as well (e.g., Andolfatto2005). These findings suggest that treating certain types of markers as neutral stand-ards can be a dubious procedure, which deserves careful investigation of its validity, whose violation may result in unreliable inferences.
Selection on synonymous codons inD. melanogaster:
By analyzing a large polymorphism data set (Shapiro et al.2007), we found evidence for natural selection on synonymous codons in D. melanogaster (Table 4). Fur-thermore, we show that genes with shorter coding sequences and/or higher levels of expression are under stronger selection. These results are consistent with previous studies, which suggest that patterns of codon usage bias in D. melanogaster are compatible with the operation of selection (Kliman1999; Heyand Kliman 2002; Carlini and Stephan 2003; Qin et al. 2004; Comeronand Guthrie2005; Singhet al.2007).
However, a number of studies have also found that selection on synonymous sites may have been substan-tially reduced in the D. melanogaster lineage (Akashi 1995, 1996; McVean and Vieira 1999, 2001; Nielsen et al. 2007). A common feature of these studies is that they used between-species divergence data and drew conclusions on the basis of the observation that D. melanogastersynonymous sites have fixed significantly more unpreferred alleles than preferred variants (the rates of fixation should be equal at equilibrium). Divergence data can tell us what has happened along the entireD. melanogaster lineage, but not when these events happened. To reconcile these findings with ours, we hypothesize that there may have been a reduction in population size in theD. melanogasterlineage a long time ago, which resulted in the rapid fixation of many unpreferred variants (e.g., Figure 2A). After this ancient reduction, the population size may have stayed relatively constant, and extant patterns of polymorphism may have come relatively close to the new equilibrium. Because our method does not use divergence data, it has little power to detect such an ancient event, so that the equilibrium model provides a good fit.
time of the contraction event (see Figure S6). In addition, the potential influences of biased gene con-version (Marais et al. 2001, 2003; Kliman and Hey 2003; Marais 2003), changes in the recombinational landscape (Takano-Shimizu1999), and recent changes in the mutational processes (Takano-Shimizu 2001; Kernand Begun2005), as well as the effects of more complex demographic models (e.g., population struc-ture and population bottlenecks), are not considered by our method. Therefore, although there is evidence for selection on synonymous sites, this result should be treated with caution.
Advantages and caveats: The matrix model and the
methods developed in this study have a number of advantages. First, the model is highly flexible. Although we focus on the effects of a sudden change in popula-tion size here, it is straightforward to modify the model so that it can be used to study effects of more complex demographic models (e.g., population bottlenecks, exponential growth), changes in selection coefficients, and changes in mutational parameters. Second, our methods allow the simultaneous estimation of selec-tion and mutaselec-tional parameters, in contrast to previous methods that rely only on polymorphic sites (Maside et al.2004; Cutterand Charlesworth 2006). Third, the statistical methods we have proposed do not require the use of an outgroup sequence to infer ancestralvs. derived states, a process that is error prone and can lead to unreliable inferences.
There are also some caveats. First, as in most previous studies, we assume that sites are independent. This assumption is obviously unrealistic. Hill–Robertson effects among linked sites might make our methods un-reliable (McVeanand Charlesworth2000; Comeron et al.2008). Fortunately, recent simulation studies have suggested that methods assuming free recombination work surprisingly well in practice with relatively free recombination (e.g., with a local recombination rate
.2 cM/Mb; K. Zeng, unpublished results; see also Williamsonet al.2005 and Boykoet al.2008). By using data from highly recombining regions, our results should be robust to the violation of the free-recombina-tion assumpfree-recombina-tion. The second disadvantage of the matrix model is that it is computationally burdensome. In particular, the L1 model, which requires iterating
Equation 5, can be very slow. This is a common pro-blem confronting all studies using matrix models (e.g., Keightley and Eyre-Walker 2007). Despite these caveats, matrix models are flexible and easy to formu-late, and their usefulness should not be underestimated. A computer program implementing the methods described in this article is available from the corre-sponding author.
We thank Andrea Betancourt, Penny Haddrill, and Peter Keightley for helpful discussions and David Turissini for providing the Drosoph-ila data set. We also thank Rasmus Nielsen, John Wakeley, and the anonymous reviewers for their insightful comments. We are very
grateful to the Sun Yat-Sen University Computer Centre for providing computer time and to Hailiang Liu and Haijun Wen for technical support. This work has also made use of the resources provided by the Edinburgh Compute and Data Facility (ECDF) (http://www.ecdf.ed.ac. uk/). The ECDF is partially supported by the eScience Data Information and Knowledge Transformation initiative (http://www.edikt.org.uk). K.Z. was supported by a Royal Society International Incoming Fellowship. K.Z. also acknowledges support from a National Basic Research Pro-gram of China grant (2007CB815701) and a National Natural Science Foundation of China grant (30730008) to Professor Suhua Shi.
LITERATURE CITED
Akashi, H., 1994 Synonymous codon usage in Drosophila
mela-nogaster: natural selection and translational accuracy. Genetics
136:927–935.
Akashi, H., 1995 Inferring weak selection from patterns of
polymor-phism and divergence at ‘‘silent’’ sites in Drosophila DNA. Genet-ics139:1067–1076.
Akashi, H., 1996 Molecular evolution between Drosophila mela-nogaster and D. simulans: reduced codon bias, faster rates of amino acid substitution, and larger proteins inD. melanogaster. Genetics144:1297–1307.
Akashi, H., and S. W. Schaeffer, 1997 Natural selection and the
frequency distributions of ‘‘silent’’ DNA polymorphism in Dro-sophila. Genetics146:295–307.
Andolfatto, P., 2005 Adaptive evolution of non-coding DNA in
Drosophila. Nature437:1149–1152.
Bierne, N., and A. Eyre-Walker, 2006 Variation in synonymous
co-don use and DNA polymorphism within the Drosophila genome. J. Evol. Biol.19:1–11.
Boyko, A. R., S. H. Williamson, A. R. Indap, J. D. Degenhardt, R. D.
Hernandezet al., 2008 Assessing the evolutionary impact of
amino acid mutations in the human genome. PLoS Genet. 4:
e1000083.
Bulmer, M., 1991 The selection-mutation-drift theory of
synony-mous codon usage. Genetics129:897–907.
Carlini, D. B., and W. Stephan, 2003 In vivo introduction of
unpre-ferred synonymous codons into the Drosophila Adh gene results in reduced levels of ADH protein. Genetics163:239–243. Charlesworth, J., and A. Eyre-Walker, 2007 The other side of
the nearly neutral theory, evidence of slightly advantageous back-mutations. Proc. Natl. Acad. Sci. USA104:16992–16997. Comeron, J. M., and T. B. Guthrie, 2005 Intragenic Hill-Robertson
interference influences selection intensity on synonymous muta-tions in Drosophila. Mol. Biol. Evol.22:2519–2530.
Comeron, J. M., and M. Kreitman, 2002 Population, evolutionary
and genomic consequences of interference selection. Genetics
161:389–410.
Comeron, J. M., M. Kreitmanand M. Aguade, 1999 Natural
selec-tion on synonymous sites is correlated with gene length and re-combination in Drosophila. Genetics151:239–249.
Comeron, J. M., A. Willifordand R. M. Kliman, 2008 The
Hill-Robertson effect: evolutionary consequences of weak selection and linkage in finite populations. Heredity100:19–31. Cutter, A. D., and B. Charlesworth, 2006 Selection intensity on
preferred codons correlates with overall codon usage bias in Cae-norhabditis remanei. Curr. Biol.16:2053–2057.
Drummond, D. A., J. D. Bloom, C. Adami, C. O. Wilkeand F. H.
Arnold, 2005 Why highly expressed proteins evolve slowly.
Proc. Natl. Acad. Sci. USA102:14338–14343.
Duret, L., and D. Mouchiroud, 1999 Expression pattern and,
sur-prisingly, gene length shape codon usage in Caenorhabditis, Dro-sophila, and Arabidopsis. Proc. Natl. Acad. Sci. USA96:4482–4487. Evans, S. N., Y. Shvetsand M. Slatkin, 2007 Non-equilibrium theory
of the allele frequency spectrum. Theor. Popul. Biol.71:109–119. Ewens, W. J., 2004 Mathematical Population Genetics.Springer-Verlag,
Berlin.
Eyre-Walker, A., 1997 Differentiating between selection and
muta-tion bias. Genetics147:1983–1987.
Eyre-Walker, A., and M. Bulmer, 1993 Reduced synonymous
sub-stitution rate at the start of enterobacterial genes. Nucleic Acids Res.21:4599–4603.
Galtier, N., E. Bazinand N. Bierne, 2006 GC-biased segregation
of noncoding polymorphisms in Drosophila. Genetics172:221– 228.
Glinka, S., L. Ometto, S. Mousset, W. Stephanand D. DeLorenzo,
2003 Demography and natural selection have shaped genetic variation in Drosophila melanogaster: a multi-locus approach. Genetics165:1269–1278.
Haddrill, P. R., K. R. Thornton, B. Charlesworth and P.
Andolfatto, 2005 Multilocus patterns of nucleotide variability
and the demographic and selection history of Drosophila mela-nogaster populations. Genome Res.15:790–799.
Hershberg, R., and D. A. Petrov, 2008 Selection on codon bias.
Annu. Rev. Genet.42:287–299.
Hey, J., and R. M. Kliman, 2002 Interactions between natural
selec-tion, recombination and gene density in the genes of Drosophila. Genetics160:595–608.
Iida, K., and H. Akashi, 2000 A test of translational selection at
‘si-lent’ sites in the human genome: base composition comparisons in alternatively spliced genes. Gene261:93–105.
Ikemura, T., 1981 Correlation between the abundance of
Escheri-chia coli transfer RNAs and the occurrence of the respective co-dons in its protein genes: a proposal for a synonymous codon choice that is optimal for the E. coli translational system. J. Mol. Biol.151:389–409.
Ikemura, T., 1985 Codon usage and tRNA content in unicellular
and multicellular organisms. Mol. Biol. Evol.2:13–34. Kaiser, V. B., and B. Charlesworth, 2009 The effects of
deleteri-ous mutations on evolution in non-recombining genomes. Trends Genet.25:9–12.
Karlin, S., and H. Taylor, 1975 A First Course in Stochastic Processes.
Academic Press, New York/London/San Diego.
Keightley, P. D., and A. Eyre-Walker, 2007 Joint inference of the
distribution of fitness effects of deleterious mutations and pop-ulation demography based on nucleotide polymorphism fre-quencies. Genetics177:2251–2261.
Keightley, P. D., U. Trivedi, M. Thomson, F. Oliver, S. Kumar et al., 2009 Analysis of the genome sequences of three Drosoph-ila melanogaster spontaneous mutation accumulation lines. Genome Res.19:1195–1201.
Kern, A. D., and D. J. Begun, 2005 Patterns of polymorphism and
divergence from noncoding sequences of Drosophila mela-nogaster and D. simulans: evidence for nonequilibrium pro-cesses. Mol. Biol. Evol.22:51–62.
Kliman, R. M., 1999 Recent selection on synonymous codon usage
in Drosophila. J. Mol. Evol.49:343–351.
Kliman, R. M., and J. Hey, 2003 Hill-Robertson interference in
Dro-sophila melanogaster: reply to Marais, Mouchiroud and Duret. Genet. Res.81:89–90.
Li, H., and W. Stephan, 2006 Inferring the demographic history and
rate of adaptive substitution in Drosophila. PLoS Genet.2:e166. Li, W. H., 1987 Models of nearly neutral mutations with particular
implications for nonrandom usage of synonymous codons. J. Mol. Evol.24:337–345.
Marais, G., 2003 Biased gene conversion: implications for genome
and sex evolution. Trends Genet.19:330–338.
Marais, G., D. Mouchiroudand L. Duret, 2001 Does recombination
improve selection on codon usage? Lessons from nematode and fly complete genomes. Proc. Natl. Acad. Sci. USA98:5688–5692. Marais, G., D. Mouchiroudand L. Duret, 2003 Neutral effect of
recombination on base composition in Drosophila. Genet. Res.
81:79–87.
Maside, X., A. W. Leeand B. Charlesworth, 2004 Selection on
codon usage in Drosophila americana. Curr. Biol.14:150–154. McVean, G. A., and B. Charlesworth, 2000 The effects of
Hill-Robertson interference between weakly selected mutations on patterns of molecular evolution and variation. Genetics 155:
929–944.
McVean, G. A., and J. Vieira, 1999 The evolution of codon
prefer-ences in Drosophila: a maximum-likelihood approach to param-eter estimation and hypothesis testing. J. Mol. Evol.49:63–75.
McVean, G. A., and J. Vieira, 2001 Inferring parameters of
muta-tion, selection and demography from patterns of synonymous site evolution in Drosophila. Genetics157:245–257.
McVean, G. A. T., and B. Charlesworth, 1999 A population
ge-netic model for the evolution of synonymous codon usage: pat-terns and predictions. Genet. Res.74:145–158.
Nielsen, R., S. Williamson, Y. Kim, M. J. Hubisz, A. G. Clarket al.,
2005 Genomic scans for selective sweeps using SNP data. Ge-nome Res.15:1566–1575.
Nielsen, R., V. L. BauerDuMont, M. J. Hubiszand C. F. Aquadro,
2007 Maximum likelihood estimation of ancestral codon usage bias parameters in Drosophila. Mol. Biol. Evol.24:228–235. Petrov, D. A., and D. L. Hartl, 1999 Patterns of nucleotide
substi-tution in Drosophila and mammalian genomes. Proc. Natl. Acad. Sci. USA96:1475–1479.
Press, W. H., S. A. Teukolsky, W. T. Vetterlingand B. P. Flannery,
1992 Numerical Recipes in C: The Art of Scientific Computing. Cam-bridge University Press, CamCam-bridge, UK.
Qin, H., W. B. Wu, J. M. Comeron, M. Kreitmanand W. H. Li,
2004 Intragenic spatial patterns of codon usage bias in prokary-otic and eukaryprokary-otic genomes. Genetics168:2245–2260. Shapiro, J. A., W. Huang, C. Zhang, M. J. Hubisz, J. Lu et al.,
2007 Adaptive genic evolution in the Drosophila genomes. Proc. Natl. Acad. Sci. USA104:2271–2276.
Sharp, P. M., and W. H. Li, 1986 An evolutionary perspective on
syn-onymous codon usage in unicellular organisms. J. Mol. Evol.24:
28–38.
Simonsen, K. L., G. A. Churchill and C. F. Aquadro,
1995 Properties of statistical tests of neutrality for DNA poly-morphism data. Genetics141:413–429.
Singh, N. D., P. F. Arndtand D. A. Petrov, 2005 Genomic
hetero-geneity of background substitutional patterns inDrosophila mela-nogaster.Genetics169:709–722.
Singh, N. D., V. L. BauerDuMont, M. J. Hubisz, R. Nielsenand
C. F. Aquadro, 2007 Patterns of mutation and selection at
synonymous sites in Drosophila. Mol. Biol. Evol.24:2687–2697. Stephan, W., and H. Li, 2007 The recent demographic and
adap-tive history of Drosophila melanogaster. Heredity98:65–68. Tachida, H., 2000 Molecular evolution in a multisite nearly neutral
mutation model. J. Mol. Evol.50:69–81.
Tajima, F., 1989 Statistical method for testing the neutral mutation
hypothesis by DNA polymorphism. Genetics123:585–595. Takano-Shimizu, T., 1999 Local recombination and mutation
ef-fects on molecular evolution in Drosophila. Genetics 153:
1285–1296.
Takano-Shimizu, T., 2001 Local changes in GC/AT substitution
biases and in crossover frequencies on Drosophila chromosomes. Mol. Biol. Evol.18:606–619.
Thornton, K., and P. Andolfatto, 2006 Approximate Bayesian
in-ference reveals evidence for a recent, severe bottleneck in a Netherlands population of Drosophila melanogaster. Genetics
172:1607–1619.
Warnecke, T., and L. D. Hurst, 2007 Evidence for a trade-off
be-tween translational efficiency and splicing regulation in deter-mining synonymous codon usage in Drosophila melanogaster. Mol. Biol. Evol.24:2755–2762.
Watterson, G. A., 1975 On the number of segregating sites in
ge-netical models without recombination. Theor. Popul. Biol. 7:
256–276.
Williamson, S. H., R. Hernandez, A. Fledel-Alon, L. Zhu, R.
Nielsen et al., 2005 Simultaneous inference of selection
and population growth from patterns of variation in the human genome. Proc. Natl. Acad. Sci. USA102:7882–7887.
Zeng, K., S. Shiand C. I. Wu, 2007 Compound tests for the
detec-tion of hitchhiking under positive selecdetec-tion. Mol. Biol. Evol.24:
1898–1908.
Supporting Information
http://www.genetics.org/cgi/content/full/genetics.109.101782/DC1
Estimating Selection Intensity on Synonymous Codon Usage
in a Nonequilibrium Population
Kai Zeng
and Brian Charlesworth
K. Zeng and B. Charlesworth 2 SI
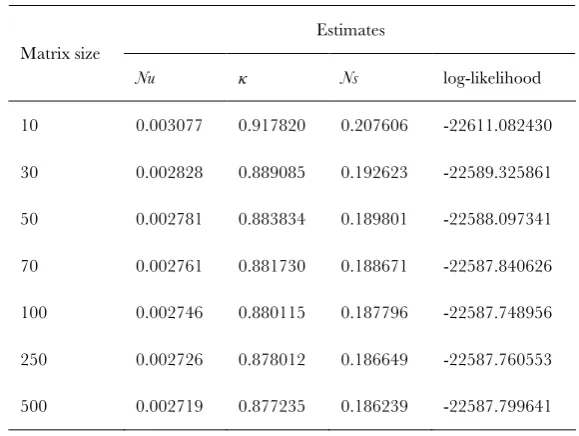
TABLE S1
Dependence of the results on thesize of the transition matrix
Estimates Matrix size
Nu κ Ns log-likelihood 10 0.003077 0.917820 0.207606 -22611.082430
30 0.002828 0.889085 0.192623 -22589.325861
50 0.002781 0.883834 0.189801 -22588.097341
70 0.002761 0.881730 0.188671 -22587.840626
100 0.002746 0.880115 0.187796 -22587.748956
250 0.002726 0.878012 0.186649 -22587.760553
500 0.002719 0.877235 0.186239 -22587.799641
The analyses were done on a data set of 25 chromosomes and 25,000 codons. This
dataset was generated randomly using the parameters N = 250, u = 10-5, κ = 1, s = 0.001, i.e.,
Nu = 2.5×10⁻³ and Ns = 2.5×10⁻¹. We used the L0 method with various sizes of the transition
K. Zeng and B. Charlesworth 3 SI
A
K. Zeng and B. Charlesworth 4 SI
C
K. Zeng and B. Charlesworth 5 SI
E
FIGURE S1.—Accuracy of Equation 7. We obtained the distribution of the number of polymorphic sites where the
K. Zeng and B. Charlesworth 6 SI
FIGURE S2.—Proportion of sites fixed for A (the preferred allele) after a recent population shrinkage. We assumed that a diploid population of size Nb was originally at equilibrium. At time zero the population size decreased instantly ten-fold to Na,
and stayed constant thereafter. The parameters used to generate this figure were: γb = 2Nbs = 2, θb = 2Nbu = 0.02, κ = 3 (The
K. Zeng and B. Charlesworth 7 SI
K. Zeng and B. Charlesworth 8 SI
FIGURE S4.—Power of the MASIDE et al. method to reject neutrality after a recent population shrinkage. We assumed that
a diploid population of size Nb was originally at equilibrium. At time zero the population size decreased instantly ten-fold to
Na, and stayed constant thereafter. The parameters used to generate this figure were: γb = 2Nbs = 2, θb = 2Nbu = 0.02, κ = 3
K. Zeng and B. Charlesworth 9 SI
A
K. Zeng and B. Charlesworth 10 SI
C
K. Zeng and B. Charlesworth 11 SI
FIGURE S5.—Performance of the L0 method in a population that has experienced a recent size expansion. The model and parameters used to generate this figure were the same as those used to generate Figure 1 (i.e., γb= 0.3, θb = 0.002, and κ = 3).
At each time point after the expansion in population size, we randomly generated 50 samples. The sample size was 15, and the total number of codons was 10,000. We then used the L0 method to analyze each of these samples. (A) The mean values of the estimates of γ. (B) The power to reject neutrality at a significance level of 5%. (C) The mean values of the estimates of
K. Zeng and B. Charlesworth 12 SI
A
K. Zeng and B. Charlesworth 13 SI
C
K. Zeng and B. Charlesworth 14 SI
FIGURE S6.—Performance of the L0 method in a population that has experienced a recent size reduction.The parameters used to generate this figure were the same as those used to generate Figure 2 (i.e., γb= 2, θb = 0.02, κ = 3). At each time point
K. Zeng and B. Charlesworth 15 SI
FIGURE S7.—Goodness of fit of the L0 model to the observed data.The black dots showed the observed values. The lines extending from each black dot indicated the 95% confidence interval. In the y-axis, exp means the expected value, and obs
K. Zeng and B. Charlesworth 16 SI
A
K. Zeng and B. Charlesworth 17 SI
FIGURE S8.—Performance of the Akashi-Schaeffermethod in a population that has experienced a recent size expansion.
The model and parameters used to generate this figure were the same as those used to generate Figure 1 (i.e., γb= 0.3, θb =
K. Zeng and B. Charlesworth 18 SI
A
K. Zeng and B. Charlesworth 19 SI
FIGURE S9.—Performance of the Akashi-Schaeffermethod in a population that has experienced a recent size reduction.
The parameters used to generate this figure were the same as those used to generate Figure 2 (i.e., γb= 2, θb = 0.02, κ = 3).
K. Zeng and B. Charlesworth 20 SI
A
K. Zeng and B. Charlesworth 21 SI
FIGURE S10.—Performance of the Cutter-Charlesworth method in a population that has experienced a recent size
expansion. The model and parameters used to generate this figure were the same as those used to generate Figure 1 (i.e., γb=
0.3, θb = 0.002, and κ = 3). At each time point after the expansion in population size, we randomly generated 500 samples.
K. Zeng and B. Charlesworth 22 SI
A
K. Zeng and B. Charlesworth 23 SI
FIGURE S11.—Performance of the Cutter-Charlesworthmethod in a population that has experienced a recent size
reduction.The parameters used to generate this figure were the same as those used to generate Figure 2 (i.e., γb= 2, θb = 0.02,