Open Peer Review
Any reports and responses or comments on the
article can be found at the end of the article.
SOFTWARE TOOL ARTICLE
Malaria Data by District: An open-source web application for
increasing access to malaria information
[version 1; peer review:
1 approved with reservations]
Sean Tomlinson
,
Andy South
, Joshua Longbottom
1,2*
Sean Tomlinson ( ), Andy South ( ) Corresponding authors: [email protected] [email protected]
: Conceptualization, Methodology, Project Administration, Software, Writing – Original Draft Preparation, Writing – Author roles: Tomlinson S
Review & Editing; South A: Conceptualization, Methodology, Project Administration, Software, Writing – Review & Editing; Longbottom J: Conceptualization, Methodology, Project Administration, Software, Writing – Original Draft Preparation, Writing – Review & Editing
No competing interests were disclosed. Competing interests:
This work was a runner-up in the 2019 Wellcome Data Re-use Prize in Malaria and is eligible for publication on Wellcome Grant information:
Open Research. The work itself is not associated with a funded project. ST acknowledges additional funding from the Medical Research Council (Award no. 1855159). JL acknowledges additional funding from the Medical Research Council (Award no. 1964851).
© 2019 Tomlinson S . This is an open access article distributed under the terms of the ,
Copyright: et al Creative Commons Attribution License
which permits unrestricted use, distribution, and reproduction in any medium, provided the original work is properly cited.
Tomlinson S, South A and Longbottom J.
How to cite this article: Malaria Data by District: An open-source web application for increasing Wellcome Open Research 2019, :151 (
access to malaria information [version 1; peer review: 1 approved with reservations] 4 )
https://doi.org/10.12688/wellcomeopenres.15495.1
09 Oct 2019, :151 ( )
Introduction inform local decision making. Recent reviews have suggested that data repositories are mainly targeted toward researchers rather than decision makers and that there is a need to improve indicator data use in low- and middle-income countries (Briand et al., 2018; Omumbo et al., 2013). We describe the development of an open-source web application, MaDD (Malaria Data by District) (Tomlinson et al., 2019), that enables disease distribution data to be more accessible at a local level.
The Malaria Atlas Project (MAP) is an international consor-tium which provides geographical information on diverse aspects of malaria epidemiology (Hay & Snow, 2006). The open-access data generated by MAP have the potential to influ-ence policy at the national and subnational level (Hay & Snow, 2006; Moyes et al., 2013). The project includes sophisticated interpolation models that allow inference of malaria preva-lence, as detailed in national and regional indicator surveys, at non-sampled locations (Giorgi et al., 2018; Hay & Snow, 2006). Getting contemporary estimates of malaria metrics to policy makers is essential, but barriers to acceptance exist, notably for modelled predictions; these include the complex-ity of the statistics described within output reports, and the description of assumptions made during the modelling process (Whitty, 2015). Additional barriers include the sheer wealth of data available, making it difficult to find and choose data sur-faces despite central repositories that may be easily navigable. These factors have contributed towards a general lack of modelled outputs being used by local-level implementation programmes in Africa (Omumbo et al., 2013).
Most modelled MAP data are provided as spatial estimates, presented as 5 × 5 km gridded surfaces, for example, estimates of Plasmodium falciparum prevalence and mortality, estimates of indoor residual spraying coverage and estimates of dominant vector species distributions and abundance (Bhatt et al., 2015;
Gething et al., 2016; Sinka et al., 2016). Though data gener-ated at this spatial resolution provides a visual indication of subnational disparities, it is not immediately clear how these data may be used directly in operational decision-making. For modelled data to be utilised by operational staff at a to perform district-level comparisons. Here, we present an appli-cation that allows rapid generation and comparison of summary statistics for a select suite of malaria indicator variables at the sub-national administrative level. MaDD is open-source and coded in R, so it can easily be modified to address
Malaria and malaria-associated data from MAP are curated from a wide variety of sources, including national control pro-grammes, national survey data, satellite imagery, published and grey literature (Moyes et al., 2013). Presently, MAP pro-down to four impactful malariometric variables, these are:
1. Malaria incidence: all-age incidence rate (clinical cases per 1,000 population per annum) of Plasmodium falciparum malaria (Bhatt et al., 2015).
Implementation
We used R (version 3.5.0) and the Shiny (version 1.2.0) framework to develop an online user-interface which allows users to interact with African MAP data, providing sum-mary statistics by subnational administrative units (Chang
et al., 2018; R Core Team, 2019). Shiny allows interactive web applications to be created with R code. This enables the creation and modification of web applications by researchers without specific knowledge of application scripting languages and workflows, something that traditionally required a dedi-cated web developer. During development we made several choices regarding the user interface (UI) to ensure that the tool is user-friendly. The key goal that drove UI development was ease of use. The aim was to minimise the total number of inputs that the user was required to consider and maximise the space allocated for visualising the spatial surfaces and output report statistics. The UI for MaDD went through several itera-tions during development to reflect growing functionality and target audience feedback. Anticipated target audiences for MaDD are detailed in Table 1. hosted platform allows computation and memory requirements to be handled by the hosting server, reducing the technical require-ments for users. MaDD can also be run from the source code locally using R and RStudio. All source code for MaDD can be found under version control at https://github.com/SeanTomlin-son30/SHINY-map-prize. The minimum system requirements of R and RStudio may change and can be found at https://www.r-project.org/ and https://www.rstudio.com/, respectively.
Use case over polygons (boundaries representing each administrative unit) to determine the name of the visualised administrative unit.
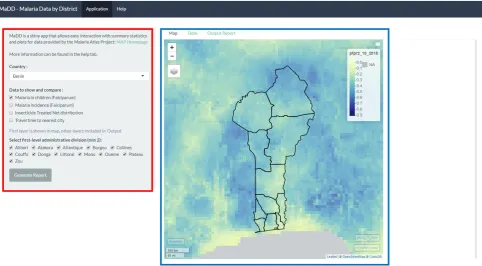
In the input section on the left, users can filter tive divisions to compare; by default, all first-level administra-tive divisions for the country are selected. The mean values est malaria prevalence, lowest proportional coverage of bed nets and most remote district. This allows the user, for exam-ple, to order the rows based on malaria prevalence and then quickly see whether the administrative units with the greatest need also have other underperforming metrics; for example, a low proportional coverage of bed nets. There are likely to be other complicating factors influencing the interac-tion and causality across metrics, but this table allows users to determine where broad patterns are not as expected.
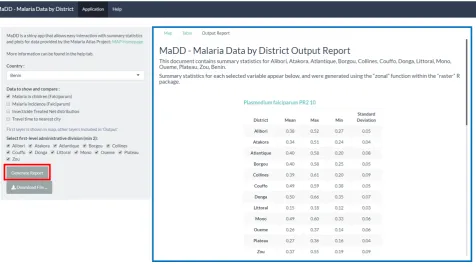
The “Generate Report” button present at the bottom of the left-hand side panel is used to generate summary statistics and country-specific choropleth maps, which are then shown in the “Output Report” tab (Figure 3). These maps are also pro-vided as a rendered RMarkdown document (saved locally as a temporary file on the user’s machine). Once the report is generated, a “Download Report” button becomes available, on the left-hand side panel, which enables the user to save the report as a locally viewable HTML file.
Discussion
We present, MaDD (Tomlinson et al., 2019) a prototype user interface demonstrating how MAP and other data can be made more accessible to local decision makers. MaDD per-mits easy access to MAP data at the level of administrative units, through administrative division aggregation, interactive tables and plots. MaDD has been developed with open-source software and can be easily edited to include additional data surfaces, calculations, visualisations, or expanded to focus on specific geographic regions.
One of the biggest challenges in developing successful dig-ital tools is in getting them adopted and used (Knight et al., 2016). This has been recognised for digital projects in the development sector, prompting a set of Principles for Digital Development. These include recommendations that projects
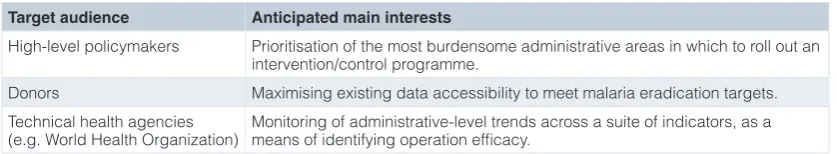
Table 1. Anticipated main interests for target audiences.
Target audience Anticipated main interests
High-level policymakers Prioritisation of the most burdensome administrative areas in which to roll out an intervention/control programme.
Figure 1. Screenshot of the Malaria Data by District application homepage. The main application page is split into a user input field (red box), which allows user to select the country, variable and districts of choice. The selected country is interactively plotted on the right side of the main page (blue box) and visualises the variables selected by the user.
be designed with the user, understand the existing ecosystem, be collaborative and use open standards, open data, and open-source. Using open-source code (and particularly R given its wide adoption within a broad user community beyond computer scientists) has the advantage that tools can be adapted to fit local needs.
MaDD was developed to show summary statistics and plots for four impactful variables relating to malaria control; how-ever, the framework we have developed is receptive to any of the surfaces generated by MAP. Though MaDD was developed for the African continent, future work could expand to include additional countries of interest, such as those with endemic malaria transmission in Asia or South America. Presenting pub-licly available data in an easily interactable and navigable way has the potential to increase public engagement and awareness of malaria trends to those concerned. We hoped that providing this demonstration and open-source code would allow others to create similar applications using data to inform local deci-sion making for disease control. We were pleased to be recently contacted by the Data Integration team at USAID President’s Malaria Initiative, who indicated they are integrating our appli-cation into their own malaria information platform (Okoko, personal communications). They are developing analytical tools to inform the geographic allocation of malaria resources by in-country staff and national malaria control programmes in 27 countries and have plans to adapt our code to their own needs. We look forward to this and other open tools being developed to improve the use of data for local decision
Data availability
The malariometric datasets analysed during this study are available from the Malaria Atlas Project database at: http:// www.map.ox.ac.uk/explorer/, and the malariaAtlas R package (Pfeffer et al., 2018).
These data are available under the terms of a Creative Commons Attribution 3.0 license (CC BY 3.0).
Software availability
MaDD application available at: https://seantomlinson30. shinyapps.io/shiny-map-prize/.
Source code available from: https://github.com/SeanTomlinson 30/SHINY-map-prize.
Archived source code at time of publication: https://doi.org/ 10.5281/zenodo.3466884 (Tomlinson et al., 2019).
License: MIT License.
Author contributions
All authors conceived the project, created and maintain the application, and were responsible for data curation, investi-gation and methodology development. JL and ST wrote the first draft of the manuscript, and all authors reviewed and
Acknowledgements
The authors would like to thank Professor Martin J Donnelly who provided feedback on functionality and UI during devel-opment. The authors are very grateful to Mr James D G Miles for testing MaDD near the end of development for bugs and
unintended behaviour. This work was produced for the Wellcome Data Re-use Prize, for which winning applications would receive a monetary prize. The authors formed a team that won a run-ner’s up prize of £5000. We thank Lungi Okoko for permission to reference our personal communications in this article.
References
Bhatt S, Weiss DJ, Cameron E, et al.: The effect of malaria control on
Plasmodium falciparum in Africa between 2000 and 2015. Nature. 2015;
526(7572): 207–211.
PubMed Abstract |Publisher Full Text |Free Full Text
Briand D, Roux E, Desconnets JC, et al.: From global action against malaria to
local issues: state of the art and perspectives of web platforms dealing with malaria information. Malar J. 2018; 17(1): 122.
PubMed Abstract |Publisher Full Text |Free Full Text
Chang W, Cheng J, Allaire J, et al.: shiny: Web Application Framework for R. R
package version 1.2.0. [Online]. 2018. Reference Source
Flueckiger RM, Nikolay B, Gelderblom HC, et al.: Integrating data and resources
on neglected tropical diseases for better planning: the NTD mapping tool (NTDmap.org). PLoS Negl Trop Dis. 2015; 9(2): e0003400.
PubMed Abstract |Publisher Full Text |Free Full Text
Food and Agriculture Organization of the United Nations: The Global
Administrative Unit Layers (GAUL): Technical Aspects. Rome: Food and Agriculture Organization of the United Nations, EC-FAO Food Security Programme (ESTG), 2008.
Reference Source
Gething PW, Casey DC, Weiss DJ, et al.: Mapping Plasmodium falciparum
Mortality in Africa between 1990 and 2015. N Engl J Med. 2016; 375(25): 2435–2445.
PubMed Abstract |Publisher Full Text |Free Full Text
Giorgi E, Diggle PJ, Snow RW, et al.: Geostatistical Methods for Disease
Mapping and Visualisation Using Data from Spatio-temporally Referenced Prevalence Surveys. Int Stat Rev. 2018; 86(3): 571–597.
Publisher Full Text
Hay SI, Snow RW: The malaria Atlas Project: developing global maps of
malaria risk. PLoS Med. 2006; 3(12): e473. PubMed Abstract |Publisher Full Text |Free Full Text
Hijmans RJ: raster: Geographic Data Analysis and Modeling. R package version
2.8-19. [Online]. 2019. Reference Source
Knight GM, Dharan NJ, Fox GJ, et al.: Bridging the gap between evidence
and policy for infectious diseases: How models can aid public health
decision-making. Int J Infect Dis. 2016; 42: 17–23. PubMed Abstract |Publisher Full Text |Free Full Text
Kraemer MUG, Hay SI, Pigott DM, et al.: Progress and Challenges in Infectious
Disease Cartography. Trends Parasitol. 2016; 32(1): 19–29. PubMed Abstract |Publisher Full Text
Malaria Atlas Project: Interactive map and data explorer [Online]. 2019.
Reference Source
Moyes CL, Temperley WH, Henry AJ, et al.: Providing open access data online to
advance malaria research and control. Malar J. 2013; 12: 161. PubMed Abstract |Publisher Full Text |Free Full Text
Omumbo JA, Noor AM, Fall IS, et al.: How well are malaria maps used to design
and finance malaria control in Africa? PLoS One. 2013; 8(1): e53198. PubMed Abstract |Publisher Full Text |Free Full Text
Pfeffer DA, Lucas TCD, May D, et al.: malariaAtlas: an R interface to global
malariometric data hosted by the Malaria Atlas Project. Malar J. 2018; 17(1): 352. PubMed Abstract |Publisher Full Text |Free Full Text
R Core Team: R: A language and environment for statistical computing. R
Foundation for Statistical Computing, Vienna, Austria. 2019.
Reference Source
Sinka ME, Golding N, Massey NC, et al.: Modelling the relative abundance of
the primary African vectors of malaria before and after the implementation of indoor, insecticide-based vector control. Malar J. 2016; 15: 142.
PubMed Abstract |Publisher Full Text |Free Full Text
Teucher A, Russell K: rmapshaper: Client for ‘mapshaper’ for ‘Geospatial’
Operations. R package version 0.4.1. 2018. Reference Source
Tomlinson S, Longbottom J, South A: SeanTomlinson30/SHINY-map-prize: MaDD
(Version v1). Zenodo. 2019.
http://www.doi.org/10.5281/zenodo.3466884
Weiss DJ, Nelson A, Gibson HS, et al.: A global map of travel time to cities to
assess inequalities in accessibility in 2015. Nature. 2018; 553(7688): 333–336. PubMed Abstract |Publisher Full Text
Whitty CJ: What makes an academic paper useful for health policy? BMC Med.
2015; 13: 301.
1.
2.
3.
4.
Open Peer Review
Current Peer Review Status:
Version 1
10 October 2019 Reviewer Report
https://doi.org/10.21956/wellcomeopenres.16953.r36713
© 2019 Macharia P. This is an open access peer review report distributed under the terms of the Creative Commons
, which permits unrestricted use, distribution, and reproduction in any medium, provided the original
Attribution License
work is properly cited.
Peter Macharia
Population Health Unit, Kenya Medical Research Institute - Wellcome Trust Research Programme,
Nairobi, Kenya
The authors describe an application that has a big potential, especially for policy makers to make
informed decisions by making public health-related datasets/maps easily accessible via an online
platform. My main comments include allowing for more flexibility for the end-user (allow the user to
pre-load a shapefile of choice or present more options) and incorporation of more public health-related
datasets.
While refining MAP data to four products makes the app easily navigable, what of other users who
might be interested in other products and not necessarily the four that were chosen for MaDD?
Are there plans to extend the app and have more products? There are more spatial products in the
public domain that would benefit from being repackaged at a subnational scale for district
managers. For example, the population distribution maps, gridded surface showing travel time to
different tiers of healthcare. This is because the end users of the app are mainly policy makers as
opposed to researchers.
The subnational boundaries are dynamic and vary by size, shape and number within a country. It
would be important for the policy makers to be able to load different sub-national units within the
app or add functionality to the app to load boundaries from other sources (
GADM HDX DIVA-GIS
,
,
and others).
It is also often the case that a country has different administrative boundaries at level 2, 3 and 4
and users would be interested at lower scale variation if they are district managers. For example,
under the current implementation of MaDD, Kenya is shown by its 8 former provinces while the
current structure is 47 sub national units (counties) representing 47 county governments which are
further broken down to sub counties and wards.
Is the description of the software tool technically sound?
Yes
Are sufficient details of the code, methods and analysis (if applicable) provided to allow
replication of the software development and its use by others?
Yes
Is sufficient information provided to allow interpretation of the expected output datasets and
any results generated using the tool?
Yes
Are the conclusions about the tool and its performance adequately supported by the findings
presented in the article?
Yes
No competing interests were disclosed.
Competing Interests:
Reviewer Expertise:
Disease mapping and spatial analysis.