Open Access
Proceedings
Semiparametric methods for genome-wide linkage analysis of
human gene expression data
Guoqing Diao*
1and DY Lin
2Address: 1Department of Statistics, George Mason University, 4400 University Drive, MS 4A7, Fairfax, Virginia 22030, USA and 2Department of
Biostatistics, University of North Carolina, McGavran-Greenberg Hall, CB #7420, Chapel Hill, North Carolina 27599, USA Email: Guoqing Diao* - [email protected]; DY Lin - [email protected]
* Corresponding author
Abstract
With the availability of high-throughput microarray technologies, investigators can simultaneously measure the expression levels of many thousands of genes in a short period. Although there are rich statistical methods for analyzing microarray data in the literature, limited work has been done in mapping expression quantitative trait loci (eQTL) that influence the variation in levels of gene expression. Most existing eQTL mapping methods assume that the expression phenotypes follow a normal distribution and violation of the normality assumption may lead to inflated type I error and reduced power. QTL analysis of expression data involves the mapping of many expression phenotypes at thousands or hundreds of thousands of marker loci across the whole genome. An appropriate procedure to adjust for multiple testing is essential for guarding against an abundance of false positive results. In this study, we applied a semiparametric quantitative trait loci (SQTL) mapping method to human gene expression data. The SQTL mapping method is rank-based and therefore robust to non-normality and outliers. Furthermore, we apply an efficient Monte Carlo procedure to account for multiple testing and assess the genome-wide significance level. Particularly, we apply the SQTL mapping method and the Monte-Carlo approach to the gene expression data provided by Genetic Analysis Workshop 15.
from Genetic Analysis Workshop 15
St. Pete Beach, Florida, USA. 11–15 November 2006
Published: 18 December 2007
BMC Proceedings 2007, 1(Suppl 1):S83
<supplement> <title> <p>Genetic Analysis Workshop 15: Gene Expression Analysis and Approaches to Detecting Multiple Functional Loci</p> </title> <editor>Heather J Cordell, Mariza de Andrade, Marie-Claude Babron, Christopher W Bartlett, Joseph Beyene, Heike Bickeböller, Robert Culverhouse, Adrienne Cupples, E Warwick Daw, Josée Dupuis, Catherine T Falk, Saurabh Ghosh, Katrina A Goddard, Ellen L Goode, Elizabeth R Hauser, Lisa J Martin, Maria Martinez, Kari E North, Nancy L Saccone, Silke Schmidt, William Tapper, Duncan Thomas, David Tritchler, Veronica J Vieland, Ellen M Wijsman, Marsha A Wilcox, John S Witte, Qiong Yang, Andreas Ziegler, Laura Almasy and Jean W MacCluer</editor> <note>Proceedings</note> <url>http://www.biomedcentral.com/content/pdf/1753-6561-1-S1-info.pdf</url> </supplement>
This article is available from: http://www.biomedcentral.com/1753-6561/1/S1/S83
© 2007 Diao and Lin; licensee BioMed Central Ltd.
Background
With the availability of high-throughput microarray tech-nologies to measure the expression levels of many thou-sands of genes simultaneously, investigators have developed a vast amount of statistical and computational methods for analyzing microarray data in the last decade. On the other hand, because of the abundance of single-nucleotide polymorphisms (SNPs) as well as the modern genotyping technologies, tremendous efforts have been focused on the genetic mapping of complex human dis-eases, many of which are associated with quantitative traits. However, limited work has been done in combin-ing gene expression data and marker genotype data and detecting expression quantitative trait loci that influence the variation in levels of gene expression.
There are important challenges in mapping of eQTL. First, it is well known that microarray data are noisy due to sys-tematic biases and appropriate normalization procedures are needed to adjust for such biases. Many expression phe-notypes may be non-normally distributed even after proper normalization procedures, as is evident by the gene expression data provided by Genetic Analysis Work-shop 15 (GAW15). Commonly used eQTL mapping methods such as the standard variance-component (VC) approach implemented in programs SOLAR [1] and Mer-lin [2] assume that the expression phenotypes follow a normal distribution. However, violation of the normality assumption may lead to inflated type I error and reduced power. The other challenge is the multiple testing intro-duced in the mapping of many expression phenotypes at thousands or hundreds of thousands of marker loci across the whole genome. A proper procedure to adjust for mul-tiple testing is essential for guarding against an abundance of false-positive results.
To overcome the aforementioned challenges, we first applied the semiparametric quantitative trait loci map-ping method of Diao and Lin [3] to gene expression data. The SQTL mapping method is rank-based and therefore less sensitive to non-normality and outliers. Next, we used an efficient Monte Carlo procedure to assess the genome-wide significance level. The usefulness of the SQTL method and the Monte-Carlo approach is demonstrated through an application to the gene expression data pro-vided by GAW15, which were previously analyzed by Morley et al. [4].
Methods
Semiparametric QTL mapping
Very recently, Diao and Lin [3] proposed the so-called SQTL mapping method for human pedigrees by allowing a completely unspecified transformation on trait values. Specifically, the phenotypic variation after the unspecified transformation is partitioned into fixed effects due to
environmental variables and random effects due to major gene, polygene, and residual errors. In the context of VC analysis, the SQTL tends to be more powerful than the regression-based methods, including the one used in Mor-ley et al. [4], as is shown in the simulation studies in Diao and Lin [3]. Moreover, the SQTL approach is rank-based and less sensitive to non-normality and outliers. Simula-tion studies in Diao and Lin [3] demonstrate that the SQTL is as powerful as the standard VC method assuming normality and tends to be more powerful than the stand-ard VC method when the phenotype data are non-nor-mally distributed or there exist outliers.
For the gene expression data, we repeatedly applied the SQTL and perform a genome-wide linkage scan for each expression phenotype. The resultant likelihood ratio test statistics or LOD scores for testing H0 : = 0 vs. HA : > 0 can be stored in a matrix with the (i, j)th component
corresponding to the result for mapping the ith expression
phenotype at the jth marker on the genome, where is
the variance component attributable to the major gene locus. Under the null hypothesis of no linkage at a marker locus, the likelihood-ratio test statistic has an approxi-mate distribution of .
Adjustment for multiple testing
In eQTL mapping, one performs testing on thousands of marker loci for each expression trait and one thus needs to adjust for multiple testing to guard against an abundance of false-positive results. Carlborg et al. [5] suggested that significance testing should be based on empirical genome-wide significance thresholds that are derived for each trait separately. Lin and Zou [6] and Lin [7] proposed an efficient Monte Carlo approach to adjusting for multi-ple comparisons in a genomic study. The Monte Carlo approach involves repeatedly generating standard normal random variables to approximate the joint distribution of the test statistics under the null distribution. Unlike the permutation resampling approach, the Monte Carlo approach does not involve repeated analyses of simulated data sets and is thus computationally less demanding. Computing is a critical issue in practice because one may perform millions of tests for each gene expression trait. For example, to perform genome-wide linkage scans for all expression phenotypes in the GAW15 (Problem 1) data set, one needs to perform approximately 10.2 mil-lion tests. Even if we only perform 1000 permutation tests for each phenotype, the total number of tests increases to 10.2 billion, which makes it almost impossible with cur-rent computing power. To obtain results at more stringent genome-wide significance levels, even more permutations
are required. Furthermore, the Monte Carlo approach is widely applicable in practical situations, whereas permu-tation tests may not always be applicable in the presence of covariates and nuisance parameters, especially when the covariates are related to the pedigree structure such as age and gender. For sibship data, one can simply decouple the marker data from the phenotype data, with any covari-ates following the phenotype data in permutation tests. This strategy, however, may not always work for pedigree data. For example, if covariates include age and gender, the permutation of the covariates together with pheno-type data may not be consistent with the pedigree struc-ture because age and gender are not interchangeable between parents and offspring.
To apply the Monte Carlo approach to the gene expression data, we assess the genome-wide significance level for each expression trait and obtain the trait-specific adjusted
p-values as described in Lin [7]. Note that the test in SQTL is one-sided and corresponding adjustment is required [6].
Results
The gene expression data provided to GAW15 include 14 three-generation CEPH (Centre d'Etude du Polymor-phisme Humain) Utah families, each of which consists of 13 or 14 individuals. We performed genome-wide linkage scans for expression levels of 3554 genes at 2882 SNPs using SQTL. We utilized SOLAR to estimate the identity-by-descent (IBD) allele-sharing probabilities at each SNP locus after eliminating Mendelian inconsistencies. Gender is included in the model as a covariate. The genome-wide significance levels and the adjusted p-values for each trait were based on 100,000 Monte Carlo samples. The average thresholds (on a LOD scale) at the genome-wide signifi-cance levels of 0.05, 0.01, 1.0 × 10⁻³, 1.0 × 10⁻⁴, and 1.0 ×
10-5 are 1.34, 1.70, 2.50, 3.59, and 4.68 corresponding to
point-wise p-values of 6.5 × 10⁻³, 2.6 × 10⁻³, 3.5 × 10⁻⁴, 2.4
× 10-5, and 1.7 × 10⁻⁶, respectively. The relatively low
thresholds compared to those used in Morley et al. [4] may reflect the strong correlations among the test statistics across the genome.
At the genome-wide significance level of 0.05, for 954 expression phenotypes, there was evidence of linkage to specific chromosomal regions. We found 356, 200, 185, and 179 expression phenotypes with evidence of linkage at the genome-wide significance levels of 0.01, 1.0 × 10⁻³,
1.0 × 10⁻⁴ and 1.0 × 10⁻⁵, respectively. We detected 58
more expression traits at the genome-wide significance level of 1.0 × 10⁻³ than Morley et al. [4].
As in Morley et al. [4], we divided the autosomal chromo-somes into 491 windows of 5 Mb and determined the number of regulators mapping to each window. Table 1 presents the results for the five windows that have the most mapped phenotypes at a genome-wide significance level of 1.0 × 10⁻⁵. At the genome-wide significance level
of 1.0 × 10⁻³, we found 68 hotspots with six or more hits,
including the only 2 hotspots on chromosomes 14 and 20, with six and seven hits each detected by Morley et al. [4]. Even at the very stringent genome-wide significance level of 1.0 × 10⁻⁵, regulators for 51 phenotypes were
found to map to the window on chromosome 10 (10p12).
Among the total 3554 expression phenotypes, almost half of them appear to be non-normally distributed by using the Shapiro test at a significance level of 0.05. At a signifi-cance level of 0.0001, the Shapiro tests for normality are still significant for more than 19% of phenotypes. Table 2 presents the summary statistics for four extremely non-normally distributed expression traits with p-values of Shapiro test less than 1.0 × 10⁻¹²: 211518_s_at,
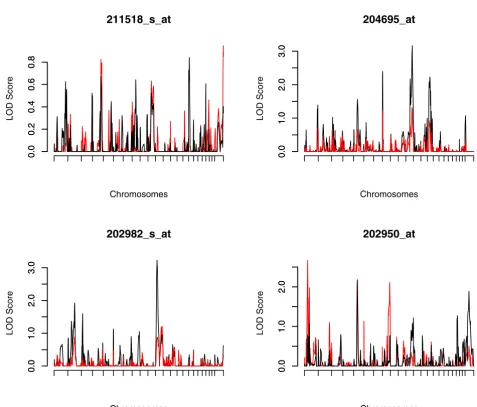
204695_at, 202982_s_at, and 202950_at. The histograms of these four traits are shown in Figure 1. Phenotype 211518_s_at appears to be right-skewed and the other three appear to be left-skewed. There exist two and one outliers in the left for 202982_s_at and 202950_at, respec-tively, each with difference from the mean greater than seven times the corresponding standard deviation. We further performed multipoint genome-wide linkage analysis for the four non-normally distributed pheno-types and compared the performance of SQTL with that of
Table 1: Number of mapped phenotypes at the genome-wide significance levels of 0.01, 0.05, 1.0 × 10⁻³, 1.0 × 10⁻⁴, and 1.0 × 10⁻⁵
Count of mapped phenotypesa
Chromosome Region *α = 0.05 α = 0.01 α = 1.0 × 10⁻³ α = 1.0 × 10⁻⁴ α = 1.0 × 10⁻⁵
10 26.35817Mb-29.46754Mb 244 117 61 56 51
19 60.12027Mb-63.63787Mb 52 25 17 17 17
21 46.14523Mb-46.84680Mb 91 34 18 15 15
22 21.40594Mb-24.67240Mb 79 34 25 23 23
22 42.36342Mb-43.48228Mb 54 19 15 15 15
the standard VC approach assuming normality. The multipoint IBD probabilities were estimated by using SOLAR. The whole genome linkage scan results are shown in Figure 2. For 211518_s_at, neither the SQTL nor the standard VC approaches detected any linkage signals.
Linkage scans of 204695_at and 202982_s_at demon-strate that the standard VC approach is sensitive to non-normality and outliers and may obtain false-positive results. The standard VC approach fails to detect the eQTL on chromosome 1 identified by SQTL for 202950_at. This
Histograms showing distributions of four non-normally distributed expression phenotypes Figure 1
Histograms showing distributions of four non-normally distributed expression phenotypes.
211518_s_at
Frequency
0
2
04
06
08
0
1
0
0
2 4 6 8 10
204695_at
Frequency
0
1
03
05
0
4 5 6 7 8 9 10
202982_s_at
Frequency
0
2
04
06
08
0
3 4 5 6 7 8 9
202950_at
Frequency
02
0
4
0
6
0
6 7 8 9 10 11 12
Table 2: Summary statistics of four non-normally distributed expression phenotypes
Gene Mininum Mean SD Maximum Skewness Kurtosis p-Value of Shapiro test
211518_s_at 2.10 3.50 1.06 9.13 2.59 8.47 3.3 × 10⁻¹⁷
204695_at 4.21 8.44 0.94 9.79 -1.82 3.95 1.7 × 10⁻¹³
finding may reflect the fact that SQTL tends to be more powerful than the standard VC QTL mapping method in the presence of non-normally distributed data or outliers.
Discussion
In this work, we applied the robust and powerful SQTL method to gene expression data and applied an efficient Monte Carlo procedure to account for multiple testing and to assess the genome-wide significance level. With the application to the GAW15 data, we detected many more eQTLs and hotspots at stringent genome-wide signifi-cance levels than Morley et al. [4]. Our new findings may be attributable to four factors. First, Morley et al. utilized only the data of siblings and much information from the
parents and grandparents were missing, whereas the SQTL is applicable to arbitrary pedigrees. Second, in the context of VC analysis, SQTL tends to be more powerful than the regression-based methods including the one used in Mor-ley et al.; see Diao and Lin [3]. Third, the SQTL approach is rank-based and tends to be more powerful than its par-ametric counterpart in the presence of nonnormal traits or outliers. Finally, the procedure used in Morley et al. to adjust for multiple testing is overly conservative.
The Monte-Carlo approach described in this work adjusts for multiple testing across the genome. It would be desir-able to develop an efficient procedure to account for mul-tiplicities across the genome and mulmul-tiplicities across gene
LOD score plots for four non-normally distributed expression phenotypes: SQTL (red solid) and standard VC approach (black solid)
Figure 2
LOD score plots for four non-normally distributed expression phenotypes: SQTL (red solid) and standard VC approach (black solid).
0.0
0.2
0.4
0.6
0.8
211518_s_at
Chromosomes
LOD Score
0.0
1.0
2.0
3.0
204695_at
Chromosomes
LOD Score
0.0
1.0
2.0
3.0
0.0
0.2
0.4
0.6
0.8
0.0
1.0
2.0
3.0
202982_s_at
Chromosomes
LOD Score
0.0
1.0
2.0
202950_at
Chromosomes
LOD Score
0.0
1.0
2.0
3.0
0.0
1.0
expressions simultaneously. Furthermore, the Monte-Carlo approach requires a large sample size in order to accurately approximate the joint distribution of the test statistics. Previous simulation studies demonstrated that the Monte-Carlo approach performed well for sample size as small as 50 pedigrees (results not shown). Future research is needed in evaluating the performance of the Monte-Carlo approach in small sample size situations. With the availability of the abundance of SNPs, it is desir-able to perform genome-wide association analysis of expression quantitative traits following genome-wide linkage analysis. We are currently extending the semipar-ametric quantitative transmission-disequilibrium test [8] to the genome-wide association analysis of expression data.
Competing interests
The author(s) declare that they have no competing inter-ests.
Acknowledgements
This research was supported by the National Institutes of Health grant R01 CA082659.
This article has been published as part of BMC Proceedings Volume 1 Sup-plement 1, 2007: Genetic Analysis Workshop 15: Gene Expression Analysis and Approaches to Detecting Multiple Functional Loci. The full contents of the supplement are available online at http://www.biomedcentral.com/ 1753-6561/1?issue=S1.
References
1. Almasy L, Blangero J: Multipoint quantitative-trait linkage anal-ysis in general pedigrees. Am J Hum Genet 1998, 62:1198-1211. 2. Abecasis GR, Cherny SS, Cookson WO, Cardon LR: Merlin-rapid
analysis of dense genetic maps using sparse gene flow trees. Nat Genet 2002, 30:97-101.
3. Diao G, Lin DY: A powerful and robust method for mapping quantitative trait loci in general pedigrees. Am J Hum Genet
2005, 77:97-111.
4. Morley M, Molony CM, Weber TM, Devlin JL, Ewens KG, Spielman RS, Cheung VG: Genetic analysis of genome-wide variation in human gene expression. Nature 2004, 430:743-747.
5. Carlborg O, De Koning DJ, Manly KF, Chesler E, Williams RW, Haley CS: Methodological aspects of the genetic dissection of gene expression. Bioinformatics 2005, 21:2383-2393.
6. Lin DY, Zou F: Assessing genomewide statistical significance in linkage studies. Genet Epidemiol 2004, 27:202-214.
7. Lin DY: An efficient Monte Carlo approaches to assessing sta-tistical significance in genomic studies. Bioinformatics 2005,
21:781-787.
8. Diao G, Lin DY: Improving the power of association tests for quantitative traits in family studies. Genet Epidemiol 2006,