Open Access
Proceedings
Impact of normalization and filtering on linkage analysis of gene
expression data
Joseph Beyene*
1,2, Pingzhao Hu
3, Elena Parkhomenko
1,2and
David Tritchler
1,4Address: 1Department of Public Health Sciences, University of Toronto, Health Sciences Building 155 College Street, Toronto, Ontario, M5T 3M7,
Canada, 2Program in Population Health Sciences, The Hospital for Sick Children Research Institute, 555 University Avenue, Toronto, Ontario,
M5G 1X8, Canada, 3Program in Genetics and Genomic Biology, The Hospital for Sick Children Research Institute, 15-706 TMDT, 101 College
Street, Toronto, Ontario, M5G 1L7, Canada and 4Division of Epidemiology and Statistics, Ontario Cancer Institute, 610 University Avenue,
Toronto, Ontario M5G 2M9, Canada
Email: Joseph Beyene* - [email protected]; Pingzhao Hu - [email protected]; Elena Parkhomenko - [email protected]; David Tritchler - [email protected]
* Corresponding author
Abstract
Using the Problem 1 data set made available for Genetic Analysis Workshop 15, we assessed sensitivity of linkage results to a correlation-based feature extraction method as well as to different normalization procedures applied to the raw Affymetrix gene expression microarray data. The impact of these procedures on heritability estimates and on expression quantitative trait loci are investigated. The filtering algorithm we propose in this paper ranks genes based on the total absolute correlation of each gene with all other genes on the array and has the potential to extract features that may play role in functional pathways and gene networks. Our results showed that the normalization and filtering algorithms can have a profound influence on genetic analysis of gene expression data.
Background
Several recent studies have applied traditional quantita-tive trait linkage analysis to genome-wide gene expression data and have investigated the role of genetic variation in transcription [1]. These types of studies have the potential to uncover complicated transcriptional control. For exam-ple, Morley et al. and others identified several cis- and trans-acting genes and master regulators using linkage mapping on the gene expression phenotypes [1]. How-ever, gene expression measurements are not generated in
a uniform platform and, depending on the particular tech-nology, most high-level statistical analyses using these data are preceded by a number of low-level pre-processing steps. For instance, Affymetrix GeneChip arrays have become a widely used microarray platform [2] and there are various algorithms for performing feature extraction and normalization on these high-density oligonucleotide gene expression arrays [3,4]. Ideally, all of the methods and algorithms should produce similar results. In prac-tice, however, findings could be sensitive to variations in
from Genetic Analysis Workshop 15
St. Pete Beach, Florida, USA. 11–15 November 2006
Published: 18 December 2007
BMC Proceedings 2007, 1(Suppl 1):S150
<supplement> <title> <p>Genetic Analysis Workshop 15: Gene Expression Analysis and Approaches to Detecting Multiple Functional Loci</p> </title> <editor>Heather J Cordell, Mariza de Andrade, Marie-Claude Babron, Christopher W Bartlett, Joseph Beyene, Heike Bickeböller, Robert Culverhouse, Adrienne Cupples, E Warwick Daw, Josée Dupuis, Catherine T Falk, Saurabh Ghosh, Katrina A Goddard, Ellen L Goode, Elizabeth R Hauser, Lisa J Martin, Maria Martinez, Kari E North, Nancy L Saccone, Silke Schmidt, William Tapper, Duncan Thomas, David Tritchler, Veronica J Vieland, Ellen M Wijsman, Marsha A Wilcox, John S Witte, Qiong Yang, Andreas Ziegler, Laura Almasy and Jean W MacCluer</editor> <note>Proceedings</note> <url>http://www.biomedcentral.com/content/pdf/1753-6561-1-S1-info.pdf</url> </supplement>
This article is available from: http://www.biomedcentral.com/1753-6561/1/S1/S150
© 2007 Beyene et al; licensee BioMed Central Ltd.
pre-processing approaches and may lead to different results. In particular, the impact that different algorithms have on expression quantitative trait loci (eQTL) analysis is not well understood. Understanding consequences of low-level pre-processing approaches is essential in inter-preting findings from genome-wide linkage analyses of multivariate gene expression measurements. In this paper, we first propose a correlation-based filtering method. The motivation is to select genes that may participate in path-ways. We then apply three normalization methods and the filtering algorithm to the Problem 1 data set made available for Genetic Analysis Workshop 15 (GAW15). In particular, we compare and contrast heritability estimates, concordance in top-ranked genes, and impact on the number of genes identified as cis-, trans- or multiple-regu-lators.
Materials and methods
Raw gene expression measurements obtained from lym-phoblastoid cell lines from 14 Centre d'Etude du Poly-morphisme Humain (CEPH) Utah families were made available for GAW15. Furthermore, a subset consisting of 3554 genes that Morley et al. analyzed for linkage was also made available [1]. The genotypes of 2882 autosomal and X-linked SNPs of members of these families were gener-ated by The SNP Consortium http://snp.cshl.org/.
For the data in this problem, the Affymetrix Genome Focus Arrays were used. A unique feature of microarrays generated using the Affymetrix platform is the so-called MisMatch (MM) probes. Each of the probe pairs in a probe set has a Perfect Match (PM) and a MisMatch probe, with each probe having 25 bases. The PM probes are designed to bind perfectly to the gene of interest and the MM probes have a contrasting base at position 13 with the intention of measuring non-specific binding [2]. The Microarray Analysis Suite (MAS) algorithm from Affyme-trix [2] incorporates information from the MM probes into the calculation of gene expression intensities. How-ever, there is a continuing debate in the literature over the merit of MM probes as well as the impact of the various algorithms on downstream analysis. Several new algo-rithms have been proposed in recent years and most of them use only the PM signals to calculate gene expression. The algorithms include the robust multi-array average (RMA) method [3], Gene Chip RMA (GCRMA) [4], and the probe logarithmic error intensity estimate (PLIER) method from Affymetrix [2].
Morley et al. applied the MAS algorithm and selected 3554 genes using data from 94 grandparents such that the between-individual variance is larger than the within-individual variance [1]. In this report, we used raw CEL files from 194 subjects and applied the RMA, GCRMA, and PLIER algorithms to normalize and calculate gene
expression intensities. Like the MAS algorithm, the PLIER method also incorporates information from MM probes while both RMA and GCRMA use only PM signals. We then ranked genes by the total absolute correlation (TAC) that each gene i has with the other n - 1 genes. The TAC for each gene is calculated as follows:
where rij is the correlation of gene i with gene j. For this fil-tering procedure, we used expression profiling data from 56 unrelated individuals. We extracted the top 3554 genes ranked by TAC from the largest ones to the smallest ones, so that we can make qualitative comparisons with what was reported by Morley et al. [1].
After the normalization and filtering steps, we carried out multipoint linkage analysis on each of the phenotypes using the MERLIN-REGRESS command in the statistical genetics software MERLIN [5]. The variance components (VC) option in MERLIN was used to estimate heritability. As in Morley et al., cis regulators were defined as those reg-ulatory variants that mapped within 5 megabases (Mb) of the target gene [1]. All other significant linkages are cate-gorized as trans regulators. Physical locations of probe sets were obtained from the Affymetrix annotation table http:/ /www.affymetrix.com. The Rutgers map was used to estab-lish a correspondence between the physical map and the genetic map http://compgen.rutgers.edu/maps. Markers that could not be mapped using the Rutgers map, but that were located between physically anchored markers, were placed on the genetic map by interpolation.
Results
It appears that the normalization methods have a strong effect on the gene expression correlation structure. The selected genes from RMA may have lower correlation than those from GCRMA and PLIER. Depending on the method used, different genes were identified as the top-ranking genes. The overlap in probe sets extracted using
TACi =
∑
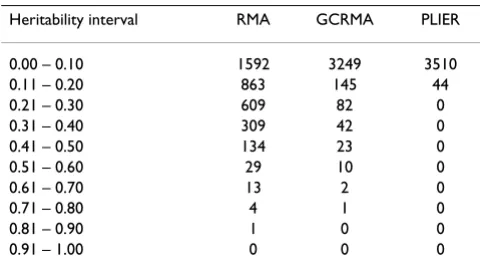
nj|rij |−1, (1)Table 1: Estimated heritability values based on the raw gene expression data sets normalized by three different methods
Heritability interval RMA GCRMA PLIER
0.00 – 0.10 1592 3249 3510
the three normalization approaches described earlier (RMA, GCRMA, and PLIER) along with our correlation-based feature extraction algorithm in comparison with the probe sets selected by Morley et al. [1] following their use of the Affymetrix MAS algorithm and a variance-based fil-tering varied from 10% to 43%. Specifically, the overlap between their results and the results from RMA, GCRMA, and PLIER were 1174/3554 (33%), 361/3554 (10%), and 1528/3554 (43%), respectively. Among these three meth-ods, the rates of concordance were as follows: RMA versus GCRMA, 1670/3554 (47%); RMA versus PLIER, 1732/ 3554 (49%); and GCRMA versus PLIER, 1149/3554 (32%).
Table 1 presents a summary of the heritability estimates corresponding to the different normalization procedures. As can be seen from this table, the PLIER method resulted in a heritability estimate of less than 0.20 for all of the
3554 traits. Heritability estimates from data processed with RMA appear to be larger than the other two methods.
Table 2 provides the number of expression phenotypes having cis-/trans-/cis and trans-regulators corresponding to the three normalization techniques and two p-value thresholds. The two p-value thresholds were chosen fol-lowing Morley et al. for comparison purposes [1]. We have not identified cis-acting regulators among the top 3554 genes when using any of the three normalization methods and p-value thresholds. Few genes were regu-lated by both cis-and-trans SNPs. The number of expres-sion phenotypes with a trans-regulator using RMA is comparable with results reported in Morley et al. using a p-value threshold of 3.7*10-5[1], in which they identified
a total of 984 expression phenotypes with regulators. However, the GCRMA resulted in much fewer genes with trans-regulators while the PLIER method detected more genes with trans-regulators at the same p-value threshold.
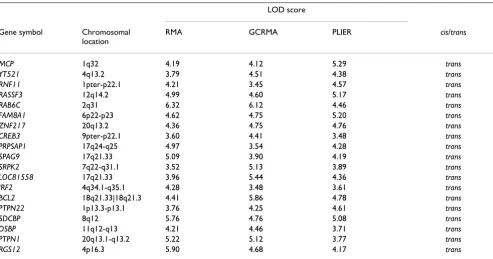
Table 3: Selected expression phenotypesa with significant evidence for linkage (LOD score ≥ 3.4) from genome scans identified in all data sets normalized by three different methods
LOD score
Gene symbol Chromosomal
location
RMA GCRMA PLIER cis/trans
MCP 1q32 4.19 4.12 5.29 trans
YT521 4q13.2 3.79 4.51 4.38 trans
RNF11 1pter-p22.1 4.21 3.45 4.57 trans
RASSF3 12q14.2 4.99 4.60 5.17 trans
RAB6C 2q31 6.32 6.12 4.46 trans
FAM8A1 6p22-p23 4.62 4.75 5.20 trans
ZNF217 20q13.2 4.36 4.75 4.76 trans
CREB3 9pter-p22.1 3.60 4.41 3.48 trans
PRPSAP1 17q24-q25 4.97 3.54 4.28 trans
SPAG9 17q21.33 5.09 3.90 4.19 trans
SRPK2 7q22-q31.1 3.52 5.13 3.89 trans
LOC81558 17q21.33 3.96 5.44 4.36 trans
IRF2 4q34.1-q35.1 4.28 3.48 3.61 trans
BCL2 18q21.33|18q21.3 4.41 5.86 4.78 trans
PTPN22 1p13.3-p13.1 3.76 4.25 4.61 trans
SDCBP 8q12 5.76 4.76 5.08 trans
OSBP 11q12-q13 4.21 4.46 3.71 trans
PTPN1 20q13.1-q13.2 5.22 5.12 3.77 trans
RGS12 4p16.3 5.90 4.68 4.17 trans
aSome regions of these genes also exhibit copy number variation in healthy individuals (see details in the text).
Table 2: Number of expression phenotypes having cis-/trans-/cis and trans-regulators at different p-value thresholds using data sets normalized by three methods (cis regulators are those that mapped within 5 Mb of the target gene)
RMA GCRMA PLIER
p-Value LOD cis trans cis+trans cis trans cis+trans cis trans cis+trans
3.7*10-5 3.4 0 910 5 0 205 1 0 2527 2
A total of 67 expression phenotypes with strong linkage (p-value ≤ 3.7*10-5) have been detected by all three
meth-ods. 19 of the 67 (28.4%) expression phenotypes with trans-regulators that have been identified in all the data
sets normalized using the three different normalized methods have also been shown to exhibit copy number variation in healthy individuals [6]. This was determined by searching the copy number variation database
availa-Box plot of LOD scores versus heritability
Figure 1
Box plot of LOD scores versus heritability. The plot shows the distributions of LOD scores at different heritability inter-vals for three normalization methods. For each gene, we took the maximum LOD score. a, RMA; b, GCRMA; c, PLIER.
0.1 0.2 0.3 0.4 0.5 0.6 0.7 0.8 0.9
24
68
10
12
Boxplot of LOD vs Heritability
Heritability
LO
D
0.1 0.2 0.3 0.4 0.5 0.6 0.8
02
468
Boxplot of LOD vs Heritability
Heritability
LO
D
(a) RMA (b) GCRMA
0.1 0.2
23
45
6
78
Boxplot of LOD vs Heritability
Heritability
LO
D
ble at http://projects.tcag.ca/variation/. These 19 expres-sion phenotypes are listed in Table 3. The genes showing copy number variation and significant linkage signals may be of interest for further biological investigation.
We took the maximum LOD score for each trait and grouped them into different heritability categories. Figure 1 shows the overall trend of maximum values of LOD scores corresponding to different heritability intervals as shown in Table 1. No clear relationship between the her-itability estimates and the maximum LOD score was seen. Some traits with high LOD scores have low heritability and other traits with high heritability have similar LOD scores as those with low heritability, as can be seen in Fig-ure 1a and 1b.
Discussion
Recently, a number of groups have started to integrate data from gene expression studies with genetic linkage analysis, leading to a new synergy between the two approaches [1]. Understanding the genetic basis of gene expression might shed light on processes that connect genotypic information to cellular- and organism-level information and systems biology. We used classical quan-titative trait loci methodology in which expression levels are treated as quantitative phenotypes and genetic vari-ants that significantly influence gene expression are sought along the entire genome. Several studies have shown that mRNA levels for many genes are heritable and mapping efforts have led to the characterization of genetic regulation in 'cis', as well as in 'trans' [1].
We applied three different normalization methods to the Problem 1 data set provided for GAW15 and carried out expression quantitative trait linkage (eQTL) analysis for 3554 traits. We used a filtering algorithm that extracts fea-tures based on a large total absolute correlation criterion to come up with the set of genes for the linkage analyses. Our findings suggest that different normalization and fil-tering algorithms can have a profound influence on genetic analysis of gene expression data. This observation is in agreement with a recent brief report by Williams et al. [7]. Our linkage analysis treated each trait independently of the others, similar to most other published work in this area [1]. Unlike the variance-based filtering used by Mor-ley et al. [1], our correlation-based filtering takes depend-ence among genes into account in the pre-processing phase. The results from our approach can be useful in interpreting linkage results and inferring which genes may participate in pathways. We have not investigated whether the gene expression measurements are normally distrib-uted, and this may also influence the power of the linkage findings.
Our choice of Pearson correlation was arbitrary but not critical. This is supported by the following analysis: we evaluated the correlations between the TAC estimated by Pearson Pearson) and that by Spearman (TAC-Spearman) for the data normalized by the three normali-zation methods. The correlations between these two measures were 0.92, 0.90, and 0.94, respectively, for expression values normalized by RMA, GCRMA, and PLIER, respectively. We also evaluated the similarity of TAC rank of the set of 3554 expression phenotypes esti-mated by Pearson and Spearman correlations. For the 2000 top-ranked genes, the proportion of overlapped set of genes based on Pearson and Spearman were 89.8%, 87.2%, and 92.2% for RMA, GCRMA and PLIER, respec-tively.
Competing interests
The author(s) declare that they have no competing inter-ests.
Acknowledgements
This research was supported in part by funding from the Natural Sciences and Engineering Research Council of Canada (NSERC), Canadian Institutes of Health Research (CIHR), and Genome Canada through the Ontario Genomics Institute. We also gratefully acknowledge insightful comments of two anonymous reviewers and the editor.
This article has been published as part of BMC Proceedings Volume 1 Sup-plement 1, 2007: Genetic Analysis Workshop 15: Gene Expression Analysis and Approaches to Detecting Multiple Functional Loci. The full contents of the supplement are available online at http://www.biomedcentral.com/ 1753-6561/1?issue=S1.
References
1. Morley M, Molony CM, Weber TM, Devlin JL, Ewens KG, Spielman RS, Cheung V: Genetic analysis of genome-wide variation in human gene expression. Nature 2004, 430:743-747.
2. Affymetrix: Microarray Suite User Guide. [http://www.affyme trix.com/support/technical/manuals.affxAffymetrix].
3. Irizarry RA, Hobbs B, Collin F, Beazer-Barclay YD, Antonellis KJ, Scherf U, Speed TP: Exploration, normalization, and summa-ries of high density oligonucleotide array probe level data. Biostatistics 2003, 4:249-264.
4. Wu Z, Irizarry RA: Preprocessing of oligonucleotide array data. Nat Biotechnol 2004, 22:656-658.
5. Abecasis GR, Cherny SS, Cookson WO, Cardon LR: Merlin-rapid analysis of dense genetic maps using sparse gene flow trees. Nat Genet 2002, 30:97-101.
6. Redon R, Ishikawa S, Fitch KR, Feuk L, Perry GH, Andrews TD, Fie-gler H, Shapero MH, Carson AR, Chen W, Cho EK, Dallaire S, Free-man JL, Gonzalez JR, Gratacos M, Huang J, Kalaitzopoulos D, Komura D, MacDonald JR, Marshall CR, Mei R, Montgomery L, Nishimura K, Okamura K, Shen F, Somerville MJ, Tchinda J, Valsesia A, Woodwark C, Yang F, Zhang J, Zerjal T, Zhang J, Armengol L, Conrad DF, Estivill X, Tyler-Smith C, Carter NP, Aburatani H, Lee C, Jones KW, Scherer SW, Hurles ME: Global variation in copy number in the human genome. Nature 2006, 444:444-454.