Article
China’s Copper Demand Forecasting Based on
System Dynamics Model
Jianbo Yang 1, Xin Li 2,*, Qunyi Liu 3
1 Institute of Mineral Resources, CAGS, Beijing 100037, China; [email protected]
2 College of Management Science, Chengdu University of Technology, Chengdu 610051, China; [email protected]
3 Research Center for Strategy of Global Mineral Resources, CAGS, Beijing 100037, China; [email protected] * Correspondence: [email protected]; Tel.: +86-136-834-08672
Abstract: Copper demand for a country's copper industry has a greater pull effect. China's copper consumption in 2015 has accounted for 50% of the world. The scientific forecast of China's copper demands trend is also an important basis for analyzing its future environmental impact. This paper assumes that China's economy will be developing high, medium and low scenarios, and forecasts economic and social indicators such as total GDP, population and per capita GDP in China from 2016 to 2030. Then, predicted the demand of copper resources in China from 2016 to 2030 by the combination of system dynamics model, ARIMA model prediction and inverted U-type empirical model. The results show that: (1) in 2020, 2025 and 2030, China's refined copper demand will be 13 Mt, 15 Mt and 15.5 Mt. (2) China's copper demand growth slowed down significantly from 2016-2030. (3) 2025-2030, China's copper resource demand is stable, into the platform of demand growth, the highest peak value in 2027 will be 15.5 Mt. (4) 2030 years later, China's copper resource demand will enter a slow decline.
Keywords: copper resources; demand forecasting; system dynamics model; sustainability development
1. Introduction
Copper (Cu) is a widely distributed metal element, and the content of copper in the crust is about 0.01%. In some copper deposits, the content can reach 3%- 5% or even higher. Copper in nature is mostly in the form of compounds as copper mineral [1]. Copper is a second largest nonferrous metal used in aluminum, with excellent ductility, conductivity, thermal conductivity, and corrosion resistance. Mainly used for construction, transportation, machinery manufacturing, electronic appliances, home appliances and other five large areas [2].
China's reform and opening up more than 30 years of rapid growth, and now economic development has entered a new stage of structural transformation. China's economic development has been driven by investment-driven and export-oriented, turning to emphasis on innovation, structural adjustment, expanding domestic demand for endogenous growth. New urbanization, industry and consumption upgrades, investment in the people's livelihood infrastructure will inject new impetus into the future economic development [3]. What are the impact of the development of copper in the various sectors of the national economy in the next 10 to 15 years? Is worthy of study.
domestic consumption-driven one and the role played by China's middle class in the slowing demand [12].
The research methods of supply and demand forecast of mineral resources are different that because of the research point of view, different ideas, methods between domestic and foreign scholars. There are two main approaches: Trend Extrapolation and Scenario Analysis. The essence of the Trend Extrapolation is that the researcher explores its development laws and trends through the study of the historical development of the research object, thus speculating on the possible state of the future. It includes time series analysis method, elastic coefficient method, multi-objective linear programming method, input-output method, RBF (Radial Basis Function) neural network model, artificial intelligence simulation model, logistic model, combined forecasting model, LEAP (Long-range Energy Alternatives Planning System model [13]. Because the Trend Extrapolation method is basing on the mathematical statistics of historical data, the subjective factors such as non-quantifiable factors and policy are not considered. That is, the qualitative analysis is not integrating into the quantitative analysis, so the long-term prediction results tend to produce large deviation. Scenario Analysis method, due to the combination of quantitative analysis and qualitative analysis of the characteristics, but also subjective factors such as non-quantifiable factors and the future of the various possible situations and the results of the maximum consideration. Scenario Analysis method has better predictive effect than other prediction methods such as Trend Extrapolation method, so it has been widely used by domestic and foreign scholars in mineral resource consumption forecast [14]. Chen et al. has used the VAR vector autoregressive model to predict the demand for Chinese steel [15].
This paper combines the two methods to predict the demand for China's copper in the next 15 years. We set out three scenarios of high, medium and low economic development in China (Table 1 and Table 2). The "S" shaped law of the per capita GDP and per capita copper consumption [16] will predict China's copper demand trends. In the middle scenario is 6.5% from 2016-2020, 6.0%from 2021-2025, and 5.5% from 2026-2030 [8].
Table 1. China's economic development trend forecast from 2016-2030
GDP growth rate (%) GDP(Trillion dollar )
year 2016-2020 2021-2025 2026-2030 2016 2020 2025 2030
scenarios of high 7.0 6.5 6.0 12.10 15.86 21.73 29.08
scenarios of medium 6.5 6.0 5.5 11.50 14.78 19.80 25.88
scenarios of low 6.0 5.5 5.0 10.90 13.76 17.98 22.95
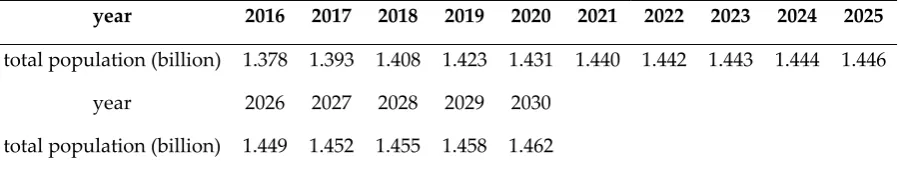
Table 2. China's population trends forecast from 2016-2030
year 2016 2017 2018 2019 2020 2021 2022 2023 2024 2025
total population (billion) 1.378 1.393 1.408 1.423 1.431 1.440 1.442 1.443 1.444 1.446
year 2026 2027 2028 2029 2030
total population (billion) 1.449 1.452 1.455 1.458 1.462
2. Methods
2.1. System Dynamics Model Based on Decomposition Method
Traditional factor decomposition of mineral resources consumption includes variables such as GDP, total consumption, and consumption intensity. The relationship between the variables can be
consumption of copper, GDP represents annual gross domestic product, then CON can be broken
down into two indicators: Copper consumption intensity (CON / GDP) and GDP product, where
CON = CON / GDP * GDP.
The total differential dCON equation for the total amount of copper consumption CON can be expressing as:
dCON=GDP*d(CON/GDP)+(CON/GDP)*dGDP (1) Since the consumption intensity of copper is INT = CON / GDP, Equation (1) can be rewritten as
dCON=GDP*dINT+INT*dGDP (2)
According to the Equation (2), the system dynamics (SD) model of copper consumption is
constructed. The model includes two traffic and multiple table functions, which can simulate the influencing factors of copper consumption and its effect.
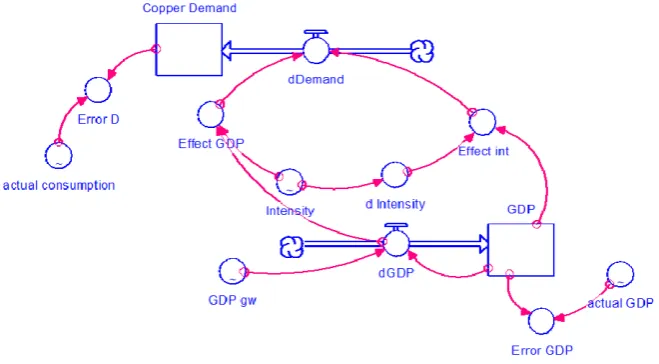
As shown in Figure 1, the SD model has two cumulative variables as stock: the annual copper demand and GDP. The annual increase in the two stocks can be expressed in terms of flow rates,
which correspond to the annual change in copper consumption (dDemand) and the annual change
in GDP (dGDP) in the model. For the dDemand variable, according to the decomposition Equation (2), can be decomposed into (GDP * dINT) and (INT * dGDP) two combinations. In the SD model of Figure 1, Effect GDP and Effect INT are expressed, respectively. The dINT is represented by the variable d intensity in the model and is the derivative of the variable intensity.
In this SD model, the increment of GDP is set to the product of stock GDP and annual growth rate GDP_gw. GDP growth rate (GDP_gw) and copper consumption intensity are using in the form of table function. Annual copper consumption and annual GDP are both simulated values, and the actual value of the year actual consumption and actual GDP are different. Therefore, this paper sets
two table functions Error_D and Error_GDP, respectively. That the annual copper consumption
simulation and the actual value of the error, the annual GDP analog value and the actual GDP error.
Figure 1. According to the decomposition method to build the copper consumption system dynamics model flow chart
Copper consumption decomposition method SD model, is the original analytical algorithm to support the decomposition method into a system dynamics model, you can achieve a model of multiple variables at the same time simulation, the consumption of copper, economic growth and other variables at the same time Dynamic Analysis.
The main simulation of the system dynamics model of the decomposition method is as follows:
dDemand = (Effect_GDP+Effect_int)/10000 GDP(t) = GDP(t – dt) + (dGDP) * dt dGDP = GDP*GDP_gw/100 d_Intensity = DERIVN(Intensity,1) Effect_GDP = dGDP*Intensity Effect_int = GDP*d_Intensity
Error_D = (Copper_Demand-actual_consumption)/Copper_Demand Error_GDP = (GDP-actual_GDP)/GDP
In this model, for above procedures, the table function actual_GDP and actual_consumption by manually entering the calendar year value assignment. Table function intensity is also the actual value over the years, calculated from the actual GDP and copper consumption.
By constructing this model, we can analyze the relationship between copper consumption demand and GDP growth. Therefore, if we can qualitatively or quantitatively assume the growth of future GDP, and copper consumption intensity has a more accurate determination, you can use this model to predict the next few years China's copper consumption demand.
2.2 Copper Consumption Intensity Trend Forecast
In this paper, we use the historical consumption intensity data of China's copper to carry out the autoregressive moving average model (ARIMA) [17], and draw lessons from the copper consumption intensity and per capita GDP of the world's major industrialized countries "U" shape relationship between the forecast [16].
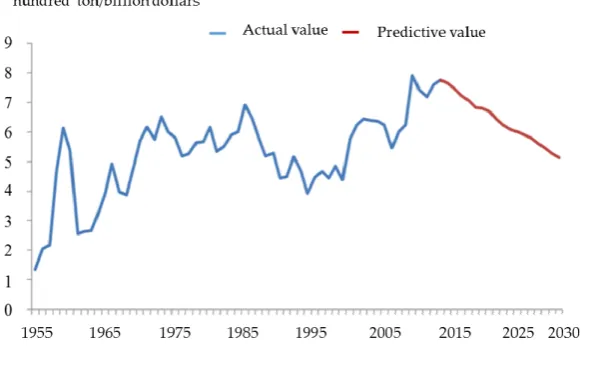
2.2.1 Based on ARIMA Model Prediction
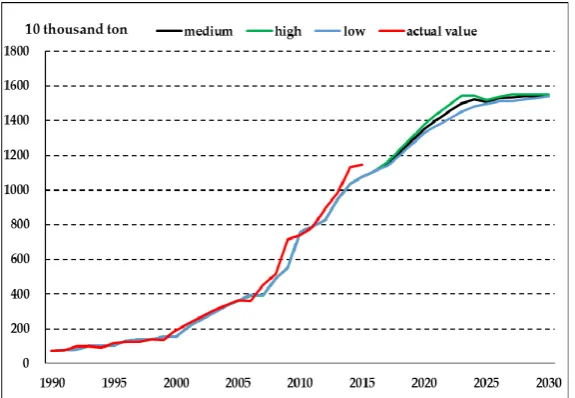
Copper consumption intensity of ARIMA (5, 1, 4) is shown in Figure 2, in which blue lines represents historical values among 1955-2015, and red lines represents forecast value among 2016-2030.
Figure 2. Forecast results of the copper consumption intensity ARIMA (5,1,4) model from 2016-2030
As shown in Figure 2, the future of China's copper consumption intensity showed a downward trend. By 2020, 2025 and 2030, respectively, 670.2 t / billion $, 611.2 t / billion $ and 511.2
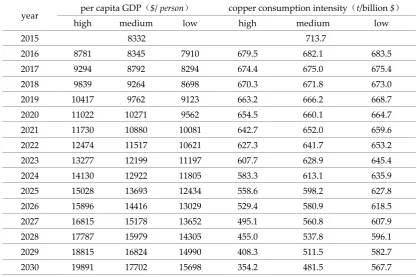
2.2.2 Based on Inverted U-Shaped Empirical Relationship Prediction
According to the literature [16] study shows that per capita GDP and copper consumption
intensity between the inverted U-shaped empirical relationship. Based on this relationship, this study selected the GDP data of several industrialized countries and copper consumption intensity data to be fitted, obtained the empirical formula, and thus the prediction of China's copper consumption intensity, the results shown in Table 3.
Table 3. Forecast of China's Copper Consumption Intensity from 2016-2030
year per capita GDP($/ person) copper consumption intensity(t/billion $)
high medium low high medium low
2015 8332 713.7
2016 8781 8345 7910 679.5 682.1 683.5
2017 9294 8792 8294 674.4 675.0 675.4
2018 9839 9264 8698 670.3 671.8 673.0
2019 10417 9762 9123 663.2 666.2 668.7
2020 11022 10271 9562 654.5 660.1 664.7
2021 11730 10880 10081 642.7 652.0 659.6
2022 12474 11517 10621 627.3 641.7 653.2
2023 13277 12199 11197 607.7 628.9 645.4
2024 14130 12922 11805 583.3 613.1 635.9
2025 15028 13693 12434 558.6 598.2 627.8
2026 15896 14416 13029 529.4 580.9 618.5
2027 16815 15178 13652 495.1 560.8 607.9
2028 17787 15979 14305 455.0 537.8 596.1
2029 18815 16824 14990 408.3 511.5 582.7
2030 19891 17702 15698 354.2 481.5 567.7
With the growth of per capita GDP, copper consumption intensity will show the first rise and fall after the development trend. In particular, for the high growth rate of per capita GDP, copper consumption intensity in 2020 after the rapid decline in 2030 may be reduced to 354.2 t /billion $. For intermediate reference, the copper consumption intensity was 660.1 t /billion $, 598.2 t/billion
$ and 481.5 t/billion $ in 2020, 2025 and 2030, respectively. The results are similar to the predictions based on the ARIMA model.
2.3 China Copper Demand Forecast Results
In the process of data simulation, the choice of data period will often have an impact on the simulation results. After the study is optimized, the simulation is predicted from 1990-2015, and the model is constructed.
The predicted values of the copper consumption intensity trend is substituted into the system dynamics diagram shown in Figure 1, and the dynamic model of copper consumption demand
under the three scenarios of high growth rate, medium speed and low speed of GDP growth is
respectively carried out.
2.3.1 Forecast Results Based on ARIMA Model
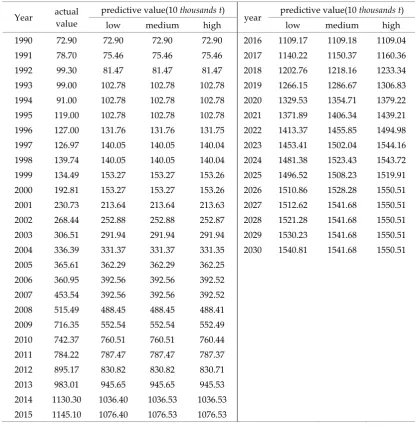
Table 4. China's copper consumption demand forecast based on ARIMA copper consumption intensity system dynamics model
year actual value predictive value(10 thousandst) year predictive value(10 thousandst)
low medium high low medium high
1990 72.90 72.90 72.90 72.90 2016 1157.39 1157.47 1157.42 1991 78.70 75.46 75.46 75.46 2017 1180.63 1190.81 1190.90 1992 99.30 81.47 81.47 81.47 2018 1201.48 1207.45 1203.42 1993 99.00 102.78 102.78 102.78 2019 1228.35 1251.49 1274.80 1994 91.00 102.78 102.78 102.78 2020 1295.21 1300.77 1326.74 1995 119.00 102.78 102.78 102.78 2021 1326.58 1370.77 1415.98 1996 127.00 131.75 131.76 131.76 2022 1326.58 1381.87 1440.87 1997 126.97 140.04 140.05 140.05 2023 1337.19 1406.15 1479.99 1998 139.74 140.04 140.05 140.05 2024 1354.14 1437.53 1527.26 1999 134.49 153.26 153.27 153.27 2025 1390.81 1490.55 1598.54 2000 192.81 153.26 153.27 153.27 2026 1409.97 1525.62 1651.73 2001 230.73 213.63 213.64 213.64 2027 1423.97 1550.08 1700.22 2002 268.44 252.87 252.88 252.88 2028 1422.66 1549.89 1700.19 2003 306.51 291.94 291.94 291.94 2029 1421.92 1548.33 1698.42 2004 336.39 331.35 331.37 331.37 2030 1418.45 1546.78 1696.94 2005 365.61 362.25 362.29 362.29
2006 360.95 392.52 392.56 392.56 2007 453.54 392.52 392.56 392.56 2008 515.49 488.41 488.45 488.45 2009 716.35 552.49 552.54 552.54 2010 742.37 760.44 760.51 760.51 2011 784.22 787.37 787.47 787.47 2012 895.17 830.71 830.82 830.82 2013 983.01 945.53 945.65 945.65 2014 1130.30 1036.40 1036.53 1036.53 2015 1145.10 1095.63 1095.76 1095.76
Comparing the simulated values of the past year with the actual values, it can be seen that the simulation results are slightly larger than the difference before and after 2008 (the maximum error occurs in 2009, about 22%). The forecast value is the same as the actual consumption value, the error is mostly about 5%. A large error occurred around 2008, probably due to the global financial crisis that led to the actual consumption of copper and the economy, the population growth rate between the temporary decoupling.
Figure 3. Prediction of China's copper consumption demand based on ARIMA model
2.3.2 Predictive Results Based on Inverted U– Shape Empirical Relation
The prediction results of the copper consumption demand with dynamics model based on the inverted U-type empirical relationship are shown in Figure 4 and Table 5. Whether it is high-speed
GDP, medium speed, or low growth, China's copper consumption demand in 2030 years ago will
reach the peak platform area, the peak value is 15.5 Mt.
Figure 4. China's copper consumption demand forecast based on inverted U-shaped empirical relationship
If China's GDP to high-speed growth situation forward, then China's copper consumption demand will continue to maintain rapid growth, consumer demand will reach the peak in advance. In the case of high growth, China's copper consumption demand peaked at 2026, significantly faster than the medium and low speed, reaching 15.50 Mt, into the peak platform area. In the case of medium speed, China's copper demand peaked at 2027, with a peak of 15.41 Mt. Low-speed situation, even more slowly, about 2030 to reach the peak.
Table 5. China's copper consumption demand forecast based on inverted U-shaped empirical relationship
Year actual value
predictive value(10 thousandst)
year predictive value(10 thousandst)
low medium high low medium high
1990 72.90 72.90 72.90 72.90 2016 1109.17 1109.18 1109.04 1991 78.70 75.46 75.46 75.46 2017 1140.22 1150.37 1160.36 1992 99.30 81.47 81.47 81.47 2018 1202.76 1218.16 1233.34 1993 99.00 102.78 102.78 102.78 2019 1266.15 1286.67 1306.83 1994 91.00 102.78 102.78 102.78 2020 1329.53 1354.71 1379.22 1995 119.00 102.78 102.78 102.78 2021 1371.89 1406.34 1439.21 1996 127.00 131.76 131.76 131.75 2022 1413.37 1455.85 1494.98 1997 126.97 140.05 140.05 140.04 2023 1453.41 1502.04 1544.16 1998 139.74 140.05 140.05 140.04 2024 1481.38 1523.43 1543.72 1999 134.49 153.27 153.27 153.26 2025 1496.52 1508.23 1519.91 2000 192.81 153.27 153.27 153.26 2026 1510.86 1528.28 1550.51 2001 230.73 213.64 213.64 213.63 2027 1512.62 1541.68 1550.51 2002 268.44 252.88 252.88 252.87 2028 1521.28 1541.68 1550.51 2003 306.51 291.94 291.94 291.94 2029 1530.23 1541.68 1550.51 2004 336.39 331.37 331.37 331.35 2030 1540.81 1541.68 1550.51
2005 365.61 362.29 362.29 362.25
2006 360.95 392.56 392.56 392.52
2007 453.54 392.56 392.56 392.52
2008 515.49 488.45 488.45 488.41
2009 716.35 552.54 552.54 552.49
2010 742.37 760.51 760.51 760.44
2011 784.22 787.47 787.47 787.37
2012 895.17 830.82 830.82 830.71
2013 983.01 945.65 945.65 945.53
2014 1130.30 1036.40 1036.53 1036.53
2015 1145.10 1076.40 1076.53 1076.53
3. Results and Analysis
In this paper, the method of predicting copper consumption dynamics model based on decomposition method is using to determine the trend of copper consumption intensity in China. But also the use of departmental consumption law, quantitative forecasting and qualitative judgments, the results shown in Table 6.
For the prediction of copper consumption intensity, one is basing on the ARIMA model of the forecasting, the second is basing on other industrialized countries inverted U-type consumption of the forecast. For the first use of ARIMA model value, in the case of low GDP growth, China's copper consumption demand in 2025 gradually reached its peak, and in 2027-2030 stable at 14.2 Mt of high platform, the same period, high growth continue to maintain a slight growth (Table 4, Figure 3). For the second copper consumption intensity with inverted U-shaped consumption experience, it shows that the gap between the three GDP growth increases first, then gradually narrows and tends to be consistent (Table 5, Figure 4).
The results show that in 2020, 2025 and 2030 were 13 Mt, 15 Mt and 15.5 Mt. From 2015 to 2030, China's copper consumption demand showed a gradual slowdown in the growth rate, and in 2030 years before entering the peak platform period. Copper demand growth of about 3 Mt from 2015 to
2020, and copper demand growth of about 2 Mtfrom 2020 to 2025, copper demand growth of about
0.5 Mtfrom 2025 to 2030.
Since the Chinese economy has entered a new norm in 2015, China's demand for commodities is changing. Raw materials are closely relate to construction and infrastructure, and steel, iron ore and coal mineral, known as "early cycle" commodities, are most susceptible. The copper metal, which closely follows China’s economic data, has been affected, with trading prices falling to its lowest level in less than five years (less than $ 6000/t). Macquarie is expected to grow in demand in China, the situation, the 2019 copper market supply surplus will reach 2 Mt. For miners, this will remove the need for new capacity. In other words, the copper boom of this round is bound to end, 2015-2020 years ago, China's copper demand compared to the previous rapid rise, will maintain a low growth momentum. The results of this study are confirm by this.
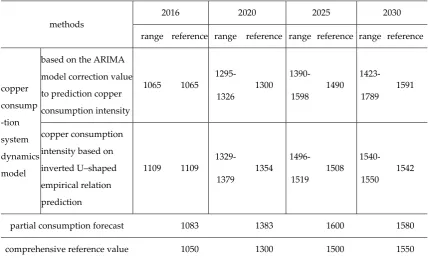
Table 6. Comparison of the results of a combination of multiple methods or methods for China's copper consumption demand forecast unit: 10 thousandst
methods
2016 2020 2025 2030
range reference range reference range reference range reference
copper consump -tion system dynamics model
based on the ARIMA model correction value to prediction copper consumption intensity 1065 1065 1295- 1326 1300 1390-1598 1490 1423- 1789 1591 copper consumption intensity based on inverted U–shaped empirical relation prediction 1109 1109 1329- 1379 1354 1496-1519 1508 1540- 1550 1542
partial consumption forecast 1083 1383 1600 1580 comprehensive reference value 1050 1300 1500 1550
It is expect that by 2020, China's power industry will decline in copper, but with China's economic structure optimization and adjustment, industrial upgrading is about complete, the central and western regions into the rapid development track. Daily consumer goods, information, electronic communications industry, transportation, machinery manufacturing and other areas of the total amount of copper will be a certain degree of growth, for make up even more than the power industry with the amount of copper reduction. It is judged that China's copper consumption demand may continue to maintain a relatively low growth rate, reaching about 15 Mt around 2025. 2027 is the peak year of China's copper consumption demand, which consumption demand peak value will be about 15.5 Mt, and 15.4 Mt in 2030.
4.Results and Conclusion
(1) Economic growth is still pulling the core elements of mineral resource consumption, the world economy continued to increase dependence on resource consumption has not fundamentally changed. Under the new norm, China's future economic growth drivers will not change fundamentally. The eastern part of the industrial upgrading and the rapid development of new urbanization in the Midwest, the Chinese economy is expect to maintain a steady growth in a long period time. Its demand for basic metal consumption growth trend is stable.
(2) China's copper consumption is also growing, if all can be recycled, will ease the domestic copper supply and demand contradiction play an important role. In accordance with the average life of copper products in developed countries 30 years, 70% of the recovery rate of scrap copper to calculate by 2020, the amount of waste copper can be recycled to reach 2.2 Mt, equivalent to all the copper products forecast demand about 20%.
(3) Urbanization rate to accelerate the growth of copper demand to further increase the space, the urbanization rate is likely to increase by 1 percentage point per year to 2020 will reach 60%.
(4) In 2016, China's apparent consumption of copper amounted to 11.51 Mt. In which, the electricity industry accounted for 42% of the national copper consumption, consumer goods accounted for 15%, electronic communications accounted for 15%, machine manufacture industry accounted for 10%, 8% of transportation, construction industry accounted for 3%, other industries accounted for 7%. Compared with the consumption structure of the developed countries in the world, China's copper consumption in the field of construction, transportation and other areas continued to grow. It is expect that domestic demand for copper may reach 13.0 Mt in 2020, may reach 15.0 Mt in 2025, and may reach 15.5 Mt in 2030.
Acknowledgments: This paper has received funding from the China Geological Survey Project: China's Energy and Mineral Resources Security Dynamic Evaluation and Decision Support System Construction (121201103000150112).
Author Contributions: All authors have made a significant contribution to this research. Xin Li and Qunyi Liu conceived and designed the experiments; Jianbo Yang collected data and information; Xin Li provided methods and processed data; Qunyi Liu analyzed the data; Jianbo Yang wrote the paper.
Conflicts of Interest: The authors declare no conflict of Internet.
References
1. Chengyan Wang, Zhong Wang. Recycling and Utilization of Copper. Central South University Press in China, 2010. (In Chinese)
2. Minxi Wang, Wu Chen, Xin Li. Substance flow analysis of copper in production stage in the U.S. from 1974 to 2012. Resources, Conservation and Recycling. 2015, 105(12): 36-48. Available online: http://www.sciencedirect.com/science/article/pii/S0921344915301117 (accessed on 29 October 2015). 3. Liang Da. The Endogenous Growth Motive of Economic Development in 2014. Macroeconomic
management. 2014, (1):23-25. (In Chinese)
4. Changning Xu. Analysis on the Relationship between Copper Consumption and GDP. China Metal Bulletin. 2008, (29):32-35. (In Chinese)
5. Qishen Chen, Gaoshang Wang, Anjian Wang. Analysis on Three Transition Points of "S" Rule of Copper Demand. Acta Geoscientica Sinica. 2010, 31(5): 659-665. (In Chinese)
6. Qunyi Liu, Anjian Wang, Qishen Chen. Analysis on Global Copper Demand Trend in 2040. China Mining Magazine. 2014, 23(8):15-18. (In Chinese)
7. Rongguo Cui, Juan Guo, Guifen Xu, et al., Global Copper Production and Consumption and Its Future Demand Forecast. Resource Science. 2015, 37(5): 944-950. (in Chinese)
8. Qunyi Liu, Anjian Wang, Yanfei Zhang, Qishen Chen. An Analysis of China's Copper Demand Trend and Consumption Structure. China Mining Magazine. 2014, 23(9): 5-8. (in Chinese)
9. Donald A. Singer .Future copper resources. Ore Geology Reviews. 2017, 86(7): 271–279.
11. China's Total Copper Consumption May Enter Stagnation Stage. China's Total Copper Consumption May Enter Stagnation Stage. China Nonferrous Metals Monthly. 2016,(4):33-39. (In Chinese)
12. Mongelluzzo, Bill. Copper's Tarnished Growth. Journal of Commerce. 2015, 16(11) :70-75.
13. Feng Zhang, Hongyun Ma, Jinghua Sha. Forecast of China's Copper Resources Demand Based on Scenario Analysis in 2020. Resource Industry. 2012, 14(4): 30-35. (In Chinese)
14. Di Wang, Rui Nie, Yanzhi Zhang. Forecast of Energy Demand in Jiangsu from the Perspective of Sustainable Development. Reform and Strategy. 2009, (8): 61-64. (In Chinese)
15. Dongling Chen, Kenneth W Clements, E John Roberts, E Juerg Weber. Forecasting steel demand in China. Resources Policy. 1991, 17(3): 196-210. Doi: 10.1016/0301-4207(91)90003-E.
16. Anjian Wang, Gaoshang Wang, Qishen Chen, Wenjia Yu. Mineral Resource Demand Theory and Model Forecast. Acta Geoscientica Sinica. 2010, 31(2): 137-147. (In Chinese)
17. Fernando Sánchez Lasheras, Francisco Javier de Cos Juez, Ana Suárez Sánchez, Alicja Krzemień, Pedro Riesgo Fernández. Forecasting the COMEX copper spot price by means of neural networks and ARIMA models. Resources Policy. 2015, 45 (3): 37-43. Doi: 10.1016/j.resourpol.2015.03.004.