rsos.royalsocietypublishing.org
Research
Cite this article:Cook N, Boulton RA, Green J, Trivedi U, Tauber E, Pannebakker BA, Ritchie MG, Shuker DM. 2018 Differential gene expression is not required for facultative sex allocation: a transcriptome analysis of brain tissue in the parasitoid waspNasonia vitripennis.R. Soc. open sci.5: 171718. http://dx.doi.org/10.1098/rsos.171718
Received: 24 October 2017 Accepted: 15 January 2018
Subject Category: Biology (whole organism)
Subject Areas:
evolution/behaviour/molecular biology
Keywords:
sex allocation, behavioural genetics, transcriptomics, parasitoid, local mate competition,Nasonia
Author for correspondence: Nicola Cook
e-mail:[email protected]
Electronic supplementary material is available online at https://dx.doi.org/10.6084/m9. figshare.c.3989118.
Differential gene expression
is not required for
facultative sex allocation: a
transcriptome analysis of
brain tissue in the parasitoid
wasp
Nasonia vitripennis
Nicola Cook
1
, Rebecca A. Boulton
1,2
, Jade Green
1
,
Urmi Trivedi
3
, Eran Tauber
4
, Bart A. Pannebakker
5
,
Michael G. Ritchie
1
and David M. Shuker
1
1School of Biology, University of St Andrews, Greenside Place, St Andrews KY16 9TH, UK
2Department of Entomology, University of Minnesota, St Paul, MN 55108, USA
3Edinburgh Genomics, University of Edinburgh, Ashworth Laboratories,
The King’s Buildings, Edinburgh EH9 3FL, UK
4Faculty of Natural Sciences, University of Haifa, 199 Aba Khoushy Avenue,
Mount Carmel, Haifa 3498838, Israel
5Laboratory of Genetics, Wageningen University and Research, Droevendaalsesteeg 1,
6708PB Wageningen, The Netherlands
NC,0000-0003-4462-0116; ET,0000-0003-4018-6535
Whole-transcriptome technologies have been widely used in behavioural genetics to identify genes associated with the performance of a behaviour and provide clues to its mechanistic basis. Here, we consider the genetic basis of sex allocation behaviour in the parasitoid waspNasonia vitripennis. FemaleNasoniafacultatively vary their offspring sex ratio in line with Hamilton’s theory of local mate competition (LMC). A single female or ‘foundress’ laying eggs on a patch will lay just enough sons to fertilize her daughters. As the number of ‘foundresses’ laying eggs on a patch increases (and LMC declines), females produce increasingly male-biased sex ratios. Phenotypic studies have revealed the cues females use to estimate the level of LMC their sons will experience, but our understanding of the genetics underlying sex allocation is limited. Here, we exposed females to three foundress number conditions, i.e. three LMC conditions, and allowed them to oviposit. mRNA was extracted from only the heads of these females to target the brain tissue. The subsequent RNA-seq experiment confirmed that differential gene expression is not
2
rsos
.ro
yalsociet
ypublishing
.or
g
R.
Soc
.open
sc
i.
5
:1
71
71
8
...
associated with the response to sex allocation cues and that we must instead turn to the underlying neuroscience to reveal the underpinnings of this impressive behavioural plasticity.
1. Introduction
The genomics revolution has brought several new technologies to behaviour genetics. For instance, the top-down assessment of genetic variation underlying quantitative traits can now be extended through genome-wide association studies using large-scale single nucleotide polymorphism datasets [1,2]. In terms of bottom-up approaches, gene knockdown and gene editing techniques, such as RNAi [3–5] and CRISPR-cas9 [6,7], respectively, have also promised to help unpick molecular mechanisms underpinning behaviour on a gene by gene, or nucleotide by nucleotide basis. However, it has been the development of accessible whole-transcriptome technologies (from microarrays to RNA-seq) that have perhaps been the most widely used, not least because they help fill the gap between top-down and bottom-up approaches to behaviour genetics [8], and because they can be applied in non-model species [9].
Transcriptome studies can approach the genetic basis of behaviour in two ways. First, surveys of expressed genes can identify what genes and gene networks are associated with the performance of a behaviour. Recent examples in non-model insects include parental care in the burying beetleNicrophorus vespilloides[10] and oviposition behaviour in the parasitoid waspNasonia vitripennis(Walker, 1836) [11]. However, a great many genes may be expressed during the action of a behaviour (especially over the time scale usually assayed, i.e. at least minutes, if not hours) many of which will have little or no direct relationship to facilitating the performance of that behaviour. The most obvious example would be genes that are upregulated or downregulated as a consequence of a particular behaviour, rather than genes that are causal [12]. While the former is undoubtedly useful for expanding our understanding of the genetic, and perhaps physiological, context of behaviour, it is less helpful in identifying the genes that bring a behaviour into being.
Second, transcriptomic studies of behaviour often involve identifying the changes in gene expression that occur when a behaviour commences or when a behaviour shifts. For example, the transition between virgin and ‘mated’ reproductive status in honeybee queens is associated with significant changes in the expression of chemo-reception, metabolomic, vision and immune-related genes [13]. However, the time scale of analysis again makes it difficult to separate behavioural cause and consequence of the mating process, i.e. which expression changes are attributable to the performance of, for example, the mating flight and/or copulation and which are a consequence of those behaviours having occurred. Nevertheless, experimental manipulation of behaviour has helped identify genes and gene networks that appear to have a causal relationship with the performance of a behaviour, i.e. ‘behaviour genes’ [14]. Here, we consider the genetic basis of sex allocation in the parasitoid wasp Nasonia vitripennis. FemaleNasoniafacultatively vary their offspring sex ratios in line with Hamilton’s theory of local mate competition (LMC) [15]. Females parasitize locally discrete patches of blowfly pupae, with emerging offspring mating before females disperse to found the next generation [16]. If only one female lays eggs on a patch, then on emergence, related males (i.e. brothers) compete for mates among their sisters. Hamilton showed that this favours mothers producing female-biased sex ratios that reduced competition among brothers and increased the number of sisters available for them to mate with [15,17]. Indeed, a single female laying eggs on a host—termed a ‘foundress’ in the parasitoid literature—should produce the minimum number of sons needed to fertilize her daughters. However, if multiple foundresses lay eggs together, the degree of competition among related males is reduced (in Hamilton’s parlance, the degree of local mate competition is reduced), and so less female-biased sex ratios are favoured. One way to conceptualize this reduction of LMC as more females lay eggs together is that as the number of foundress females increases, the fitness returns of sons and daughters becomes more equal, and a mother is as successful at producing grand-offspring through sons as through daughters.
3
rsos
.ro
yalsociet
ypublishing
.or
g
R.
Soc
.open
sc
i.
5
:1
71
71
8
...
variation [28]. To move beyond these quantitative genetic approaches, Pannebakkeret al.[11] used a whole-transcriptome approach to explore changes in gene expression associated with oviposition (a necessary part of sex allocation, as eggs are fertilized or not immediately prior to oviposition: as a haplodiploid insect, fertilized diploid eggs develop into females, and unfertilized haploid eggs develop into males [29]). They showed that 332 genes displayed different expression patterns when females were ovipositing when compared with resting controls, with the majority of the changes associated with the downregulation of genes associated with metabolism.
Most recently, Cooket al. [30] extended this study to compare patterns of gene expression associated with facultative sex allocation, with transcriptomes screened in females that were either alone or in groups of 10 (‘social’ LMC cues [31]), and that were either given no hosts, unparasitized hosts, or already parasitized hosts (‘host’ LMC cues), in a fully factorial 3×2 design. From the phenotypic studies, we knew that females should produce different sex ratios when ovipositing in the presence of other co-foundresses and/or when ovipositing on hosts that had already been parasitized (the so-called superparasitism [32]). However, there was no evidence of changes in gene expression associated with co-foundresses or superparasitism. Instead, there was a strong pattern of differential gene expression (DGE) associated with the presence or the absence of hosts (i.e. whether females were ovipositing or not), with 1359 genes showing significant DGE. This study therefore confirmed that oviposition leads to changes in gene expression in femaleNasonia, but strongly suggested that facultative sex allocation does not.
Both Cooket al.[30] and Pannebakkeret al.[11] harvested mRNA from whole bodies. While this is still common for behavioural transcriptome studies, especially in non-model insects, whole-body approaches have been criticized; selecting only the tissues most relevant to the behaviour will increase the relevance of the gene expression data [12]. To begin to address this, here we performed an RNA-seq experiment using mRNA harvested from the heads of female N. vitripennis, to target the brain tissue of the wasps. While the neural basis of oviposition and sex allocation behaviour is unknown (but see below), it is likely that regions of the brain such as the mushroom bodies are sites of information processing that should be relevant for such behavioural decisions [33]. We allowed females to lay eggs in one of three foundress conditions (alone, with four co-foundresses or with nine co-foundresses) and tested whether the facultative sex allocation in response to foundress number is associated with DGE across theN. vitripennistranscriptome.
2. Material and methods
2.1. Study species
Nasonia vitripennis (Hymenoptera, Chalcidoidea) is a generalist parasitoid of large dipteran pupae including species of Calliphoridae. Females oviposit between 20 and 50 eggs in an individual host, with male offspring emerging just before females (after approx. 14 days at 25°C [16]). Males are brachypterous and unable to fly, remaining close to the emergence site where they compete with each other for emerging females, including their sisters. Females disperse after mating to locate new hosts. The focal females used in this experiment were from the AsymC strain, originally isolated in 1986 by curing the wild-type strain LabII ofWolbachiaand is known to be free of sex-ratio distorters [34,35]. Wasps have been maintained on
Calliphora vomitoriaorC. vicinahosts at 25°C, 16 L : 8 D light conditions ever since. Where co-foundresses were required, these were taken from the red-eye mutant STDR strain, allowing us to track the offspring of a single AsymC female using eye colour. The STDR strain is maintained under conditions identical to the AsymC strain.
2.2. Experimental design
To control for possible host and other maternal effects, experimental females were not drawn straight from stock populations. Instead, 2-day-old, mated, wild-type AsymC females were isolated from the mass cultures into individual glass vials. Each female was provided with three hosts and allowed to oviposit. Experimental females were drawn from the resulting F1 generation, one female per
‘grandmother’. We balanced the emergence of the F1 generation over three days, and therefore the
experimental set-up, so that we needed to process fewer replicates simultaneously. This reduced the time-difference between the harvesting of females for RNA extraction (see below).
4
rsos
.ro
yalsociet
ypublishing
.or
g
R.
Soc
.open
sc
i.
5
:1
71
71
8
...
host-feeding and facilitates egg development. We then employed a simple three-treatment experimental design, withN=135 replicates per treatment (totalN=405 experimental females), balanced over 3 days. Females were allocated to one of three ‘foundress number’ groups: (i) single foundress, (ii) five foundress (i.e. one experimental female plus four STDR co-foundresses ovipositing simultaneously) or (iii) 10 foundress (i.e. one experimental female plus nine STDR co-foundresses ovipositing simultaneously). Females were given access to three hosts and allowed to explore the hosts and oviposit for 3 h. At the end of the 3 h period, focal females were identified by eye colour and their heads excised and placed into RNAlater (ThermoFisher Scientific, Waltham, MA, USA) for storage at−20°C in advance of RNA extraction. Hosts were returned to the incubator and the emergent offspring counted and sexed to verify that the expected sex allocation response was noted in this experiment (electronic supplementary material, figure S1; females produced increasingly male-biased sex ratios with an increase in foundress number). Only the heads of females that produced offspring were used for RNA extraction. Heads were pooled into groups of 12 within treatment group (n=8 pools per treatment,N=24 overall) and stored at−20°C in advance of RNA extraction.
2.3. RNA extraction
RNA was isolated from 12 pooled heads using the TRIzol Plus RNA Purification Kit in conjunction with the PureLink RNA Mini Kit (Life Technologies, Paisley, UK) according to the manufacturer’s instructions. Additional steps for ‘On-Column PureLink DNase Treatment During RNA Purification’ were followed. Concentration and integrity of RNA samples were checked using a Nanodrop spectrophotometer (Nanodrop Technologies, Wilmington, DE) and a bioanalyser system (Agilent Technologies, Santa Clara, CA), respectively. Total RNA obtained was (mean total RNA available for library preparation=0.855 µg, s.d.=0.297 µg) of good quality (260/280≥1.8, RIN values≥8.0 for all samples).
2.4. Library preparation and sequencing
Library preparation and sequencing were carried out by Edinburgh Genomics. As in our previous work [30], mRNA library preparation for paired-end sequencing was carried out using the Illumina TruSeq RNA Sample Prep Kit (Illumina, San Diego, CA) following the Illumina TruSeq Sample Preparation v2 (Low Sample) protocol. Briefly, mRNA was purified from total RNA samples using oligo-dT-attached magnetic beads and fragmented using divalent cations at 94°C. First-strand cDNA synthesis was carried out using reverse transcriptase and random hexamer primers. Second-strand synthesis was carried out using RNA polymerase I and RNase H. Overhangs resulting from fragmentation were converted to blunt ends and 3 ends were subsequently adenylated. Sanger indexing adapters were ligated to the fragments that were then purified and PCR-amplified to create the final cDNA libraries for sequencing. Library preparation was successful for all but one sample; a single replicate from the five-foundress treatment group. A total of 23 libraries were sequenced on the HiSeq2000 (125 bp paired-end) according to the manufacturer’s instructions. Raw sequence reads are available from the Gene Expression Omnibus database at NCBI (Accession: GSE105796).
2.5. Mapping, filtering and annotation
Raw reads were filtered for quality (reads with an average Phred quality score of 30 or higher over the length of the read were retained) and adapter contamination using cutadapt (v1.8.3). Filtered, adapter-trimmed reads were subsequently aligned to the N. vitripennis genome (Assembly Nvit 2.1: NCBI Accession: GCF_000002325.3) using tophat2 (v. 2.0.14). Read counts per gene were obtained using HTSeq (v. 6.0.1) ‘union’ mode with ‘NCBINasonia vitripennisAnnotation Release 101’.
In terms of the dataset, we obtained 2 332 938 466 trimmed reads across all 23 sequenced libraries with 95.14% of reads mapped to Nvit 2.1 overall (see the electronic supplementary material, table S1, for individual library mapping statistics). Owing to the ‘union’ mode applied to HTSeq, some of the reads that mapped ambiguously to a gene were removed (i.e. not counted) and the final dataset comprised 886 364 361 reads mapped to 14 131 genes. For 13 599 of these genes, at least one read was mapped.
2.6. Statistical analyses
5
rsos
.ro
yalsociet
ypublishing
.or
g
R.
Soc
.open
sc
i.
5
:1
71
71
[image:5.522.129.393.41.258.2]8
...
20
10
0
–10
–20
–20 –10 0
PC1: 33% variance
PC2: 19% v
ariance
10
foundress number
one five ten
20 30
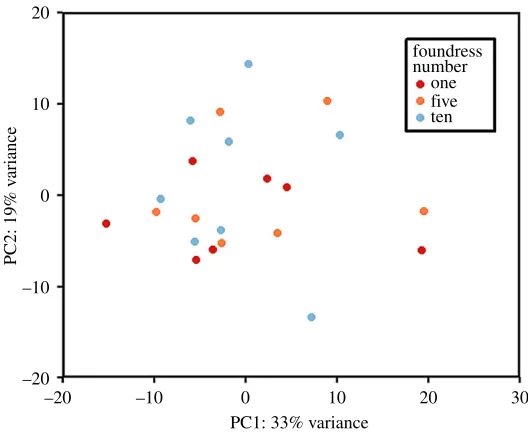
Figure 1.Principal component plot based on count data from the 500 genes displaying the greatest variance across all samples.
applied to the count data and a principal component plot generated based on the count data from the 500 genes displaying the highest variance across all samples. One replicate from the single-foundress treatment group was found to be a clear outlier and was removed from subsequent analyses (electronic supplementary material, figure S2). This sample was subjected to identical experimental procedures as its corresponding replicates and the resulting RNA of similar high quality prior to library preparation and sequencing. Notably, this sample had the lowest percentage of trimmed reads mapped to the reference genome (electronic supplementary material, table S1) suggestive of an anomaly at the sequencing stage. The removal of this outlier had no effect on the results in terms of the number of significantly differentially expressed genes (DEG).
After the removal of outliers, DESeq2 was employed to test for differential expression between pairs of treatment groups by fitting a generalized linear model (GLM) for each gene and subsequently to determine whether each model coefficient differs significantly from zero. The Wald test was used for significance testing and the resulting false discovery rate (FDR) p-values were adjusted for multiple comparisons using the Benjamini and Hochberg method [38]. Adjustedp-values less than 0.05 would be considered indicative of DEG. Subsequently, we analysed the results comparing gene expression across the three treatments fitting the factor ‘foundress number’ in a GLM framework using the negative binomial error distribution and a likelihood ratio test for significance.
3. Results
Facultative sex allocation behaviour in response to co-foundresses is not associated with any short-term gene expression changes in the head, as a proxy for the brain, of female N. vitripennis. This result was consistent for all pairwise comparisons between the three treatment groups across 13 599 genes: single- versus five-foundress (FDRp-values allp>0.99), five versus 10-foundress (FDRp-values allp>0.99) and single- versus 10-foundress (FDRp-values allp>0.1 bar a single gene (cytochrome P450 314A1, NCBI Gene ID: 100115247) for which p=0.074). An additional test for an overall effect of ‘foundress number’ on gene expression using a GLM approach confirmed this (FDR p-values allp>0.1).
6
rsos
.ro
yalsociet
ypublishing
.or
g
R.
Soc
.open
sc
i.
5
:1
71
71
8
...
4. Discussion
The results presented here are in agreement with our previous findings [30] which showed that oviposition, i.e. the presence or the absence of a host, led to significant changes in gene expression at the level of the whole body inN. vitripennis, but that known sex allocation cues (the presence of co-foundresses or previously parasitized hosts) did not. Taken together, our results strongly suggest that the remarkable phenotypic plasticity that underlies facultative sex allocation inNasoniadoes not involve systematic changes in gene expression.
That said, negative results bring their own evidential burden. While we are pleased to demonstrate that techniques used in our laboratory to assay differential gene expressions produce consistent results (especially given the recent concerns in the scientific community over reproducibility [39]), and while we also believe that we have a strong experimental design, we appreciate the risk of Type II and Type I errors. With any experiment, there is always a trade-off between cost and accuracy when selecting the number of biological replicates, and replication in RNA-seq studies has been a topic of discussion in the recent literature ([40–43] to name a few). In their comprehensive evaluation of 11 tools for RNA-seq data analysis, Shurchet al.[40] determined that at least six biological replicates should be used per treatment group and that with around this number of replicates Edge R [44] and DESeq2 [36] outperform other tools. Both of these tools are considered to have a superior true-positive identification rate and well-controlled FDR for genes exhibiting lower fold changes between treatment groups. The authors stated, however, that forn≤12 biological replicates DESeq2 should be ‘the tool of choice’ and was therefore the most suitable for use in the current study.
To further illustrate the reliability of our results, we selected two replicates from each treatment group that showed ‘high divergence from others in their group’ in the principal component analysis plot (electronic supplementary material, figure S3) from the other two groups and ran an identical DESeq2 analysis to that presented here. This analysis, using only two biological replicates per treatment group, turned up 900 DEG when comparing single- versus foundress treatments, 49 DEG for five-versus 10-foundress treatments and 1397 DEG for single- five-versus 10-foundress treatments. Under a GLM framework, 1368 genes were differentially expressed in association with ‘foundress number’. This, firstly, highlights the importance of biological replication in RNA-seq studies as discussed by Shurchet al.[40] and, secondly, increases our confidence in the results presented here (i.e. by choosing the most divergent samples we can ‘find’ significant differential gene expression among our treatments, but such differences do not appear when using all the replicates). See Libbrechtet al.[45] for an analogous case with DNA methylation in social insects.
Behavioural transcriptomic studies on samples containing multiple tissue and/or cell types such as that reported here and previously (examples include [10,11,30,46]) have received criticism [47]. It has been suggested that non-isometric-scaling relationships, i.e. differences in size, within groups of samples and heterogeneity in scaling relationships across groups of samples may influence differential expression. This may result in false-positive or false-negative results that are attributable to non-isometric scaling at multiple biological levels rather than the trait in question [47]. However, this particular criticism is not applicable to our work, as the samples are comparable in size (either as whole bodies or as heads) and physiological state, i.e. there is no reason for any one treatment group to develop differently. As such, any issues with scaling should be negligible.
Another common criticism of whole-body transcriptomic studies is that the ‘signal’ of differential expression between treatment groups from some genes may be obscured simply because the regulation occurs in a single tissue or group of cells and the difference in expression is relatively low [9]. To try and evaluate this problem, in our previous work that only looked at whole bodies [30], we compared our list of 1359 genes that were differentially expressed during oviposition to a list of 79 genes and their associated peptides known to be both expressed and present in the venom gland and/or the ovary of
N. vitripennis[48,49]. It is very likely that expression of these genes is highly concentrated in these female organs given that they function to envenomate the pupal host via the ovipositor prior to egg-laying. In spite of this, our original whole-body study picked up that 33 of these genes were differentially expressed in response to oviposition. Therefore, for two organs where DEG would seem extremely likely to be detected in response to oviposition, the signal was present even when sampling the whole insect.
7
rsos
.ro
yalsociet
ypublishing
.or
g
R.
Soc
.open
sc
i.
5
:1
71
71
8
...reason that if we can detect DEG in association with oviposition at this time point, then we should also be able to detect any DEG associated with sex allocation; females allocate the sex of their offspring by releasing or withholding sperm to fertilize eggs or not as they are laid in order to allocate sex [16]. Thus, it seems that if DGE was involved in the process of sex allocation as distinct from oviposition, we would have been able to detect it using the methods described here.
Here, we have validated a negative result. We hypothesized that DGE in the neural circuitry, more specifically the brain, may be associated with the response to sex allocation cues but that it may not have been detected due to the whole-body approach. The results of the current study confirm that the response to sex allocation cues in femaleN.vitripennisis not facilitated by differential expression in the brain and so does not require or involve any significant alteration to gene regulation, while the process of oviposition itself does [30]. These findings, combined with our recent work on the effects of neonicotinoid pesticides—which disrupt synaptic nicotinic acetylcholine receptors—on sex allocation [50–52], mean that to understand the mechanistic basis of adaptive facultative sex allocation under LMC, we must instead now turn to the underlying neuroscience.
Ethics. There was no requirement to seek ethical approval to carry out the work described above. However, the use of insects in the above experiments was kept to a minimum.
Data accessibility. Raw sequence reads and processed data are available from the Gene Expression Omnibus hosted by NCBI (Accession: GSE105796).
Authors’ contributions. N.C., E.T., B.A.P., M.G.R. and D.M.S. conceived of the study. N.C., R.A.B. and J.G. carried out the behavioural experiments and harvested the insects for RNA extraction. N.C. carried out the molecular work. U.T. processed the sequence reads, mapping and annotation. N.C. and U.T. carried out differential expression analyses. N.C. and D.M.S. drafted the manuscript. All authors gave final approval for publication.
Competing interests. We have no competing interests to declare.
Funding. This work was supported by Natural Environment Research Council (NERC) grant NE/J024481/1. D.M.S. was previously funded by a NERC Advanced Research Fellowship. B.A.P. was funded by the Netherlands Genomics Initiative (NGI Zenith no. 935.11.04). U.T. and Edinburgh Genomics are partly supported through core grants from NERC (R8/ H10/56), MRC (MR/K001744/1) and BBSRC (BB/J004243/1). R.A.B. was funded by a NERC Doctoral Training Grant.
Acknowledgements. We are extremely grateful to Jack Werren for his support and advice during our long-term analysis
of the genetics and genomics of sex allocation inNasonia.
References
1. Mackay TFCet al.2012 TheDrosophila melanogaster
genetic reference panel.Nature482, 173–178. (doi:10.1038/nature10811)
2. Visscher PM, Brown MA, McCarthy MI, Yang, J. 2012 Five years of GWAS discovery.Am. J. Hum. Genet.90, 7–24. (doi:10.1016/j.ajhg.2011. 11.029)
3. Meister G, Tuschl T. 2004 Mechanisms of gene silencing by double-stranded RNA.Nature431, 343–349. (doi:10.1038/nature02873) 4. Hannon GJ. 2002 RNA interference.Nature418,
244–251. (doi:10.1038/418244a)
5. Fire A, Xu S, Montgomery MK, Kostas SA, Driver SE, Mello CC. 1998 Potent and specific genetic interference by double-stranded RNA in
Caenorhabditis elegans.Nature391, 806–811. (doi:10.1038/35888)
6. Barrangou R. 2014 Cas9 targeting and the CRISPR revolution.Science344, 707–708. (doi:10.1126/ science.1252964)
7. Jinek M, Chylinski K, Fonfara I, Hauer M, Doudna JA, Charpentier E. 2012 A programmable dual-RNA-Guided DNA endonuclease in adaptive bacterial immunity.Science337, 816–822. (doi:10.1126/ science.1225829)
8. Boake CRB, Arnold SJ, Breden F, Meffert LM, Ritchie MG, Taylor BJ, Wolf JB, Moore AJ. 2002 Genetic tools for studying adaptation and the evolution of behavior.Am. Nat.160, S143–S159. (doi:10.1086/ 342902)
9. Hitzemann R, Bottomly D, Darakjian P, Walter N, Lancu O, Searles R, Wilmot B, McWeeney S. 2013 Genes, behaviour and next-generation RNA sequencing.Genes Brain Behav.12, 1–12. (doi:10.1111/gbb.12007)
10. Parker DJ, Cunningham CB, Walling CA, Stamper CE, Head ML, Roy-Zokan EM, McKinney EC, Ritchie MG, Moore AJ. 2015 Transcriptomes of parents identify parenting strategies and sexual conflict in a subsocial beetle.Nat. Commun.6, 8449–8459. (doi:10.1038/ncomms9449)
11. Pannebakker BA, Trivedi U, Blaxter MA, Watt R, Shuker DM. 2013 The transcriptomic basis of oviposition behaviour in the parasitoid wasp
Nasonia vitripennis.PLoS ONE8, e68608. (doi:10.1371/journal.pone.0068608) 12. Neville M, Goodwin SF. 2012 Genome-wide
approaches to understanding behaviour in
Drosophila melanogaster.Brief. Funct. Genomics11, 395–404. (doi:10.1093/bfgp/els031)
13. Manfredini F, Brown MJF, Vergoz V, Oldroyd BP. 2015 RNA-sequencing elucidates the regulation of behavioural transitions associated with the mating process in honey bee queens.BMC Genomics16, 563–575. (doi:10.1186/s12864-015-1750-7) 14. Zayed A, Robinson GE. 2012 Understanding the
relationship between brain gene expression and social behavior: lessons from the honey bee.Ann. Rev. Genet.46, 591–615. ( doi:10.1146/annurev-genet-110711-155517)
15. Hamilton WD. 1967 Extraordinary sex ratios.Science 156, 477–488. (doi:10.1126/science.156.3774.477) 16. Whiting AR. 1967 The biology of the parasitic wasp
Mormoniella vitripennis(Walker).Q. Rev. Biol.42, 333–406. (doi:10.1086/405402)
17. Taylor PD, Bulmer MG. 1980 Local mate competition and the sex ratio.J. Theor. Biol.86, 409–419. (doi:10.1016/0022-5193(80)90342-2)
18. Werren JH. 1980 Sex ratio adaptations to local mate competition in a parasitic wasp.Science208, 1157–1159. (doi:10.1126/science.208.4448.1157) 19. Werren JH. 1983 Sex ratio evolution under local
mate competition in a parasitic wasp.Evolution37, 116–124. (doi:10.2307/2408180)
20. Werren JH. 1984 Brood size and sex ratio regulation in the parasitic waspNasonia vitripennis(Walker) (Hymenoptera: Pteromalidae).Neth. J. Zool.34, 123–143. (doi:10.1163/002829684X00100) 21. Shuker DM, Reece SE, Lee A, Graham A, Duncan AB,
West SA. 2007 Information use in space and time: sex allocation behaviour in the parasitoid wasp
Nasonia vitripennis.Anim. Behav.73, 971–977. (doi:10.1016/j.anbehav.2006.07.013) 22. Shuker DM, Pen I, West SA. 2006 Sex ratios under
asymmetrical local mate competition in the parasitoid waspNasonia vitripennis.Behav. Ecol.17, 345–352. (doi:10.1093/beheco/arj034) 23. Shuker DM, Sykes EM, Browning LE, Beukeboom
8
rsos
.ro
yalsociet
ypublishing
.or
g
R.
Soc
.open
sc
i.
5
:1
71
71
8
...Ecol. Sociobiol.59, 829–835. ( doi:10.1007/s00265-005-0129-1)
24. Flanagan KE, West SA, Godfray HCJ. 1998 Local mate competition, variable fecundity and information use in a parasitoid.Anim. Behav.56, 191–198. (doi:10.1006/anbe.1998.0768)
25. King BH, Crowe ML, Skinner SW. 1995 Effect of host density on offspring sex ratios and behavioural interactions between females in the parasitoid waspNasonia vitripennis(Hymenoptera: Pteromalidae).J. Insect Behav.8, 89–102. (doi:10.1007/BF01990971)
26. Orzack SH, Parker ED. 1990 Genetic variation for sex ratio traits within a natural population of a parasitic wasp,Nasonia vitripennis.Genetics124, 373–384. 27. Pannebakker BA, Halligan DL, Reynolds KT,
Ballantyne GA, Shuker DM, Barton NH, West SA. 2008 Effects of spontaneous mutation accumulation on sex ratio traits in a parasitoid wasp.Evolution 62, 1921–1935. (doi:10.1111/j.1558-5646.2008. 00434.x)
28. Pannebakker BA, Watt R, Knott SA, West SA, Shuker DM. 2011 The quantitative genetic basis of sex ratio variation inNasonia vitripennis: a QTL study.J. Evol. Biol.24, 12–22. (doi:10.1111/j.1420-9101.2010. 02129.x)
29. Cook JM. 1993 Sex determination in the Hymenoptera: a review of models and evidence.
Heredity71, 421–435. (doi:10.1038/hdy.1993.157) 30. Cook N, Trivedi U, Pannebakker BA, Blaxter M,
Ritchie MG, Tauber E, Sneddon T, Shuker DM. 2015 Oviposition but not sex allocation is associated with transcriptomic changes in females of the parasitoid waspNasonia vitripennis.G3 (Bethesda)5, 2885–2892. (doi:10.1534/g3.115.021220) 31. Shuker DM, West SA. 2004 Information constraints
and the precision of adaptation: sex ratio manipulation in wasps.Proc. Natl Acad. Sci. USA101, 10 363–10 367. (doi:10.1073/pnas.0308034101) 32. Godfray HCJ. 1994Parasitoids: behavioral and evolutionary ecology, monographs in behavior and ecology. Princeton, NJ: Princeton University Press.
33. Zars T. 2000 Behavioral functions of the insect mushroom bodies.Curr. Opin. Neurobiol.10, 790–795. (doi:10.1016/S0959-4388(00)00147-1) 34. Gherna RL, Werren JH, Weisburg W, Cote R, Woese
CR, Mandelco L, Brenner DJ. 1991Arsenophonus nasoniaegen. nov., sp. nov., the causative agent of the son-killer trait in the parasitic waspNasonia vitripennis.Int. J. Syst. Bacteriol.41, 563–565. (doi:10.1099/00207713-41-4-563) 35. Werren JH. 1991 The paternal-sex-ratio
chromosome ofNasonia.Am. Nat.137, 392–402. (doi:10.2307/2678832)
36. Love MI, Huber W, Anders S. 2014 Moderated estimation of fold change and dispersion for RNA-seq data with DESeq2.Genome Biol.15, 550. (doi:10.1186/s13059-014-0550-8)
37. R Core Team. 2016R: a language and environment for statistical computing. Vienna, Austria: R Foundation for Statistical Computing. See https://www.R-project.org/.
38. Benjamini Y, Hochberg Y. 1995 Controlling the false discovery rate: a practical and powerful approach to multiple testing.J. R. Stat. Soc. B57, 289–300. (doi:10.2307/2346101)
39. Baker M. 2016 Is there a reproducibility crisis?
Nature533, 452–454. (doi:10.1038/533452a) 40. Schurch NJet al.2016 How many biological
replicates are needed in an RNA-seq experiment and which differential expression tool should you use?RNA22, 839–851. (doi:10.1261/rna.053959.115) 41. Liu Y, Zhou J, White KP. 2014 RNA-seq differential
expression studies: more sequence or more replication?Bioinformatics30, 301–304. (doi:10.1093/bioinformatics/btt688) 42. Rapaport F, Khanin R, Liang Y, Pirun M, Krek A,
Zumbo P, Mason CE, Socci ND, Betel D. 2013 Comprehensive evaluation of differential gene expression analysis methods for RNA-seq data.
Genome Biol.14, R95. ( doi:10.1186/gb-2013-14-9-r95)
43. Auer PL, Doerge RW. 2010 Statistical design and analysis of RNA sequencing data.Genetics185, 405–416. (doi:10.1534/genetics.110.114983)
44. Robinson MD, McCarthy DJ, Smyth GK. 2010 edgeR: a Bioconductor package for differential expression analysis of digital gene expression data.
Bioinformatics26, 139–140. (doi:10.1093/bioinfor matics/btp616)
45. Libbrecht R, Oxley PR, Keller L, Kronauer DJC. 2016 Robust DNA methylation in the clonal raider ant brain.Curr. Biol.26, 391–395. (doi:10.1016/j.cub. 2015.12.040)
46. Immonen E, Snook R, Ritchie MG. 2014 Mating system variation drives rapid evolution of the female transcriptome inDrosophila pseudoobscura.
Ecol. Evol.4, 2186–2201. (doi:10.1002/ece3.1098) 47. Montgomery SH, Mank JE. 2016 Inferring regulatory
change from gene expression: the confounding effects of tissue scaling.Mol. Ecol.25, 5114–5128. (doi:10.1111/mec.13824)
48. Sim AD, Wheeler D. 2016 The venom gland transcriptome of the parasitoid waspNasonia vitripennishighlights the importance of novel genes in venom function.BMC Genomics17, 571. (doi:10.1186/s12864-016-2924-7)
49. de Graaf DC, Aerts M, Brunain M, Desjardins CA, Jacobs FJ, Werren JH, Devreese B. 2010 Insights into the venom composition of the ectoparasitoid wasp
Nasonia vitripennisfrom bioinformatic and proteomic studies.Insect Mol. Biol.19, S11–S16. (doi:10.1111/j.1365-2583.2009.00914.x) 50. Whitehorn PR, Cook N, Blackburn CV, Gill SM, Green
J, Shuker DM. 2015 Sex allocation theory reveals a hidden cost of neonicotinoid exposure in a parasitoid wasp.Proc. R. Soc. B282, 20150389. (doi:10.1098/rspb.2015.0389)
51. Cook N, Green J, Shuker DM, Whitehorn PR. 2016 Exposure to the neonicotinoid imidacloprid disrupts sex allocation cue use during superparasitism in the parasitoid waspNasonia vitripennis.Ecol. Entomol. 41, 693–697. (doi:10.1111/een.12344) 52. Tappert L, Pokorny T, Hofferberth J, Ruther J. 2017