
ABSTRACT
SULLIVAN, STEPHANIE TOLSTEDT. Functional Biomaterials: Solution Electrospinning and Gelation of Whey Protein and Pullulan. (Under the direction of Saad A. Khan, Ph.D.).
Utilizing biomaterials that are biodegradable, biocompatible and edible serve well for food products as well as biomedical applications. Biomaterials whey protein and pullulan both have these characteristics. Whey proteins (WP) have been used in food products for many years and more recently in pharmaceutical products. They have the ability to form both gels and stable foams. Pullulan (PULL) has also been used in both food and pharmaceutical products, and is a highly water soluble, non-gelling polysaccharide and has been used primarily as a film former. Herein, we investigate the ability of whey protein and pullulan to form nanofibers and gels. Combining their distinct properties allows the ability to uniquely manipulate nanofiber and gel characteristics and behavior for a variety of applications, from food to even tissue scaffolding.
First, we determined the electrospinnability of aqueous whey protein solutions. Both whey protein isolate (WPI) and one of its major components β–lactoglobulin (BLG), either in native or denatured form, yielded interesting micro and nanostructures when electrosprayed; while nanofiber production required blending with a spinnable polymer, poly(ethylene oxide) (PEO). WP:PEO solutions were also successfully electrospun at acidic pH (2≤pH≤3), which
Photoelectron Spectroscopy (XPS) also confirmed the presence of WP on the surface of the blend fibers, augmenting the FTIR analysis. Interestingly, WP:PEO composite nanofibers maintained its fibrous morphology at temperatures as high as 100 oC, above the 60 oC PEO melting point. Further, we show that the blend mats retained a fibrous structure after the heat treatment.
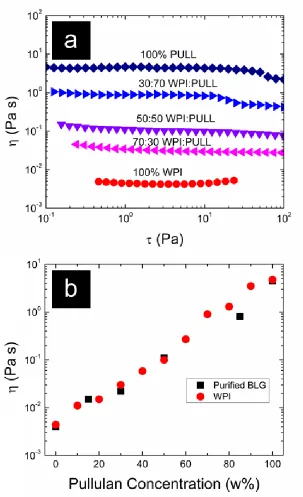
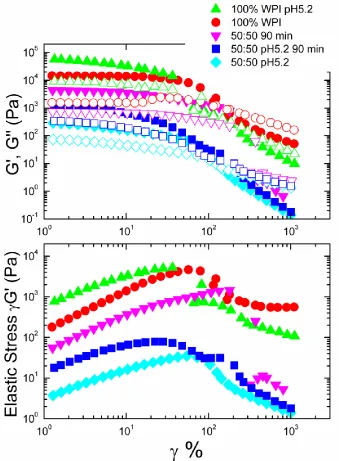
Our second goal was to evaluate the ability of aqueous blends of whey protein and pullulan to form gels. We first looked at WP-PULL blend solutions at room temperature, finding an increasing linear trend in low shear viscosity as the relative concentration of pullulan increased. Blend solution samples were then heated to determine the ability of the blend solutions to form a gelled network. Starting with a homogeneous WP gel, adding PULL, at native mix or alkaline pH, maintained a transparent homogeneous microstructure, but resulted in weaker gels based on its response to stress. At WP isoelectric point (IEP) pH, both protein and blend gels became opaque due to protein aggregation, forming a particulate gel. All gels at the IEP were weaker, yielding at much lower stress and corresponding strain, due to the protein aggregation. The addition of transglutaminase enzyme yielded a stronger network than the native samples, while the addition of sodium trimetaphosphate salt yielded weaker gels and also induced relevant particle and/or course stranded microstructure in both pH 8 and IEP cases.
form insoluble fibers using ethylene glycol diglycidyl ether (EGDGE), a chemical used in food contact coating applications. Next, solution blends of pullulan with whey protein were prepared and also electrospun at varying pH and relative biomaterial concentrations at 17 total w/w%. PULL-WP blend nanofiber mats were crosslinked via heat treatment and found to be both swellable and insoluble. When dried, the mats did not return to their original fiber state and instead appear to be gelatinous fibers in nature after soaking, and thereby making them potentially useful for tissue scaffolding applications.
A fourth accomplishment was to utilize Near Infrared Reflectance (NIR) Spectroscopy and Chemometrics techniques to analyze commercial whey protein powder characteristics such as protein, fat and moisture content as well as pH. NIR has been utilized in the food and pharmaceutical industries for quality control as a valuable compliment to or replacement for more expensive testing such as High Performance Liquid Chromatography. Analysis resulted in the development of quantitative, linear regression models to correlate whey protein powder characteristics to NIR data.
Functional Biomaterials: Solution Electrospinning and Gelation of Whey Protein and Pullulan
by
Stephanie Tolstedt Sullivan
A dissertation submitted to the Graduate Faculty of North Carolina State University
in partial fulfillment of the requirements for the degree of
Doctor of Philosophy
Chemical and Biomolecular Engineering
Raleigh, North Carolina 2011
APPROVED BY:
_______________________________ ______________________________
Dr. Saad A. Khan Dr. Jan Genzer
Committee Chair
________________________________ ________________________________
DEDICATION
To God, for all the blessings in life you have brought to me. Thank you. You have given me much more than I could possibly deserve.
To both of my parents, for bringing me into this world and giving me their support in every way they could throughout my many years of life. To my mother, for helping me to learn math when I was a kid and making it fun. To my father, for working with me on my tennis so that I could be an athlete for life and for teaching me the art of observation.
To Dr. George Pearsall, Professor Emeritus of Duke University, for career guidance, friendship and support throughout many years. I could not have jumped into or survived these waters without you.
To my brother, Brad, for listening and understanding and even beating me (by a long shot) to the finish of this thing called “P h D.” I was not sure that I could finish this endurance event
as you did. Whew! Time to vacation in Hawaii! I know where to find you!
To my husband, Michael, for putting up with my long hours away from home and getting the kids where they need to go. You have done your best to understand all this and more. You are a great tennis coach and will be a great elementary school teacher one day. I will support you in every way I can for you to get there, as you have me to finish this effort. Thank you.
To Bill, for supporting my change to become chemical engineer. I will be forever proud of that “A” in Dr. Roberts graduate reaction kinetics course, as I never thought I could do better
than you in anything chemical engineering. You are forever a smart man and no doubt could do this “P h D” thing too, if you had wanted to finish.
To my friend, Mandy Peacock (Raleigh, NC), for giving me friendship, refuge and hospitality so I could afford to work away from home.
To my favorite “little old lady in tennis shoes” - the late Isabella Cannon - who was a pioneer
as well as wonderful leader, friend and role model to me in her little house on Brooks Ave.
To my cousin, Jonathan Tolstedt (Fargo, ND). for sharing wisdom and humor – you are a joy to all in your life; and my aunt, Velma McCarthy (Burke, SD), who is a pillar of strength, endurance and love for her family. I am so glad we have reconnected and I look forward to visiting you again soon. I have missed you all dearly.
To Steven (Huron, SD), for giving me a dream and an example of leadership, spirituality and stature to follow. I love and miss you always.
BIOGRAPHY
Stephanie Tolstedt Sullivan was born in Columbus, Ohio in 1968. She was blessed to receive the Glenna R. Joyce Scholarship to attend the University of Notre Dame, where she attended from 1986 until 1990, graduating cum laude with a Bachelor of Science degree in Mechanical Engineering and had an opportunity to play varsity women’s tennis too. While
there, she was fortunate to earn the opportunity to participate in the National Science Foundation Research Experience for Undergraduates program, working with Professor Patrick F. Dunn in the summer of 1989. Following completion of her undergraduate degree, she went to work for Amoco Oil Company in Whiting, Indiana and moved with that company to their Texas City, Texas refinery, working as a project engineer. As she trained towards the next step in her career there, to be a maintenance engineer, a personal decision had her move to a new company and work for Stone & Webster Engineering Corporation in Katy, Texas as a fluid systems engineer. After working for these companies and with chemical engineers, she decided to attend graduate school at North Carolina State University (NCSU) in their Department of Chemical Engineering beginning in 1993.
maintenance engineer for PCS Phosphate’s (Aurora, NC) phosphoric acid plants, and later as
a production engineer for their diammonium phosphate plants (DAP). In this latter position, she had the opportunity to work with experts (she found at the University of Queensland, Australia, in Chemical Engineering) on the granulation process utilized in DAP production. This process is similar to a high shear granulation process used in solid dosage form manufacturing in the pharmaceutical industry, in which she in 1998 earned a position for Merck & Co., Inc. (Wilson, North Carolina) working for Dr. Harry Suryakusuma. After eight years in various positions at that location, where she stayed in order to support her husband’s local business, she learned of a new engineering program starting at East Carolina
ACKNOWLEDGMENTS
I would like to express my deep gratitude to my advisor, Professor Saad Khan, for his support, help, advice and guidance during the course of this work. You inspired me during my Masters degree about the study of polymers and rheology, and I was so thrilled to be able to return to NCSU to work with you in this area. Thank you for permitting me to work with you and for all of your time and understanding - priceless. I have adored you and your family since we lived in the same apartment building starting in 1993. Thank you so much to my committee – Dr. Jan Genzer, Dr. Richard Spontak and Dr. Russell Gorga. You are all brilliant, amazing engineers, scientists, researchers and men. It has been an honor to present my work to you and learn from you. I wish I had had more time with all of you – to learn and apprentice. Your students are so very blessed.
The wonderful graduate students in the Khan group are all my idols. You, too, are all brilliant engineers and researchers. It has been such an honor to know you and I wish I could have learned more from you. Special thanks to Dr. Ahmed Eissa and fellow students Dr. Christina Tang, Dr. Sachin Talwar, Dr. Sara Arvidson, Dr. Christopher Bonino, Dr. Annie Chu as well as post-doctoral fellow Dr. Carl Saquing for guidance and discussion; along with new fellow students MAJ Christopher Johnson (US Army) and Alina Higham helping me out the door. Christina, you are amazing and no doubt will be running your own research organization one day; I enjoyed our adventure to Switzerland – my only trip to Europe!
Christine Grant, my M.S. thesis advisors; Dr. David Ollis, especially for liking my use of color on my TRANSPARENCIES (note not power point slides back then) during my proposal course practice presentations in 1994; and Dr. Peter Kilpatrick who was always a supportive and smiling face as well as taught a great course in colloids & surface science – and now at my alma mater! Thanks to Dr. Hubert Winston - always welcoming and helpful; Dr. Peter Fedkiw, for welcoming me back… I was happy to survive your class years ago; Dr. Carol Hall who was a supportive ear in my younger days, as well as great teacher, making fun links between chemical thermodynamics and certain elements of life – my needing more help on the latter than the former! Notably, Dr. George Roberts who really made the connection for me between the work I had done in industry and the theoretical. I knew I was in the right place after taking your course. I was so pleased to have the opportunity to talk with you several times after returning to NCSU in 2006, and you are sorely missed by all. I only wish I had learned more from you and all at NCSU.
The great staff of the Department of Chemical & Biomolecular Engineering has always been so sweet and helpful – Sandra Bailey, Diane Harper and Sheila Hayes especially have well tolerated me – bless you! Also, thanks to Dr. Michelle Casper, Dr. Kirill Efimenko, Casey Galvin, Erich Bain for technical support of this effort. Thank you to Dr. Allen Foegeding and Yie Hui Yong, Dr. Orlin Velev and Dr. Jan Genzer all for support and utilization of their facilities. Kit has always been amazing.
your materials science knowledge. I also want to thank Paul Kauffmann and for bringing me to ECU and supporting me more than perhaps I even realize. I hope to be able to “toot my own horn” better one day. Thanks to Dr. Evelyn Brown, Dr. Melani Duffrin, Dr. William
(Ed) and Darlene Howard, Becky Foster, Dr. John Reis, Dr. David White, Dr. Hayden Griffin, and Bruce Peterson for listening, support and kindness. Certainly, thanks to all Department of Engineering and other College of Technology & Computer Science faculty and staff for understanding and support! Joel Sweatte, Steve Mockbee and Randy Godwin for computer and data storage support. Melani, your support as neighbor, especially in helping my children, has been priceless.
Thanks to ECU Professors Dr. Cathy Hall, Dr. Bill Swart and Dr. Steve Duncan for their collaboration as well as reminders and prodding to finish my doctoral work, in addition to support of my leadership initiatives for ECU students – especially to Steve for making several connections for my leadership speaker series. Special thanks to my friends COL (Retired) Worth Carter (USAF) and CPT Annie Khamphengphet Hester (US Army) for support over the last three years and keeping me somewhat sane. You have gone above and beyond service to your country! Also, thanks to the wonderful athletes with whom I have had the honor to attempt to keep up including Matt Maloney and Tricredibles Mike Columbo and Super Bob Morrison! I have appreciated your smiling and welcoming faces.
whatever you put your mind to: Jamelle Simmons, Thomas A. Deaton, Joseph A. Rose, Clay Rice, Victoria Miller, Eric Franson, Adam Hussaini, Lauren Bridgers, Michael Cannon, Christopher Eckert, Dao Dinh, and Mohammed Akbar. Jamelle, you have worked with me for four years and it has been an honor. I would also like to thank my good friends Waz Miller and Bedie & Ron Kohake for helping with countless things for my children; and good friends Gary Crecelius, Beverly Day, and Betsy Whitley who provided encouragement.
One final acknowledgment I feel I must make is to the good Samaritan medical doctor who, after being in a car accident, got out of his hospital bed and worked all night long in pain from several broken ribs and other injuries to save my dad’s life in 1962.
Without you, my father would not have survived or gone on to do his incredible works of art and inspire his lifetime of students to do the same. Also, my brother and I and my children would not be here without your help, as we were born well after 1962. Since I learned of the details of the event in which my dad’s appendix had burst, his abdomen became riddled with
infection, and he was administered his last rites – with all attending to him having given up on providing him the care he needed to help him survive and keep him alive (and important to note that you were NOT on staff at the hospital but a PATIENT and nurses were telling you to get back in bed!), I have wanted to find out who you are. I hope to one day soon. You would be in your mid to late seventies by now. I have no riches or rewards to give you, just hugs, thanks and prayers. I hope one day that I and my children can do proud the sacrifice and gift you delivered to us all through saving my father’s life. I hope you and your
TABLE OF CONTENTS
LIST OF TABLES ... xiv
LIST OF FIGURES ... xvi
CHAPTER 1 Motivation, Goals and Background ... 1
ABSTRACT ... 1
1.1 Motivation and Goals ... 2
1.2 Background ... 6
1.2.1 Whey protein ... 7
1.2.2 Whey Protein Gelation ... 9
1.2.3 Pullulan ... 11
1.2.4 Protein-polysaccharide gelation complexes ... 13
1.2.5 Pullulan nanofibers ... 16
1.3 Organization of Dissertation ... 18
1.4 References ... 20
CHAPTER 2 Solution Electrospinning Whey Protein ... 46
ABSTRACT ... 47
2.1 Introduction ... 48
2.2 Materials & Methods ... 51
2.2.1 Solution Preparation ... 51
2.2.2 Solution Electrospinning ... 51
2.2.3 Morphology & Surface Analysis ... 52
2.3 Results and Discussion ... 53
2.3.2 Electrospinning WP:PEO blends ... 55
2.3.3 Effect of pH on whey protein/PEO electrospinning ... 56
2.3.4 WPI:PEO blend fiber analysis ... 58
2.3.5 Nanofiber heat treatment ... 63
2.3.6 Incorporation and release of a small molecule ... 65
2.4 Conclusions ... 68
2.6 References ... 70
CHAPTER 3 Functional gels of whey protein and pullulan blends ... 88
ABSTRACT ... 89
3.1 Introduction ... 91
3.2 Materials and Methods ... 93
3.2.1 Materials ... 93
3.2.2 Gel Preparation and Rheological Evaluation ... 94
3.2.3 Microscopic Observation ... 96
3.3 RESULTS & DISCUSSION ... 98
3.3.1 Effect of protein-polysaccharide solution properties on gel formation ... 98
3.3.2 Blend Gel Microstructure ... 102
3.3.3 Modifying WP:PULL blends with enzyme and STMP addition ... 104
3.4. Conclusion ... 114
Acknowledgments ... 116
APPENDIX A. Pre-rheological study of blend gel formation at pH 8. ... 130
APPENDIX B. NuPAGE results from purification of BLG. ... 132
3.5 References ... 133
CHAPTER 4 Pullulan Nanofiber Crosslinking by heat and chemical methods ... 142
Abstract ... 143
4.1 Introduction ... 145
4.2 Materials & Methods ... 148
4.2.1 Solution Preparation ... 148
4.2.2 Solution Electrospinning ... 149
4.2.3 Morphology & Surface Analysis ... 150
4.3 Results and Discussion ... 152
4.3.1 Effect of polymer concentration ... 152
4.3.2 Blending with WP ... 155
4.3.3 Impact of pH on morphology and electrospinnability of PULL:WPI blends ... 156
4.3.5 Blending with HPBCD ... 162
4.3.6 Impact of crosslinking by chemical treatment ... 164
4.4 Conclusion ... 166
ACKNOWLEDGMENTS ... 168
APPENDIX A. PULL:WPI blend solution properties and electrospinning parameters. . 182
APPENDIX B. PULL:HPBCD solution and electrospinning parameters. ... 184
4.5 References ... 186
CHAPTER 5 Near Infrared Reflectance (NIR) Spectroscopy of Commercial Whey Protein Powders ... 192
5.1 Introduction ... 195
5.1.1 Whey Protein Concentrate ... 195
5.1.2 Chemometrics ... 195
5.1.3 NIR Spectroscopy ... 196
5.1.4 Multivariate Calibration ... 196
5.2 Materials & Methods ... 197
5.2.1 Overview of Sample Sets ... 197
5.2.2 NIR Spectroscopy ... 197
5.2.3 Sample Preparation & Loading ... 198
5.3 Chemometric Analysis ... 199
5.3.1 Software and Algorithms ... 199
5.3.2 Initial Preprocessing ... 199
5.3.3 Importing CoA Concentrations ... 200
5.3.4 Selection of Training and Validation Sets ... 200
5.3.5 Partial Least Squares (PLS) Models ... 201
5.4 Results ... 202
5.4.1 PLS for Protein Model ... 202
5.4.2 PLS for Fat Model ... 202
5.4.3 PLS for Moisture Model ... 203
5.5 Discussion ... 203
5.5.1 PLS Models ... 203
5.5.2 Sample Size & Range ... 204
5.5.3 Advantages and Disadvantages of NIR Spectroscopy ... 204
5.5.4 NIR Calibration Standardization ... 204
5.6 Conclusion ... 205
5.7 Acknowledgments ... 206
REFERENCES ... 207
CHAPTER 6 Conclusions & Recommendations ... 219
6.1 Conclusions ... 220
6.1.1 CHAPTER 2 Solution Electrospinning Whey Protein ... 220
6.1.2 CHAPTER 3 Functional gels of whey protein and pullulan blends ... 222
6.1.3 CHAPTER 4 Pullulan Nanofiber Crosslinking by heat and chemical methods... 224
6.1.4 CHAPTER 5 Near Infrared Reflectance (NIR) Spectroscopy of Commercial Whey Protein Powders ... 225
6.2 Recommendations ... 225
6.2.1 Extensions of this work ... 225
6.2.2 Additional potential research ... 226
APPENDICES ... 228
Appendix A. Excerpts from CURRICULUM VITAE (2006-2011) ... 229
Appendix B. Highlight images: 2006-2011. ... 232
LIST OF TABLES
Table 1.1. Solution electrospun proteins………. 37
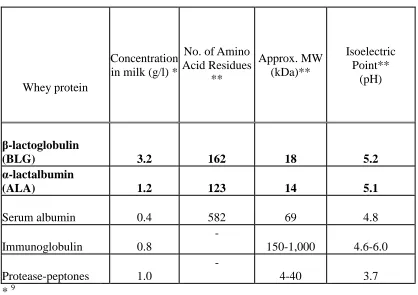
Table 1.2. Whey protein properties………. 39
Table 1.3. Functional Properties of Whey Proteins………. 39
Table 1.4. β–lactoglobulin (BLG) characteristics with pH………. 40
Table 1.5. Destiny of pullulan in human consumption……… 40
Table 1.6. Studies that included rheological evaluation of pullulan solutions…… 41
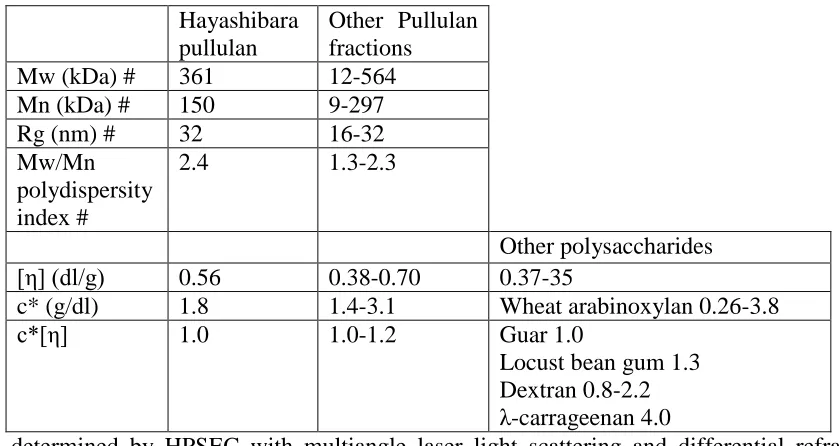
Table 1.7. Molecular characteristics of commercial Hayashibara pullulan………. 42
Table 1.8. Whey protein-polysaccharide gelled systems analyzed using rheometry……… 43
Table 2.1. Conformational analysis of WP:PEO nanofiber sample protein secondary structure showing the effect of concentration, pH and dye addition. *BioPURE BLG used as received. pBLG is BioPURE BLG that has been purified……….. 85
Table 3.1. Protein and blend gel fracture stress and strain………... 126
Table 4.1. FTIR peaks representative of pullulan……… 177
Table 4.2. FTIR spectra analysis of 3-7% BLG in deuterium oxide solution…….. 177
Table 5.1. Certificate of Analysis (CoA) concentrations of mixture components that serve as the measured concentrations for comparison against the NIR spectra predictions. These concentrations are sorted and split into training (calibration) and test (validation) sets. Samples 47-51 were split up into training and test sets as well………. 203 Table 5.2. Numerical results of Partial Least Squares (PLS) modeling for
Square Error of Prediction of 6.258……….. 205 Table 5.3. Numerical results of Partial Least Squares (PLS) modeling for fat%
concentration. Out of the 18 factors run, it was determined that only 2 factors were needed to accurately model all of the data. Adding additional factors would do very little in improving the model; the increase in factors would risk over-fitting the PLS model to the data reducing its predictive capabilities for fat% determination of future unknown samples. The use of 2 factors yields a Root Mean Square Error of Prediction of 0.270……….. 206 Table 5.4. Numerical results of Partial Least Squares (PLS) modeling for
moisture% concentration. Out of the 18 factors run, it was determined that only 3 factors were needed to accurately model all of the data. Adding additional factors would do very little in improving the model; the increase in factors would risk over-fitting the PLS model to the data reducing its predictive capabilities for moisture% determination of future unknown samples. The use of 3 factors yields a Root Mean Square Error of Prediction of 0.190……….. 207 Table 5.5. Numerical results of Partial Least Squares (PLS) modeling for pH
concentration. Out of the 18 factors run, it was determined that only 4 factors were needed to accurately model all of the data. Adding additional factors would do very little in improving the model; the increase in factors would risk over-fitting the PLS model to the data reducing its predictive capabilities for pH determination of future unknown samples. The use of 4 factors yields a Root Mean Square Error of Prediction of 0.149………
LIST OF FIGURES
Figure 1.1. Molecular structure of pullulan……… 35
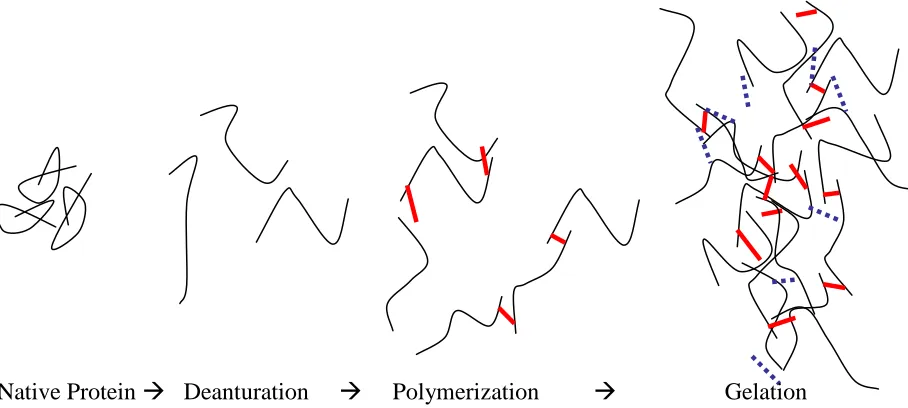
Figure 1.2. Schematic representation of gelation of globular proteins. Solid short connections refer to chemical bonding (disulphide), while dotted connections refer to physical interactions (hydrogen
bonding, hydrophobic interactions and electrostatic interactions). 36
Figure 2.1. Electrospun whey protein microstructures (a) whey protein isolate (WPI) 25 w/w% in deinonized water (DW) [flowrate 1 ml/hr, 12 cm TCD, 30kV]; (b) 17 w/w% β-lactoglobulin (BLG), 5M ethanol, 20mM HCl in DW [flowrate 2 ml/hr, 17 TCD, 15 kV]; (c) 10 w/w% BLG 8M urea in DW [flowrate 1 ml/hr, 12 cm TCD, 30kV]; (d) 17 w/w% WPI in DW mixed with ethanol 5:1
bar shown applies to all images………. 73
Figure 2.2. Scanning electron micrographs and fiber diameter analysis of whey protein isolate (WPI) and poly(ethylene oxide) (PEO) blend solution electrospun nanofibers. PEO 4 w/w% with increasing WPI (and thus total weight) concentration, with WPI:PEO ratio
(a) 0:100; (b) 40:60; (c) 50:50; (d) 60:40; (e) 75:25……….. 74
Figure 2.3. Scanning electron micrographs and fiber diameter analysis of β-lactoglobulin (BLG) and poly(ethylene oxide) (PEO) blend solution electrospun nanofibers. Fibers spun at 15 cm tip-to-collector distance and 22 gauge needle. Total 10 w/w% with BLG:PEO ratio (solution viscosity Pa s; flow rate ml/hr; voltage) (a) 75:25 (0.5; 1.0; 9.5 kV); (b) 60:40 (3.2; 0.5 ml/hr; 10.5 kV);
(c) 50:50 (10; 0.2 ml/hr; 10 kV); (d) 40:60 (23; 0.1 ml/hr; 15 kV). 75
Figure 2.4. Scanning electron micrographs of total weight 5.5 w/w% PEO:WPI acidic blend mats (a) 50:50, (b) 57:43, (c) 66:34 and (d) 80:20 by weight blend solution electrospun nanofiber mats produced. (e) provides solution and nanofiber data, with *nanofiber data determined from NIH Image J analysis with
Figure 2.5. Scanning electron micrographs of solution electrospun nanofibers from total 7 w/w % solution of 50:50 purified BLG:PEO at pH (a) 7.5; (b) 5.2; (c) 4.0, (d) 2.0. (e) shows solution steady shear viscosity vs. shear stress; (f) provides FTIR comparison of 50:50 WP:PEO fiber mat prepared from neutral pH and acidic pH 2; and (g) provides mean nanofiber diameter, X-ray photoelectron spectroscopy (XPS) and solution data for these mats of varying pH. Fiber mats at pH 5.2 and 4.0 each contained bead defects. For example, fibers formed with pH 5.2 solution had bead defects with measured average diameter of 1 µm. *Note that XPS was
only completed on fiber mats of pH 2, 5.2 and 7.5……… 77
Figure 2.6. (a) FTIR absorbance spectra for raw materials and representative PEO/WPI blend nanofiber mat; (b) Amide I Region of the 50:50 PEO:WPI sample showing the original spectrum and the Fourier self-deconvolved spectrum (Bandwidth 42 cm-1, enhancement: 3.5); (c) Peak positions of the resolved Amide I region of whey protein isolate on PEO fibers. Protein secondary structure information for source material and nanofiber mats is given in
Table 1………. 78
Figure 2.7. An XPS survey scan is displayed for electrospun nanofibers generated from 4 w/w% PEO solutions with and without WPI. The inset table provides the atomic percent of each element
present on the nanofiber mat surface………... 79
Figure 2.8. Reflected light dark field microscope images of heat treated whey protein isolate (WPI) and poly(ethylene oxide) (PEO) blend solution electrospun nanofiber mats. PEO 4 w/w% with increasing WPI concentration, with WPI:PEO ratio (a) 0:100; (b) 40:60; (c) 60:40; (d) 75:25. Insets in (a) – (d) are SEM images of original mats (before heat treatment) at same scale as reflected light microscope images. (e) is reflected light image of (b) 40:60 WPI:PEO at lower magnification, showing melt appearance; while (f) is reflected light image of (d) 75:25 WPI:PEO at lower magnification, showing networked fiber gel appearance with thinner fibrous sample edge that was formed from pulling mat
Figure 2.9. Scanning electron microscope images of 8 w/w% purified BLG (pBLG)/PEO blend nanofibers (a) after and (b) before (inset) heat treatment at 80°C; PEO nanofibers (c) before (inset) and (d) after heat treatment at 80 °C. Images (a) and (b) are at same scale; as are (c) and (d). (e) and (f) provide DSC thermographs of nanofiber mats and powders: scan (1) purified BLG (pBLG) powder; (2) pBLG:PEO 50:50 native nanofiber mat (b); (3) pBLG:PEO 50:50 heat treated nanofiber mat (a); (4) PEO nanofiber mat (c); (5) BiPRO WPI powder; (6) WPI:PEO 50:50 heat treated nanofiber mat; (7) WPI:PEO 50:50 native nanofiber
mat; (g) summarizes DSC data……… 81
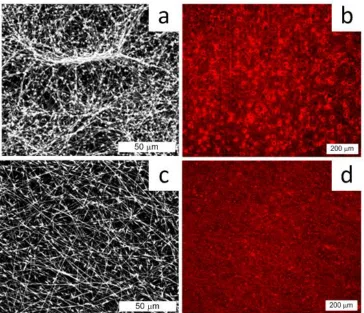
Figure 2.10. PEO fiber mat with 4 w/w% PEO and 0.02% RhB in deionized water without BLG (a) scanning electron micrograph, (b) confocal microscope image of RhB distribution; and with BLG (50:50 BLG:PEO for total 8 w/w%) (c) scanning electron
micrograph, (d) confocal microscope image of RhB distribution. 82
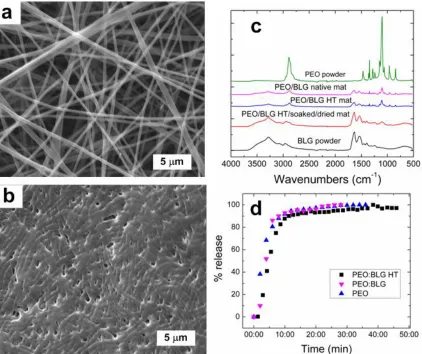
Figure 2.11. PEO:BLG (50:50 BLG:PEO for total 8 w/w%) blend fiber mat (a) post heat treatment at 100 °C for 18 hrs, (b) post heat treatment then after soaking in water and air drying, (c) FTIR comparison between native, heat treated, heat treated/immersed/dried mats and raw material powder, (d) release of RhB over time from fiber mat samples of PEO, BLG:PEO and
heat treated BLG:PEO……….. 83
Figure 2.12. PEO:WPI (25:75 for total 16 w/w%) nanofiber mat with post heat treatment at 100 °C for 44 hrs (a) post heat treatment, (b) suspended soaking in deionized water, (c) sample removed from water soak, (d) SEM of sample (c) air dried and sputter coated
with gold……….. 84
Figure 3.1. (a) Solution viscosity vs. Shear Stress for 100% WPI, 50:50 WPI:PULL blend and 100% PULL 17 total w/w% aqueous solutions. (b) Solution low shear viscosity of 17 total w/w% whey protein and pullulan blend solutions. X-axis denotes pullulan
Figure 3.2. Dynamic frequency spectrum of the Elastic (G′) (closed symbols) and viscous (G″) (open symbols) moduli of protein and protein-polysaccharide blend heat set gels and pullulan heat treated 17
total w/w% solutions……… 115
Figure 3.3. Effect of increasing strain amplitude on top: Elastic (closed symbols) and Viscous (open symbols) moduli and bottom:
Elastic stress G′γ……….. 116
Figure 3.4. Schematics for heat induced structural modifications of BLG for (a) neutral or alkaline medium such as pH 6.8 or (b) at the BLG isoelectric point (IEP) [recreated from Linden et al., 1999]67 with (c) ESEM of WPI:PULL blend gel slice. Representative sample of homogeneous continuous gel samples; this formed from pH 6.8 20 total w/w% solution 60:40 WPI:pullulan by weight. Surface of gel has smooth topography and no visible particles and
thus is not a particulate gel……….. 117
Figure 3.5 Confocal (top) and ESEM (middle) images of WPI:Pullulan 50:50 blend (left) and 100% WPI (right) particulate gels slice. Gel formed from pH 5.2 17 total w/w% solution. Bottom is 3D confocal image of protein aggregation observed in 50:50
WPI:Pullulan blend………. 118
Figure 3.6 FTIR spectra of WP only and WP-PULL blends before and after heating at native mix pH. In the blend solution, there is a noticeable shift in the hydroxyl band including a more predominant peak at 2962 cm-1 indicating C-H asymmetric
stretching……….. 119
Figure 3.7 Benchtop time-domain NMR transverse relaxation times (T2) for purified BLG, purified BLG:PULL and PULL native and heat
treated aqueous solutions……….. 120
isolate and pullulan……….. 121
Figure 3.9. G′ elastic modulus evolution during dynamic oscillatory frequency sweep comparing WP and WP:PULL blend solutions comparing (a) at pH 8 and (b) at pH 5.2 the addition of TG enzyme; while comparing (c) at pH 8 and (d) at pH 5.2 the
addition of STMP………. 122
Figure 3.10. Effect of frequency (ω) on tan δ for pH 8 (top) and pH 5.2 (bottom) formed gels with additive transglutaminase enzyme (Enzyme) or sodium trimetaphosphate (STMP) and without (Native), where solid symbols are 100% WPI, open symbols are 50:50 WPI:PULL blends, and x-centered symbols are 100%
PULL……… 123
Figure 3.11 Yield/Fracture Stress and Yield/Fracture strain % at maximum elastic stress versus WPI concentration as % of total of 17 w/w% original solution concentration for native (top), TG enzyme
(middle) and STMP (bottom) gels……….. 124
Figure 3.12 Top images show confocal microscope images of samples that showed microstructure. Bottom are FTIR spectra of WP and WP:PULL blend gels at pH 8 showing changes with addition of
enzyme and STMP……… 125
Figure 4.1. (a) molecular structure of pullulan, (b) Solution viscosity vs. shear stress for aqueous pullulan solutions at varying concentrations, and (c) solution conductivity vs. pullulan
concentration……… 165
Figure 4.2. Rheological solution properties of pullulan: a log-log plot of specific viscosity vs. concentration for pullulan solutions with a
three linear fit model……… 166
11.7 kV], (d) 15 w/w% [14cm TCD, 1.0 ml/hr, 9kV], (e) 12 w/w% [15 cm TCD, 1.75 ml/hr, 10.9 kV], (f) 11 w/w% [12 cm TCD, 1.0 ml/hr, 7.5 kV], (g) 9 w/w% [14 cm TCD, 1.1 ml/hr, 8.5 kV] (h) 6 w/w% [14cm TCD, 1.4 ml/hr, 9kV], (i) representative histogram results from SEM image analysis while (j) and (k) are SEM and confocal, respectively of 18 w/w% solution electrospun mat containing 0.2 w/w% RhB………
Figure 4.4. (a) Nanofiber mat of PULL:BLG, (b) Solution viscosity vs. shear stress for aqueous pullulan:WPI native mix pH blend solutions of varying composition at 17 total biomaterial w/w% and (c) – (e) are nanofiber mats at various PULL:WPI ratios blend nanofibers at mix pH. (c) 70:30 PULL:WPI (18cm TCD, 1 ml/hr, 26 kV), (d) 60:40 PULL:WPI (16.5 cm TCD, 0.65 ml/hr, 26 kV), (e) 50:50 PULL:WPI (18cm TCD, 1 ml/hr, 25 kV), (f) 30:70
PULL:WPI (14 cm TCD, 0.9 ml/hr, 18kV)……… 168
Figure 4.5. (a) Rheological solution properties of pullulan, PULL:WPI and PULL:BLG blends: a log-log plot of specific viscosity vs. concentration for pullulan solutions and (b) viscosity vs. shear
stress for solutions of varying blend composition and pH……. 169
Figure 4.6. (a) – (o) Pullulan-whey protein isolate nanofibers varying concentration and pH. (p) is mean fiber diameter vs. % pullulan in fiber blend for each pH. Only fiber mats that did not have
significant bead defects are included in data……….. 170
shown was heat treated for 18 hours at 100 °C. The solid lines are native samples, while the dashed lines are samples that were
annealed at 150 °C before XRD……….. 171
Figure 4.8. During (a) and Post (b) 24-hour room temperature deionized water soaking of 24 w/w% 50:50 PULL:WPI blend fiber mat (15cm TCD, 16.8 kV, 1 mL/hr, 22 gauge 2” Needle) that had been heat treated 46 hours (oven, 100 °C); (c) SEM of same mat during heat treatment (at 18 hour time point). (d) ESEM of surface of (b); (e) and (f) are ESEM of (b) at tear location. (g) and (h) are ESEM of (b) at alternate locations showing structure beneath smooth scaffold-water interface. (i) is confocal image of same 46-hour heat treated mat following 4-day soaking in
deionized water……… 172
Figure 4.9. FTIR spectra for (a) BLG, pullulan mat and PULL:BLG blend mat, (b) pre and post soak of PULL:WPI and PULL:BLG blend
fiber mats – full spectra and (c) partial spectra………... 173
Figure 4.10. PULL-HPBCD fiber mats prepared from total 20 w/w% aqueous solution with PULL:HPBCD (a) 25:75; (b) 50:50 with (g) fiber diameter frequency; (c) 75:25 with (h) fiber diameter frequency; (d) 90:10 with (i) fiber diameter frequency; and (e) 100:0 with (j) fiber diameter frequency. (f) shows linear increase in fiber diameter with increasing pullulan concentration of defect free fibers. (k) viscosity vs. shear stress of PULL:HPBCD blend aqueous solutions and (l) specific viscosity vs. concentration
log-log plot to compare data to theory……… 174
Figure 4.11 (a) XRD of 100% pullulan and PULL:HPBCD blend fiber mats and (b) FTIR of PULL:HPBCD native, EGDGE crosslinked, and crosslinked-water soaked mat in comparison to PULL only EGDGE crosslinked mat, which indicates that the PULL:HPBCD mat does retain some HPBCD in both EGDGE crosslinking and DW immersion. (c) Shows FTIR results in focused 1500 – 900
cm-1 wavenumber range………. 175
(c) were treated minutes before imaging with RhB-deionized water solution, with (a) deepest into sample from lens, but closer to surface where solution was applied, with (b) and (c) progressing closer to the objective and surface of microscope slide. (d) and (e) are the same fiber mat that has soaked suspended in deionized water for 48 hours, removed from soaking just before application of RhB dye solution, then imaged with (d) further from objective and (e) closer to objective and surface of microscope slide. The ESEM image in (f) shows the structure of the pullulan mat crosslinked in EGDGE after soaking in DW for 24 hours. The inset in (c) is a reflected light
microscope image of an EGDGE-crosslinked mat……….. 176 Figure 5.1. (A) NIR spectra with baseline correction, all reference and
spectral data without accompanying known concentrations were deleted. (B) Spectra of figure A with triplicates averaged and
wavelength trimmed to exclude upper spectral region with noise. 209
Figure 5.2. (A) factors needed to classify the protein model with a RMSEP of 6.258. (B) calibration and validation sets with measured concentrations (from CoA’s) compared to predicted concentrations determined by NIR and PLS. (C) residuals from
the calibration and validation models……… 210 Figure 5.3. (A) factors needed to classify the fat% model with a RMSEP of
0.270. (B) calibration and validation sets with measured concentrations (from CoA’s) compared to predicted concentrations determined by NIR and PLS. (C) residuals from
the calibration and validation models……… 211 Figure 5.4. (A) factors needed to classify the moisture% model with a
RMSEP of 0.190. (B) calibration and validation sets with measured concentrations (from CoA’s) compared to predicted concentrations determined by NIR and PLS. (C) residuals from the calibration and validation models………
212 Figure 5.5. (A) factors needed to classify the pH model with a RMSEP of
0.149. (B) calibration and validation sets with measured concentrations (from CoA’s) compared to predicted concentrations determined by NIR and PLS. (C) residuals from
CHAPTER 1 Motivation, Goals and Background ABSTRACT
1.1Motivation and Goals
The objectives of this study are to develop and examine novel functional gels and solution electrospun nanofibers of biomaterials. In particular, we are interested in two such materials – whey protein (WP), a cheese manufacturing co-product, and pullulan (PULL), a polysaccharide. Currently, both of these biomaterials are utilized in food, pharmaceutical and biomedical applications. Each is biocompatible, edible, and generally regarded as safe (GRAS) by the US FDA1, and used not just to modify food and other material’s properties, but as nutritional supplements as well.2-5 The three primary objectives of this study are to:
I. Examine strategies to develop WP nanofibers and correlate morphology to solution properties
II. Investigate formation and microstructure of WP-pullulan gels and ways to manipulate gel properties using enzyme and salt
III. Explore creation and crosslinking of pullulan and pullulan blend nanofibers to render this highly water soluble material insoluble
We will demonstrate the electrospinnability of whey protein, pullulan, and blends of these biomaterials as well as analyze the formation and microstructure of their blend gels.
and a grounded collector plate pull solution away from the Taylor cone8 formation at the tip of the syringe to the collector. As the solution is pulled away from the syringe, solvent evaporates, leaving the polymer drawn into fibers and collected as a fiber mat.9 The process control parameters can be divided into two categories, one of which is solution/melt properties including viscosity/concentration, surface tension, and conductivity; the other is the operating parameters during electrospinning process including electric field (or voltage applied and distance between spinneret and collector), flow rate, and other environmental parameters, which make it a complicated process for the achievement of defect-free fiber morphology and chemical composition.
Benefits of solution electrospinning include encapsulation of insoluble particles within a nanofiber mat, and the incorporation of soluble drugs in a uniform fashion 6. Nanofiber systems also can serve as wound dressings10 or as a scaffold for tissue engineering1112. Advanced nanofiber designs include modifying the nanofiber surface with bioactive peptides and proteins9; 13 and immobilizing enzymes.14
With the surge of electrospinning research, several proteins have been electrospun, although not whey proteins such as β-lactoglobulin (BLG) or α-lactalbumin (ALA). Table
Our first goal is to demonstrate that whey proteins can be electrospun and to evaluate those resultant nanofiber mats, including the impact of pH on electrospinning. Also, we evaluate the impact of heat treatment on WP fiber mats. Thus, the first challenge is to electrospin aqueous whey protein solutions. Sister milk protein casein could not be electrospun without the addition of spinnable polymer. 15 Also, due to the globular nature of whey proteins such as BLG and ALA, the low viscosity of their aqueous solutions, and expectations of entanglement being an issue, this will be a challenge.16-18 The addition of spinnable polymer may be required, as was executed with other proteins such as silk fibroin and egg proteins.19-21 Solution pH could also play a role in successful solution electrospinning, as it influences whey protein solution behavior.22 Certainly, formulation via solution electrospinning at various pH would likely be critical to its ability to tailor it to the sensitivity of the drug or flavenoid requiring delivery. Therefore, to be able to demonstrate that aqueous whey protein solutions can form nanofibers at acidic pH would then facilitate the consequential benefit of formulation flexibility and improved shelf life. Heat treatment of fibers could also play a role in the fiber mat structure, as whey protein can be heat denatured.23 Whey protein has also been investigated for use in drug delivery systems because it is edible, biocompatible and biodegradable. Thus, forming drug-loaded nanofibers of whey protein is desirable.24
demixing.70-72 and interfacial complex formation.73 Pullulan’s properties, such as highly mobile, water soluble and non-gelling on its own will provide greater flexibility in, not to mention its potential health benefits especially for diabetics.74 Development of new gel and fiber nanostructures of non-gelling pullulan and whey protein will provide additional opportunities for biotechnology application development as well as fundamental understanding of relationships between aqueous whey protein, pullulan and blend solution properties and their ability to form gelatinous structures not currently available.
Our third goal will further explore the use of edible, biocompatible and biodegradable pullulan to form both hydrophilic and hydrophobic nanofibers via solution electrospinning. Pullulan is a natural, water-soluble polysaccharide that is excreted extracellularly by the fungus Aureobasidium pullulans and comprised of maltotriose units (α-1,4 linked glucose molecules) polymerized by α-1,6-glucosidic bonds.575
The molecule is linear, amorphous,75 and forms a stair-step like structure (Figure 1.1). It is odorless, flavorless and highly stable. Pullulan has many current and potential uses in the food and pharmaceutical industries,76 and is being considered for part of therapeutic diets for individuals with type 2 diabetes mellitus because it helps maintain blood glucose levels.77-89,
895
Reports on native pullulan pharmacokinetics are minimal.5 Aqueous pullulan solutions are stable and viscous but do not gel, even in the presence of ions like borate that form complexes with hydroxyl groups.89 Although several group studies of hydrophobically-modified pullulans,88, the unmodified pullulan has GRAS status.79-83
United States Food & Drug Administration (US FDA) approved for only one human use.83 Thus, we are specifically interested in better understanding of pullulan aqueous solutions and their ability to form both hydrophilic and hydrophobic nanofibers. Since our study initiated in 2006, only two groups have explored pullulan electrospinning. The first prepared nanofiber mats blended with montmorillonite (MMT) clay to form nanocomposites90 and the second prepared in situ crosslinked pullulan fibers with food safe sodium trimetaphosphate (STMP) and sodium hydroxide (NaOH)91 following their work developing hydrogels of pullulan crosslinked with the same crosslinker (STMP) and initator (NaOH).92 We investigate other means of pullulan nanofiber crosslinking, including using chemical means with ethylene glycol diglycidyl ether (EGDGE) and using heat treatment of blends with whey protein that show promise for applications such as tissue scaffolding and food texture modification.
In summary, we will utilize whey protein and pullulan biomaterials for our study goals to develop novel electrospun nanofibers and gels while evaluating the influence of rheological and other solution properties on nanofiber and gel structure. Ultimately, this understanding will aid the further development of novel food, pharmaceutical and biomedical materials, such as the evaluation of drug and flavor release from these gels and nanofibers.
1.2 Background
specific questions we address in this study. The chapters that follow address these issues in more detail.
1.2.1 Whey protein
Whey proteins are one of two milk protein groups, with the other being caseins. Formerly considered a by-product of the cheese-making process, researchers have found that whey protein is a valuable dietary supplement in addition to serving as a functional food enhancer. Suppliers such as Davisco Foods, Inc. now consider it a co-product of cheese production due to its increased value. For many years, whey proteins have been used in food design due to its variety of functional uses including water and flavor binding as well as gelation, emulsification and foaming.93 From a medicinal standpoint, whey proteins are being studied and recognized for their antimicrobial, antiviral, anticarcinogenic and other beneficial metabolic and physiological effects.94,95 For example, whey in its natural conformation is rich in the amino acid cysteine, which is important in synthesizing the “major intracellular antioxidant” glutathione.2, 3, 96
which the molecule has a neutral charge. At their IEP, whey proteins tend to aggregate extensively. Table 1.2 lists the whey proteins and their properties.
Whey proteins have a variety of beneficial nutritional and product development properties. They have a balance of hydrophilic and hydrophobic residues, contain cysteine and cystine (antioxidant properties), have a globular structure with considerable helical content, are easily heat denatured and are stable in mildly acidic conditions. They are purified from milk using filtration, ion exchange or heat-precipitation techniques.97 Their ability to gel is utilized for food and other applications.98 Utilizing whey proteins at acidic pH is desirable to increase product shelf life and stability of biomaterials including those for pharmaceutical and food applications.
1.2.2 Whey Protein Gelation
Gelation involves the construction of a continuous network of macroscopic dimensions.100 In this regard, whey protein gelation requires denaturation of the protein molecules 56 followed by intermolecular interactions. Denaturation is required to expose the reactive functional groups of the protein. Interactions between these functional groups involve chemical bonding and physical interactions. A schematic representation of gelation mechanism is illustrated in Figure 3. Chemical bonding typically involves disulfide bonds formation, which is crucial for protein aggregation.101 Physical interactions include van der Waals interactions, hydrogen bonding, electrostatic and hydrophobic interactions. 57, 102, 103 A minimum protein concentration is required for gelation. This concentration is a function of temperature, pH and ionic strength.
Gelation is usually done via heat treatment at a temperature higher than denaturation temperature. This is known as thermally induced – or heat induced – gelation. Several publications have extensively studied thermally induced gelation of whey proteins.104 Whey protein gels are usually characterized by their rheological properties. Rheological characterization includes small strain and large strain properties, and such properties of the whey protein gels have been discussed in various publications.47, 105-108, 108, 109
1. Neutral or alkaline medium: gelation improves if electrostatic repulsion stabilizes unfolded BLG molecules (gel firm, elastic)
2. IEP: precipitation occurs (gel opaque, brittle, granular)
The third, acidic gelation, has also been investigated. Gelation of whey proteins at low pH may be thermally induced 110 or cold set.48, 53, 111 Thermally induced gelation at pH close to isoelectric point creates opaque gels with particulate microstructure, compared to the more transparent gels far from the isoelectric point. Several studies have been performed on gelling properties of whey proteins under acidic conditions.39, 104 Although gels formed at low pH (< 4) were brittle with low strain and stress at fracture, as opposed to those formed at high pH, which were rubber-like with high strain and stress at fracture,54,58, 112 the low pH environment is advantageous as it limits the microbial growth and increases product shelf life.45 Therefore, utilization of heat-induced whey protein gels at acidic conditions would be beneficial in reducing spoilage, but the rheological properties – i.e. weakness and brittleness –has limited the uses of the gels at such pHs. Acid induced cold gelation has showed
promise, however, noticeably increasing strength and elasticity of the gels.34 Enhancing the textural properties of whey protein gels at low pH is viable through acid induced, cold-set gelation, in which disulfide bonds are created in a neutral pH and then the pH is dropped to the required acidic pH.34 An alternative route is to induce enzymatic crosslinks to strengthen the protein network and enhance the texture.45
solutions into nanofibers – also looks at the influence of acidic pH on fiber morphology and even the impact of heat treatment and resultant formation of a gelatinous fiber mat. Critical issues we address for this first goal include the following:
– Can native aqueous solutions of whey protein (WP) electrospin?
– What is the impact of chemically denaturing WP?
– What is the impact of blending with spinnable synthetic polymer
poly(ethylene oxide)?
– How do acidic solutions perform?
– What is the impact of heat treatment?
– What can we understand from microstructure?
– What is the impact of loading a small molecule for release?
Whey protein will also be used in blends with the polysaccharide pullulan for gelation for the dissertation second goal and in combining with pullulan in nanofiber blends in the dissertation third goal discussed below. Thus, understanding whey protein characteristics and behavior is critical to this effort
.
1.2.3 Pullulan
Company (Japan) first produced pullulan commercially in 1976.22, 30, 34, 113, 114 Currently, Hayashibara uses potato, corn or tapioca starch in the fermentation process.88
Pullulan applications include food and pharmaceutical products such as confections, pharmaceutical tablets and capsules, films, beverages, binders, sauces,115 coatings and films, and even molded products by solution casting or thermoplastic extrusion. In fact, melt spinning of pullulan into fibers has been accomplished.75
Many of these applications are “biodegradable, transparent, oil resistant and impermeable to oxygen.”86, 116
Pullulan serves as an excellent adhesive, stronger than dextrin and gum arabic by nearly five times.76 In fact, when compression molded, it is claimed to be as strong and rigid as expanded polystyrene.75 Also, as a food additive, it helps to maintain food texture, such as refrigerated creamy formulations like mayonnaise.117 Hayashibara’s pullulan received GRAS status in the US in 2002, showing that pullulan is not mutagenic in a bacterial system and that no harmful effects resulted from pullulan consumption.118 Table 1.5 summarizes how pullulan is resolved in humans.
Several studies have evaluated properties of pullulan. In fact, pullulan has been used for some time as a standard in Size Exclusion Chromatography1 to determine average molecular weights (Mn, Mw, and Mz) because of its narrow polydispersity119. Also, many
For example, Matsumura et al. examined rheological behavior of some polysaccharide solutions including pullulan. A next step to his work would be to evaluate solutions at higher pullulan concentrations and/or higher shear rates to determine if the solutions will behave more solid-like. Lazaridou et al. (2003) achieved coil entanglement. They analyzed aqueous solutions of various pullulan molecular mass fractions, determining intrinsic viscosity [η], critical concentration c*, and coil overlap parameters (c* η]) Lazaridou et al. values for the commercial Hayashibara pullulan are given in Table 1.7, along with other pullulan fractions and polysaccharides. Extending rheological evaluation with dynamic oscillatory measurements to determine if solutions become more elastic at higher concentrations, particularly above c* may be desirable. Ding et al. (2005) used rheometry to analyze pullulan/gelatin phase separated mixtures. 118, 129-131 Spyropoulos et al. (2007, 2008) analyzed pullulan/sodium dodecyl sulfate (SDS) surfactant mixture rheology and microstructure. 118 Such mixtures like these already investigated as well as what we propose would be useful for food and other industry product development.
1.2.4 Protein-polysaccharide gelation complexes
protein to interact with other small molecules (such as drug and flavor molecules). Pullulan viscosity is “essentially unaffected by pH over a wide range of pH values (< 2 to > 11).”73
Therefore, pullulan can be utilized in both acidic and alkaline formulations with whey proteins. Some scientific challenges for the evaluation of these mixtures include both gel formation and nanofiber electrospinning.
For example, the food industry has been interested in biomaterial mixtures, especially those that may form emulsions, as a food texture improvement tool.88 However, it seems the literature lacks information on nonionic polysaccharides and in particular on the interaction between a widely used biomaterial – whey protein – and pullulan.
Recent studies have evaluated mixture properties of whey protein and other polysaccharides, primarily galactomannans. These are summarized in Table 1.8. Also, an extensive review of whey protein isolate-starch systems was completed by Pogaku et al.132 Starch is a “naturally occurring polysaccharide composed of semi-crystalline particles consisting entirely of anhydroglucopyranose residues”133
linked either by 14 or 16 glycosidic links.
Of note from Table 1.8 and the Tavares et al. (2003) study with WPI and locust bean gum is their conclusion that even if phase separation is occurring in the protein-polysaccharide solution prior to gelation, it may cause a local concentration effect in the gel, but “would not change appreciably the gelation mechanism of the protein.”133
the non-gelling gums propyleneglycol alginate, xanthan and λ-carrageenan, and he found that the addition of each of these polysaccharides allowed the lowering of the BLG critical gelation concentration as well as the gel formation time (at pH 7).64 We are interested in extending this challenge by examining of whey protein-pullulan gelation at acidic pH (pH < IEP of whey protein) in comparison to that at neutral pH, for example.
Durand et al. (2001) analyzed BLG and κ-carrageenan systems undergoing
aggregation and gelation. Similar to what has been observed so far in our preliminary experiments, Durand et al. (2001) concluded that their mixed protein-polysaccharide system experienced micro-phase separation. This micro-phase separation resulted in gel structures that were similar to pure BLG gels at64 high ionic strength and the protein IEP. In this case the gel structure could be influenced by this phase separation. Recently, Cakir et al. further investigated whey protein and κ-carrageenan gels, observing phase separation influence on
gel microstructure.40
Based on these many challenges investigated, we answer some questions specific to the gelation of the pullulan-WP system:
– How does blend ratio concentration impact viscoelastic properties?
– What are limitations for blend gels to form?
– How does pullulan influence gel viscoelasticity?
– Do blend gels have observable microstructure?
– Can blend gels carry a hydrophobic model drug?
– What is the impact of foodsafe additives such as transglutaminase enzyme and
Protein-polysaccharide solutions and gels will be evaluated for the dissertation second goal to demonstrate the value of whey protein-pullulan mixtures for food texture and nutrition enhancement, flavor delivery and for controlled pharmaceutical drug delivery systems, for example.
1.2.5 Pullulan nanofibers
Potential exists to use pullulan to produce non-wovens for surface and food texture modification, drug delivery, tissue scaffolding and wound healing. Moreover these polymers can be electrospun in an environmentally benign way without the use of organic solvents. The ease of modulating the interactions of these polymers in solution by varying pH, using additives or even by blending with a second polymer allows the ability of the construct to carry other molecules such as small molecule drugs or flavorings to be promising.
dumbbells model by Reneker and co-workers for bending instability during electrospinning.136
Previous studies concluded that the solutions, although viscoelastic, have low viscosity due to relatively low molecular weight and relatively high pullulan chain flexibility137, 138 and that solution behavior is primarily viscous.76 Thus, we are specifically interested in (a) better understanding of pullulan aqueous solution, (b) the ability to use food safe modifiers to crosslink nanofibers and (c) effects of process variables such as temperature and pH for product development.
Pullulan is stable at acidic pH of 2 through alkaline pH levels. Evaluating solutions and resultant nanofibers at acidic pH for prolonged shelf life pharmaceutical and food formulation applications is desirable. One pullulan solution modifier we investigate is hydroxypropyl-β-cyclodextrin (HPBCD). Thus, we would be interested in comparing solution characteristics and electrospun nanofiber mats of HPBCD-pullulan aqueous mixtures. The cyclodextrins are water soluble. The interior of the cyclodextrin “cup” has a hydrophobic micro-environment, while the outside of the cup is hydrophilic. They are used in a variety of applications, including pharmaceutical and biomedical.139 Pullulan “protected” by cyclodextrin could serve as an effective drug delivery substrate to better help
Developing, analyzing and crosslinking aqueous solution electrospun pullulan nanofibers is our dissertation third goal. Specific questions to be addressed include the following:
– What is the impact of pullulan concentration on electrospinning?
– Can we crosslink pullulan nanofibers to form a hydrophobic mat?
– What microstructure is observed?
– What is the impact of blending pullulan with cyclodextrin on electrospinning
& fiber crosslinking?
– Can we crosslink blends of pullulan and whey protein?
– What is the impact of pH on pullulan – WP blend electrospinning?
Investigating the ability of pullulan to electrospin is relevant to both food, pharmaceutical and biomedical formulation. Specific uses that have arisen since the start of this work include using pullulan and pullulan-WP blend nanofibers for fine chocolate texture modification as well as for tissue scaffolding and cardiac cell seeding which are anticipated for future work beyond the scope of this dissertation.
1.3 Organization of Dissertation
1.4 References
1. Rulis, A. M. 2002, 1-4.
2. Madureira, A. R.; Pereira, C. I.; Gomes, A. M. P.; Pintado, M. E.; Xavier Malcata, F. Food Research International, 2007, 10, 1197-1211.
3. Ha, E.; Zemel, M. B. The Journal of Nutritional Biochemistry, 2003, 5, 251-258.
4. Fogliano, V.; Vitaglione, P. Molecular Nutrition & Food Research 2005, 3, 256-262.
5. Wolf, B. W.; Garleb, K. A.; Choe, Y. S.; Humphrey, P. M.; Maki, K. C. J. Nutr. 2003, 1051-1055.
6. Frenot, A.; Chronakis, I. S. Current Opinion in Colloid and Interface Science 2003, 64-75.
7. Li, D.; Xia, Y. Advanced Materials 2004, 1151-1170.
8. Taylor, G. Proceedings of the Royal Society of London Series a-Mathematical and Physical Sciences 1969, 1515, 453.
9. Sun, X. -.; Shankar, R.; Börner, H. G.; Ghosh, T. K.; Spontak, R. J. Advanced Materials 2007, 87-91.
11. Li, W.; Laurencin, C. T.; Caterson, E. J.; Tuan, R. S.; Ko, F. K. Journal of Biomedical Materials Research 2002, 613-621.
12. Boudriot, U.; Dersch, R.; Greiner, A.; Wendorff, J. H. Artificial Organs 2006, 10, 785-792.
13. Suk Choi, J.; Sang Yoo, H. Journal of Bioactive and Compatible Polymers 2007, 508-524.
14. Jia, H.; Zhu, G.; Vugrinovich, B.; Kataphinan, W.; Reneker, D. H.; Wang, P. Biotechnol. Prog. 2002, 5, 1027-1032.
15. Xie, J.; Hsieh, Y. Journal of Materials Science 2003, 10, 2125-2133.
16. Nie, H.; He, A.; Zheng, J.; Xu, S.; Li, J.; Han, C. C. Biomacromolecules 2008, 5, 1362-1365.
17. Woerdeman, D. L.; Shenoy, S.; Breger, D. The Journal of Adhesion 2007, 785-798.
18. Dror, Y.; Ziv, T.; Makarov, V.; Wolf, H.; Admon, A.; Zussman, E. Biomacromolecules 2008, 2749-2754.
19. Wongsasulak, S.; Kit, K. M.; McClements, D. J.; Yoovidhya, T.; Weiss, J. Polymer, 2007, 2, 448-457.
21. Jin, H.; Fridrikh, S. V.; Rutledge, G. C.; Kaplan, D. L. Biomacromolecules 2002, 1233-1239.
22. Eissa, A. S. Enzymatic modification of whey protein gels at low pH, North Carolina State University, Raleigh, NC, 2005.
23. Anema, S. G. Food Chemistry, 2008, 1, 110-118.
24. Satpathy, G.; Rosenberg, M. J. Microencapsul. 2003, 2, 227.
25. Euston, S. R.; Ur-Rehman, S.; Costello, G. Food Hydrocolloids 2007, 7, 1081-1091.
26. Ngarize, S.; Adams, A.; Howell, N. Food Hydrocolloids 2005, 6, 984-996.
27. Resch, J. J.; Daubert, C. R.; Foegeding, E. A. Food Hydrocolloids 2005, 5, 851-860.
28. Yamul, D. K.; Lupano, C. E. Food Research International 2005, 511-522.
29. Alting, A. C.; Weijers, M.; deHoog, E. H. A.; vandePijpekamp, A. M.; CohenStuart, M. A.; Hamer, R. J.; deKruif, C. G.; Visschers, R. W. J. Agric. Food Chem. 2004, 3, 623-631.
30. Eissa, A. S.; Bisram, S.; Khan, S. A. Journal of Agriculture and Food Chemistry 2004, 4456-4464.
31. Moon, B.; Mangino, M. E. Milchwissenschaft-Milk Science International 2004, 5-6, 294-297.
33. Ikeda, S. Food Hydrocolloids 2003, 4, 399-406.
34. Eissa, A. S.; Khan, S. Journal of Agricultural and Food Chemistry 2005, 12, 5010-5017.
35. Lowe, L. L.; Foegeding, E. A.; Daubert, C. R. Food Hydrocoll. 2003, 4, 515-522.
36. Chantrapornchai, W.; McClements, D. J. Food Hydrocolloids 2002, 5, 461-466.
37. Chantrapornchai, W.; McClements, D. J. Food Hydrocolloids 2002, 5, 467-476.
38. Ramirez-Suarez, J. C.; Xiong, Y. L. J. Food Sci. 2002, 8, 2885-2891.
39. Britten, M.; Giroux, H. J. Food Hydrocolloids 2001, 609-617.
40. Durand, D.; Le Bon, C.; Croguennoc, P.; Nicolai, T.; Clark, A. H. Aggregation and gelation of globular proteins with and without addition of polysaccharides. In Gums and Stabilisers for the Food Industry 11; Williams, P. A., Phillips, G. O., Eds.; Royal Society of Chemistry: Cambridge, 2001; pp 263-270.
41. Vardhanabhuti, B.; Foegeding, E. A.; McGuffey, M. K.; Daubert, C. R.; Swaisgood, H. E. Food Hydrocoll. 2001, 2, 165-175.
42. Liu, G.; Xiong, Y. L.; Butterfield, D. A. J. Food Sci. 2000, 5, 811-818.
43. Shinya Ikeda, K. N.,E.Allen Foegeding Biopolymers 2000, 2, 109-119.
557-45. Errington, A. D.; Foegeding, E. A. Journal of Agricultural and Food Chemistry 1998, 2963-2967.
46. Verheul, M.; Roefs, S. P. F. M. Food Hydrocolloids 1998, 1, 17-24.
47. Gezimati, J.; Singh, H.; Creamer, L. K. Journal of Agricultural and Food Chemistry 1996, 804-810.
48. Lupano, C. E.; Renzi, L. A.; Romera, V. J. Agric. Food Chem. 1996, 10, 3010-3014.
49. Panyam, D.; Kilara, A. Trends in Food Science & Technology 1996, 4, 120-125.
50. Barbut, S. Food Research International 1995, 5, 437-443.
51. Taylor, S. Food hydrocolloids 1994, 1, 45.
52. Foegeding, E. A. The effect of cations on rheological properties of whey protein gels. In Food Proteins, Structure and Functionality; Schwenke, K. D., Ed.; VCH
Verlagsgesellschaft: Weinheim, Germany, 1993; pp 341-343.
53. Lupano, C. E.; Dumay, E.; Cheftel, J. C. International Journal of Food Science and Technology 1992, 615-628.
54. Stading, M.; A.M., H. Food Hydrocolloids 1991, 339-352.
55. Xiong, Y. L.; Kinsella, J. E. J. Agric. Food Chem. 1990, 10, 1887-1891.
57. Shimada, K.; Cheftel, J. C. Journal of Agricultural and Food Chemistry 1989, 161-168.
58. Shimada, K.; Cheftel, J. C. Journal of Agricultural and Food Chemistry 1988, 1018-1025.
59. Gunasekaran, S.; Xiao, L.; Eleya, M. M. O. J Appl Polym Sci 2006, 5, 2470-2476.
60. Reddy, T. T.; Lavenant, L.; Lefebvre, J.; Renard, D. Biomacromolecules 2006, 1, 323-330.
61. Tavares, C.; Lopes da Silva, J. A. International Dairy Journal 2003, 8, 699-706.
62. Tavares, C.; Monteiro, S. R.; Moreno, N.; Lopes da Silva, J. A. Colloids and Surfaces A: Physicochemical and Engineering Aspects 2005, 213-219.
63. Monteiro, S. R.; Tavares, C.; Evtuguin, D. V.; Moreno, N.; Lopes da Silva, J. A. Biomacromolecules 2005, 3291-3299.
64. Baeza, R.; Gugliotta, L. M.; Pilosof, A. M. R. Colloids and Surfaces B: Biointerfaces Food Colloids, Biopolymers and Materials Special Issue 2003, 1-4, 81-93.
65. Sittikijyothin, W.; Sampaio, P.; Gonçalves, M. P. Food Hydrocolloids 2007, 7, 1046-1055.
66. Ould Eleya, M. M.; Leng, X. J.; Turgeon, S. L. Food Hydrocolloids 2006, 946-951.


![Figure 3.4: Schematics for heat induced structural modifications of BLG for (a) neutral or alkaline medium such as pH 6.8 or (b) at the BLG isoelectric point (IEP) [recreated from Linden et al., 1999]67 with (c) ESEM of WPI:PULL blend gel slice](https://thumb-us.123doks.com/thumbv2/123dok_us/1471399.1180248/146.612.150.484.67.577/figure-schematics-structural-modifications-alkaline-isoelectric-recreated-linden.webp)
