High Temperature Leak Before Break Assessments
Yellowlees S F 1), Hooton D G 1), Sharples J K 1), Budden P J 2) 1) AEA Technology plc, Risley, Warrington, UK
2) British Energy Generation Ltd, Gloucester, UK
ABSTRACT
The use of Leak Before Break (LbB) arguments is well established in the nuclear industry. A 'detectable leakage' LbB procedure, similar to that of NUREG 1061, is commonly used. Such a procedure is included in the UK R6 defect assessment procedures and involves achieving an adequate margin between the evaluated critical crack length and the detectable leakage crack length. However, experience in applying LbB methods with the effects of creep included in the analysis is still limited. This paper contains results of calculations aimed at assessing how these influences impact upon the safety margins achieved in a low temperature application.
It has been demonstrated that the limiting crack length reduces with creep time. This has a detrimental effect when producing a high temperature LbB case. It has also been shown that the length of crack required for a detectable leakage reduces with creep time, the effect being most noticeable for long creep times. This has a beneficial effect when producing a high temperature LbB case.
INTRODUCTION
A Leak Before Break (LbB) argument is aimed at demonstrating, using fracture mechanics and thermal hydraulic principles, that leakage of an appropriate gas or fluid, through a crack in the wall of a pipe or pressure vessel, can be detected before the crack becomes unstable and rapid crack extension occurs. The R6 defect assessment procedure [1] provides two methodologies for conducting a LbB analysis:
(i) In the full LbB procedure, a surface defect is characterised and the effects of crack shape development are assessed as the crack grows through the wall of the pressure vessel. Thus, the length of the defect at breakthrough can be evaluated. The time to grow the resulting through wall defect to the limiting crack size is then calculated. The minimum length of crack from which leakage could be detected is calculated and compared with the breakthrough and limiting crack lengths. The time to grow from the detectable leakage crack size to the limiting crack size is compared with the time required to detect the leakage. The time to failure by continuum damage must also be considered when creep effects are included in the calculation.
(ii) In the ‘detectable leakage’ procedure, the effects of crack growth are ignored and only leakage crack and limiting crack lengths are calculated. The minimum length of crack from which leakage could be detected is compared with the limiting crack length. The effects of temperature must be included in both these calculations when appropriate. A detectable leakage case has been made if there is suitable margin between the limiting crack length and the leakage crack length.
This paper considers the application of the ‘detectable leakage’ procedure to a circumferential crack in a cylinder containing gas (CO2) at 550oC. A time-dependent failure assessment diagram has been used in the calculation of the limiting crack length, following the methodology contained in the UK R5 high temperature assessment procedure [2]. This technique includes the effect of limited amounts of creep crack growth using a suitable choice of material properties. The crack opening area has been evaluated by incorporating creep effects following the advice given in the R6 LbB procedures [1].
METHODOLOGY
Crack Opening Area (COA)
If through-wall bending stresses are absent, or can be ignored, the following equation [1] gives a lower bound approximation for the COA, Ae, in a cylinder when creep effects are ignored.
( )
' Ea 2 A
2 m e
πσ λ α =
(1)
where a is the half crack length, σm is the stress perpendicular to the crack and the α term is a correction to allow for bulging.
SMiRT 16, Washington DC, August 2001 Paper # 1769
Also,
strain plane for -1
E E'
stress plane for E ' E
2
ν =
= (2a)
(2b)
where E is Young’s modulus and ν is Poisson’s ratio. For a circumferential crack in a cylinder,
( )
(
)
21 2 117 . 0
1+ λ
= λ
α (3)
The shell parameter, λ, is given by,
(
)
(
)
rT a 1
12 4
1 2
ν − =
λ (4)
where r is the mean radius and T is the wall thickness.
It is acknowledged that there are more accurate expressions available for the calculation of COA e.g. [3]. However, for simplicity, only Eq. 1 has been considered in this work, and its use will have no effect on the conclusions.
The effects of temperature are included by considering the increase in COA due to creep. This is assessed using the following expression [1],
e c e c A A
ε ε
= &
& (5)
where A&cis the rate of change of the COA due to creep, defined in terms of the elastic COA, Ae, as defined by Eq.1 and the creep strain rate, ε&c, and the elastic strain, εe.
In these calculations, only steady state secondary creep conditions are considered. The creep strain rate (1/hr) can therefore be described by the Norton Law,
n ref c =Cσ
ε& (6)
where C and n are material constants and solutions for the limit load reference stress, σref, can be found in various handbooks e.g. [4].
The total COA at time ‘t’ is then given by,
[
1 CE t]
Adt A A ) t (
A n1
ref e
t o
c e
− σ + = +
=
∫
& (7)Leakage Rate
The calculation of flow through a crack is, in general, a complex problem. The effects of crack geometry, flow path length, friction and thermodynamics of the flow must all be considered. Several computer codes are available to assist in these calculations [5], [6]. However, to provide a complete description of the LbB assessment procedure, the expressions provided by Sharples and Clarke [7] are presented which assume the flow to be single phase. It should be noted that these expressions are included in the computer codes [5], [6].
Assuming a rectangular crack opening profile, the crack opening width, Wc, is given by,
a 2 A
Wc = (8)
2
a c
5 . 2 R
W 2 log 5 . 4 f
−
−
= (9)
Suggested values for the surface roughness, Ra, are provided in the R6 documentation [1]. A further non-dimensional quantity, F, is then given by,
c W
D f
F= (10)
where D is the crack depth, equal in this case to the wall thickness, T.
To calculate the discharge coefficient, CD, choked flow conditions are assumed. By assuming choked flow conditions, lower flow rates will be calculated than if non-choked conditions were assumed. The difference is only slight [7] and use of the former is conservative. For a through-wall crack with equal entry and exit COAs,
( )
21 D
F 2 1
1 C
+
= (11)
The leakage mass flow rate is then given by,
( )
21 c DW aP C 2
m& = ρ (12)
where P is the fluid pressure and ρ is the fluid density. From Eq.7, Eq.8 and Eq.12 the crack length required to produce a given leakage mass flow rate at a given creep time and pressure loading is given by,
( )
P C( )
P A[
1 CE t]
A C
m 2 e nref1
1 D 2 1 D
− σ + ρ
= ρ =
& (13)
Limiting Crack Length
The main procedures contained within R6 [1] provide guidance on the calculation of a critical crack length, when creep effects are insignificant. Essentially, the R6 procedure requires the calculation of two parameters, Lr and Kr, which describe the proximity to failure by plastic collapse and fracture respectively. For given values of Lr and Kr, failure is conceded when the calculated values lie outwith the confines of the failure assessment curve, plotted on a failure assessment diagram. It should be noted that no factors of safety are specified in the R6 procedure. However, in order to assess the effect of creep on safety margins in LbB assessments, this study includes a factor of safety on the critical crack size and the resultant crack size is termed the limiting crack size.
There are three levels of failure assessment curve, representing increasing levels of detail in their definition. The Option 1 failure assessment curve is a general curve which is conservative for all materials which do not exhibit a yield discontinuity in the stress-strain curve. The Option 2 failure assessment curve is material specific and is defined from the material stress-strain curve. The Option 3 failure assessment curve is the most detailed and requires inelastic fracture mechanics calculations for various levels of primary loading. The Option 3 failure assessment curve is therefore specific to the material and geometry being analysed.
When temperature effects are important, the R5 procedure [2] provides a procedure, similar to the R6 calculation of critical crack length, known as the Time Dependent Failure Assessment Diagram (TDFAD). The principle of a failure assessment diagram is retained and the required parameters are still Lr and Kr. A material specific failure assessment curve is used, comparable with the R6 Option 2 failure assessment curve but defined using the isochronous stress-strain curve at the required temperature and assessment time. The calculations of the Lr and Kr parameters also include the effects of time and temperature upon the material yield stress and fracture toughness respectively. The TDFAD approach provides assessment against failure by initiation of crack growth and continuum damage.
When only primary stresses are considered, the Kr parameter is given by,
c mat
P I r
K K
where the stress intensity factor, K , may be taken from standard handbook solutions, e.g. [8], and PI c mat
K is the time-dependent fracture toughness.
The Lr parameter is given by the following expression with the lower bound yield stress for conservatism,
c 2 . 0 ref r L
σ σ
= (15)
Equations for the reference stress, σref, are provided in various handbooks, e.g. [4]. The reference stress provided in the handbooks for a circumferential crack is usually an axial stress. In some cases (i.e. for small cracks), it is possible for the circumferential stress from the uncracked section of the cylinder to exceed this value. In these cases, the reference stress in Eq.15 is based on the hoop stress.
The failure assessment curve is described by the following expression using average material properties.
2 1
ref c
2 . 0 3
r c
2 . 0 r
ref r
E 2 L L
E K
−
ε σ + σ ε
= (16)
where εref is the total strain from the isochronous stress-strain curve at the reference stress, σref.
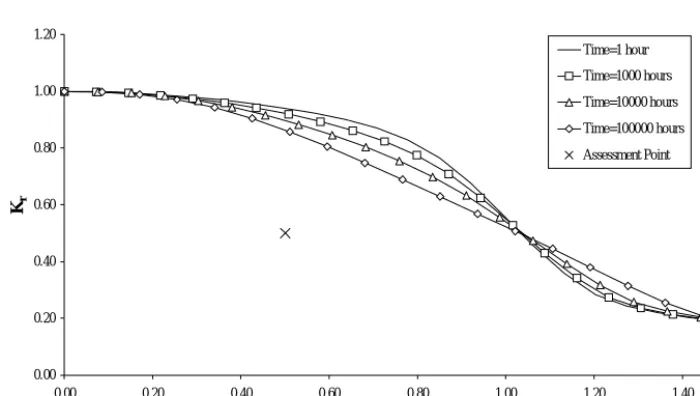
The constructed time dependent failure assessment diagram (TDFAD) for 316L(N) material is presented in Fig.1 from which the critical crack length, acrit(t) at time t could be evaluated.
0.00 0.20 0.40 0.60 0.80 1.00 1.20
0.00 0.20 0.40 0.60 0.80 1.00 1.20 1.40
Lr Kr
Time=1 hour Time=1000 hours Time=10000 hours Time=100000 hours Assessment Point
Fig. 1 Time Dependent Failure Assessment Diagram
Safety factors, (SF)c and (SF)L were applied as follows,
( )
( )
( )
c crit c
SF t a t
a = (17)
so that the resulting limiting crack length ac
( )
t could be calculated. Also,( ) ( )L
dSF m t
m& = & (18)
GEOMETRY AND LOADING
The calculations contained in this paper are concerned with a cylinder containing a circumferential through-wall crack. The cylinder studied has a mean radius of 190.15mm and a wall thickness of 24.8mm. A surface roughness, Ra, of 8.1µm was assumed.
Only pressure loading has been studied, being applied internally to the cylinder. Two load levels were considered; normal operating pressure and upset pressure. The upset pressure was assumed to be 20% higher than the normal operating pressure. For conservatism, the upset pressure was used in the calculation of the limiting crack whereas the normal operating pressure was used in the calculation of leakage, as specified in the LbB procedure of R6 [1]. This minimises the limiting crack length while maximising the length of crack required for a detectable leakage.
The temperature assumed in the high-temperature calculations is 550OC. No fatigue effects have been considered. MATERIAL PROPERTIES
The material used in this analysis is 316L(N) stainless steel. Young’s modulus at 550oC has been taken as 149230MPa [9]. Poisson’s ratio has been taken as 0.3. The isochronous stress-strain curves and the creep rupture data were taken from Appendix A3.1S of [9]. The constants in the steady state creep law, Eq.6, were given as C=5.29x10⁻²⁶ and n=8.20 at 550oC [9].
The relationship for the fracture toughness has been derived in terms of the assessment time using experimental data at 550oC [10],
1 for t 5 . 137 K
1 for t t 5 . 137 K
c mat
15 1 c
mat
< =
>
= − (19)
The density, ρ1, at atmospheric pressure P1 and 550oC of the gas in the cylinder (CO2) has been taken as 0.9835 kg/m3 [11]. The gas is assumed to behave like a perfect gas and the density, ρx, at higher pressures, Px, is calculated using the following expression,
x x 1 1 P P
ρ =
ρ (20)
RESULTS AND DISCUSSION
Non-Time-Dependent Assessment
Initially, the assessment was carried out by ignoring the effects of creep in the calculation of the leakage rate and the limiting crack length, but the material properties used in the analysis were evaluated at the elevated temperature (550OC). The detectable leakage mass flowrate, m&d, was assumed to be 0.03 kg/s.
The safety factors (see Eq.17 and Eq.18) were assumed to be (SF)c=2.0 and (SF)L=2.0. With these safety factors, the corresponding normal operating pressure was 10.625 MPa and the upset pressure was 12.75 MPa (i.e. 1.2 x normal operating pressure).
Using the upset pressure of 12.75 MPa, the limiting crack length, without any safety factor (i.e. the critical crack length), was 0.17m. Including a safety factor of two on crack length, the limiting crack length, ac, becomes 0.085m. Using the normal operating pressure of 10.625 MPa, the length of crack which produces a leakage flowrate of 0.03 kg/s is 0.07m. Including a safety factor of two on mass flowrate so that the detectable leakage mass flowrate becomes 0.06 kg/s, the leakage crack length, aL, becomes 0.085m. Thus, with these safety factors applied, there is a reserve factor of unity between the detectable and leakage crack sizes, i.e. no margin. It should be noted that, while the critical crack length can be scaled linearly with the chosen safety factor, the crack length to produce a given leakage mass flowrate cannot when the factor of safety is applied to the mass flowrate.
The COA required to produce 0.06 kg/s leakage mass flowrate, that is, including the safety factor of 2, was calculated to be 1.445x10⁻⁵ m2.
Time-Dependent Assessment
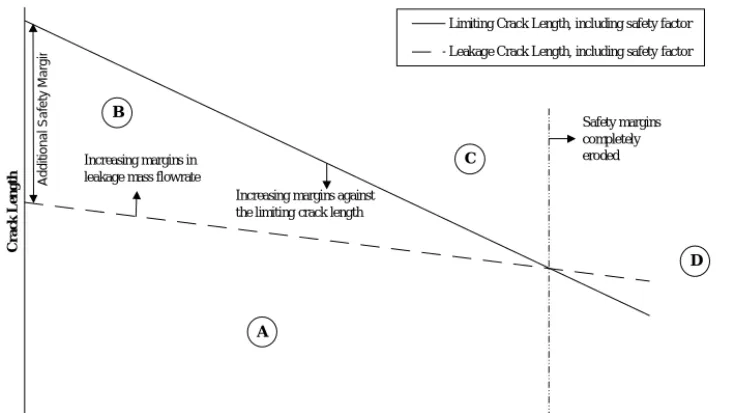
that compares the changes, with creep time, in the limiting crack length, and the length of crack required to produce a detectable leakage rate. The general features of this chart are illustrated in Fig. 2.
Creep Time
Crack Length
Limiting Crack Length, including safety factor Leakage Crack Length, including safety factor
Increasing margins in leakage mass flowrate
Increasing margins against the limiting crack length
Safety margins completely eroded
Additional Safety Margi
n
A B
C
D
Fig. 2 Schematic Presentation of Safety Margins
It can be seen from Fig. 2 that the limiting length of crack would be expected to reduce with creep time. This is caused by the effect of temperature on the material stress-strain behaviour and the fracture toughness. The length of crack required for leakage to be detectable would also be expected to reduce with time but perhaps at a different rate to the limiting crack size. Additional safety margins, beyond those included as the minimum acceptable during the calculation of the two curves, only exist when the detectable leakage crack length is less than the limiting crack length. When the curves cross, insufficient margins exist thereafter. This can be summarised by Fig. 2 and the following table:
Table 1 Presentation Of Safety Margins
Region On Fig. 2
Comment LbB Case
(Yes/No) A The crack length shows sufficient margins against the limiting crack length, but
leakage would not be detectable.
No
B A suitable margin is presented against leakage detection and limiting crack length.
Yes
C The crack length is sufficient to provide leakage well in excess of the detectable level but exceeds the limiting crack length.
No
D The limiting crack length is less than the crack length from which leakage can be detected.
No
It should be noted that R6[1] does not provide values for the safety margins discussed above. The safety margins should be chosen to suit the particular situation.
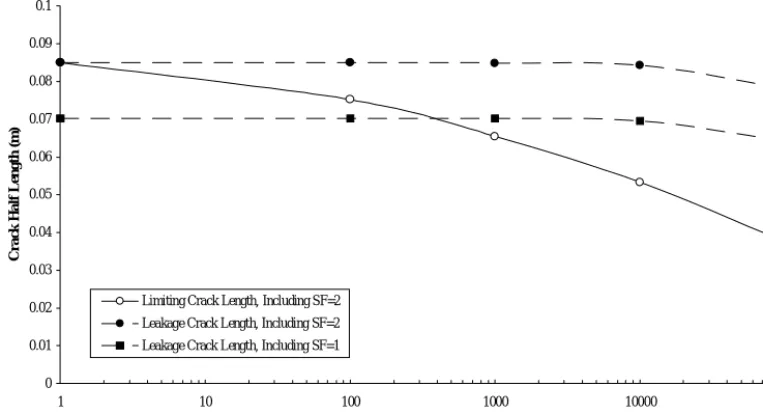
For the cylinder being assessed, with creep at 550OC, the corresponding chart is provided in Fig. 3. The assessment was first carried out with a safety factor of two applied to both the critical crack length and the detectable leakage rate. This corresponds to the maximum attainable safety margins demonstrated by the non-time-dependent assessment. This is shown by the coincidence of the two curves on the crack length-axis of Fig. 3. It is apparent that a high temperature LbB justification is not possible, with these safety factors applied, since, after 1 hour creep time, the limiting defect length is less than the crack length required for a detectable leakage.
Fig. 3 also demonstrates that the calculations are dominated by the reduction in the limiting crack length with creep time. The effect on the leakage crack length is small and is limited to large creep times. This supports the findings of Budden and Hooton [12] who stated that the increase in COA due to creep can be conservatively ignored in a high temperature LbB assessment.
0 0.01 0.02 0.03 0.04 0.05 0.06 0.07 0.08 0.09 0.1
1 10 100 1000 10000 100000
Creep Time (Hours)
Crack Half Length (m)
Limiting Crack Length, Including SF=2 Leakage Crack Length, Including SF=2 Leakage Crack Length, Including SF=1
Fig. 3 Assessment Of Creep Effects
CONCLUSIONS
(i) The methodology for conducting a ‘detectable leakage’ high temperature LbB assessment using the time dependent failure assessment diagram has been presented.
(ii) It has been demonstrated that the length of crack required for detectable leakage reduces with creep time, the effect being most noticeable for long creep times. This has a beneficial effect when producing a high temperature LbB case.
(iii) It has been demonstrated that the limiting crack length reduces with creep time. This has a detrimental effect when producing a high temperature LbB case.
(iv) The margins between the limiting crack length and the detectable leakage crack length are reduced when creep effects are introduced. Large margins will therefore be required in a non-time-dependent LbB case before a high temperature LbB justification will be possible.
(v) A diagrammatic approach has been presented which allows the margins between the limiting crack length and
the detectable leakage crack length, and the feasibility of a LbB case, to be readily assessed for different creep times.NOMENCLATURE
a = Half-length of through-wall crack (m) ac = Limiting crack half-length (m) acrit = Critical crack half-length (m) aL = Leakage crack half-length (m)
c
A& = Rate of change of crack opening area, creep only (m2/hour)
Ae = Elastic crack opening area, ignoring creep (m2) C = Material creep constant
CD = Discharge coefficient
D = Depth of crack (m) [Equal to wall thickness, T]
E = Young’s modulus (MPa)
f = Fanning friction factor
F = Non-dimensional friction factor c
mat
P I
K = Stress intensity factor due to primary loading
(
MPa m)
m& = Mass flow rate (kg/s)
d
m& = Detectable mass flow rate (kg/s)
n = Material creep constant P = Fluid pressure (Pa)
r = Mean radius of cylinder (m)
(SF)c = Safety factor on the critical crack length (SF)L = Safety factor on the leakage mass flow rate t = Assessment time (hours)
T = Wall thickness of cylinder (m) Wc = Crack opening width (m)
εe = Elastic strain at the reference stress, σref. c
ε& = Creep strain rate (1/hour)
ref
ε = Total strain taken from the isochronous stress-strain curve at σref
ν = Poisson’s ratio
ρ = Fluid density (kg/m3) c
2 . 0
σ = 0.2% proof stress taken from the isochronous stress-strain curve (MPa)
σf = Material flow stress (MPa)
σm = Stress acting perpendicular to the crack (MPa)
σref = Reference stress (MPa)
REFERENCES
1. Milne I, Ainsworth R A, Dowling A R and Stewart A T, Assessment of the Integrity of Structures containing Defects, Nuclear Electric Report R/H/R6, Revision 3 with updates to June 2000.
2. Ainsworth R A, Hales R, Budden P J, Martin D C, Assessment Procedure for the High Temperature Response of
Structures, British Energy plc, Assessment Procedure R5 Issue 2, Revision 2 with updates up to January 2001.
3. France C C, Green D, Sharples J K and Chivers T C, “New Stress Intensity Factor and Crack Opening Area Solutions for Through-Wall Cracks in Pipes and Cylinders”, ASME Pressure Vessels and Piping, PVP – Vol 350, Fatigue and Fracture: 1997.
4. Miller A G, Review of Limit Loads of Structures Containing Defects, Int J Pres Ves Piping, 32, 191-327, 1988. 5. George A F, Rich J I, Mitchell D H and Ewing D J F, DAFTCAT User Guide, Nuclear Electric plc Report,
TD/SID/REP/0055, 1990.
6. Paul D D, Ahmed J, Scott P M, Flanigan L F and Wilkowski G M, Evaluation and refinement of leak-rate estimate
models: Topical Report, NUREG/CR-5128 Rev 1, 1994.
7. Sharples J K and Clarke P W, HSE sponsored nuclear safety research programme, GNSR SUB – Programme, Milestone
Report: Background to leakage guidance given for leak-before-break assessments, AEA/RS/4227, 1992.
8. Murakami Y et al, Stress Intensity Factors Handbook, Pergamon Press, 1987.
9. Design and Construction Rules For Mechanical Components of FBR Nuclear Islands RCC-MR, Section I – Subsection Z:
Technical Appendix A3, June 1985 Edition.
10. Hooton D G, Green D and Ainsworth R A, “An R6 type approach for the assessment of creep crack growth initiation in stainless steel test specimens”, ASME PVP Conference, Minneapolis, 1994, Vol 287, pp129-136.
11. Rogers G F C and Mayhew Y R, Thermodynamic and Transport Properties of Fluids, SI Units, Fourth Edition, Blackwell Publishers, Oxford, 1980.
12. Budden P J and Hooton D G, “Margins in High Temperature Leak-Before-Break Assessments”, LBB 95, Lyon – France, Specialist Meeting on Leak Before Break in Reactor Piping and Vessels, October 1995. Proceedings available in NUREG/CP-0155 (1997).
ACKNOWLEDGEMENTS