Racial and ethnic group spatial assimilation in inner and outer
suburban rings
Grigoris Argeros, Ph.D.
Assistant Professor of Sociology
Department of Sociology, Anthropology, & Criminology
Eastern Michigan University
712 Pray Harrold
Ypsilanti, MI 48197
Tel.: 734.487.0456
ABSTRACT
The present study examines inner and outer suburban ring attainment outcomes among
racial and ethnic groups residing in the nation’s metropolitan areas. The main objective is to
evaluate the extent to which the relationship between racial and ethnic group’s socioeconomic
status characteristics and residence between inner and outer suburban rings conforms to the
tenets of the spatial assimilation model. Using micro-level data from the 5-year 2012-2016
American Community Survey, the author calculates multinomial logistic regression models to
determine the effects of SES and other relevant predictors on residence within the nation’s
metropolitan area’s suburban inner and outer rings. The results both confirm and contradict the
main tenets of the spatial assimilation model. To the extent that income, education, and
homeownership are positively related to residence in both suburban rings, the findings also
suggest that access to inner and outer rings is hierarchically stratified by race and ethnicity.
Keywords
INTRODUCTION
A common theme echoed in racial and ethnic locational attainment studies is that
residence in the suburbs is a function of socioeconomic status (SES) attainments (Alba et al.
1999; Alba and Nee 2003; Farrell 2016; Logan and Alba 1993; Logan et al. 1996). This process,
as outlined by the spatial assimilation model, suggests that increments in racial and ethnic
groups’ income and educational levels translate into residence in higher income suburban
neighborhoods with qualitatively more desirable resources (Alba and Nee 1997; Massey 1985;
Massey and Mullan 1985. Residence in qualitatively more desirable suburbs can have a positive
impact on one’s socioeconomic well-being, socio-psychological outcomes, life chances, and
overall quality of life (Coley et al. 2013; Evans et al. 2000; Sampson 2012; Schaefer-McDaniel
et al. 2009, Sampson, Morenoff, and Gannon-Rowley 2002). To the extent that suburbs have
traditionally represented the quintessential type of residence, as epitomized in the “American
Dream” throughout most of the twentieth century (Kneebone and Berube 2013), recent research,
however, has questioned the presumed superiority of the suburbs, in terms of offering its
residents qualitatively more desirable amenities, resources, and opportunities relative to those
found in central-cities (Anacker 2015; Gallagher 2013; Hanlon 2010; Kneebone and Berube
2013).
A series of sociodemographic, economic, and structural intersecting processes since the
late twentieth century have shaped and altered the composition of suburbs in the twenty-first
century (Allard 2017; Anacker 2015). As a result, suburbs are “no longer places with high
proportions of home-owning non-Hispanic whites and native born with relatively high household
incomes, high levels of education, and without any problems” (Anacker 2015, p. 1). In addition
ethnicity, immigration, and citizenship status (Frey 2015). For the firsts time, the 2010 decennial
census revealed that the majority of blacks, Asians, and Hispanics in the U.S. resided in the
suburbs, as well as the majority of the foreign-born in the nation’s top 100 largest metropolitan
areas lived in their respective suburbs as well (Frey 2015; Wilson and Singer 2011). Along with
increasing crime rates and a deteriorating and aging housing stock, the first two decades of the
twenty-first century also reveals that the number of poor residents living in the suburbs has
surpassed those living in central-cities1 (Allard 2017; Kneebone and Berube 2013).
To the extent that socioeconomic and structural changes have altered the compositional
background of suburbia as a whole, a key feature of such changes pertains to differences between
suburbs closer to the central-city (inner rings) and outer suburban rings (Hudnut 2003; Lucy and
Philips 2006; Anacker 2015; Hanlon 2010; Short et al. 2007). Since the 1990s, inner suburban
rings are more likely to have experienced significant increases in poverty (Hanlon and Vicino
2007; Leigh and Nee 2005), declining income levels (Holliday and Dwyer 2009), population
fluctuations (Leigh and Lee 2005), increasing rates of income segregation (Swanstrom et al.
2004), and a rising share of an aging housing stock relative to their outer-ring counterparts (Lee
and Leigh 2007; Hanlon 2010; Puentes and Orfield 2012). Housing market dynamics, labor
market restructuring, and metropolitan political fragmentation also add to the list of forces
shaping changes within suburbia and further solidifying the socioeconomic bifurcation between
suburbia’s inner and outer rings (Hanlon 2010). The above changes challenge the main tenets of
the spatial assimilation model, in term of its ability to describe the process by which racial and
The study’s main goal is to examine racial and ethnic group differences in suburban
attainment outcomes between their inner and outer rings residing within the nation’s
metropolitan areas. Using up-to-date individual-level data, the study adds to the literature on
racial and ethnic group locational attainment outcomes by re-evaluating the applicability of the
spatial assimilation model in relation to its key component, i.e. residence in the suburbs. While
the spatial assimilation model has successfully described the process by which racial and ethnic
groups translate their SES background characteristics into suburban outcomes throughout most
of the twentieth century (Alba and Nee 2003), less is known, however, on the extent to which the
model can accurately describe process by which groups residentially settle between suburbia’s
inner and outer rings.
THEORETICAL BACKGROUND & HYPOTHESES
The spatial assimilation model has traditionally served as the main theoretical model used
to describe the relationship between racial and ethnic groups’ SES attainment levels and
suburban outcomes (Logan and Alba 1993; Alba and Logan 1993). Having its origins from the
assimilation theories of Milton Gordon (1964), the spatial assimilation model links residential
mobility with elements of status attainment theory in order explain the process by which racial
and ethnic group members attain residence in suburban neighborhoods, especially those with
higher income levels and where the majority group, i.e. non-Hispanics, reside (Massey 1985;
Massey and Mullan 1984). The model suggests that residence in qualitatively more desirable
suburban locations is a function of a group’s individual-level SES levels, and acculturation
On average, the spatial assimilation model has successfully explained the relationship
between SES attainments, acculturation characteristics, and suburban outcomes for the majority
of white, Asian, and to a lesser extent for Hispanic households (Alba and Nee 2003; Rosenbaum
and Friedman 2007; Logan et al., 1996; Woldoff 2008). Household income and educational
levels, including length of time spent in the U.S. and English language fluency levels, are
positively related to residence in mostly white, suburban, high-income neighborhoods (Alba and
Nee 2003; Rosenbaum and Friedman 2007). On the other hand, the spatial assimilation model
fails to predict blacks’ suburban outcomes relative to whites, who are more likely to reside in
lower quality neighborhoods and poorer suburbs relative to whites, even when controlling for
SES (Alba and Logan 1991, 1993; Charles 2003; Rosenbaum 1996).
While traditional applications of the spatial assimilation model have examined the
process by which groups (minorities or immigrants) move from central-cities to suburbs, in the
present study, however, the model is used to describe the process by which groups attain a
suburban outcome within its inner or outer rings. As stated earlier, socioeconomic, demographic,
and structural changes within suburbia pose challenges to the spatial assimilation model’s key
outcome, i.e. residence in suburban locations. In addition to increasing poverty and crime rates,
inner suburban rings also are experiencing rapid population growth and diversity in terms of
race, ethnicity, and immigration compared to their outer ring counterparts. Inner suburban rings
also have a higher share older and aging housing stock built during the 1950s and 1960s, relative
to the newer housing developments as found in the outer-suburban rings (Hanlon 2010; Puentes
and Orfield 2012). To the extent that outer suburban rings have higher income levels and are in a
a function of each racial and ethnic group’s SES, and acculturation, characteristics. Therefore, it
hypothesized that differences in each racial and ethnic group’s ability to convert their
individual-level SES characteristics into residence in suburban outer rings relative to their inner ring
counterparts is expected to decrease or disappear once controlling for SES, and the remaining
theoretically relevant variables. To the extent that differences remain, it is expected that white,
Asian, and to a lesser extent Hispanic, households, to be more likely to reside in the outer-rings
than black households, even when controlling for SES levels.
The spatial assimilation model’s applicability to blacks has been questioned due to the
persistent significance of black race in U.S. society (Alba and Nee 2003; Charles 2003; Friedman
and Rosenbaum 2005; Rosenbaum and Friedman 2007; Sharkey 2013; Wilkes and Iceland
2004). Race appears to be the most prominent factor relegating blacks to lower quality suburban
neighborhoods compared to other racial/ethnic groups. It appears that for blacks, the penalty of
race supersedes other factors that are highly valued in U.S. society such as education. It should
be mentioned though that when education does play a role for blacks’ entrance into higher
quality suburban neighborhoods, it does so in a way in which they have to climb a higher wall
(once they are allowed to climb it in the first place) in order to reside in neighborhoods
proportionate to their SES levels (Adelman et al. 2001; Logan and Alba 1993; Logan, Alba,
Leung 1996; Rosenbaum and Friedman 2007). On the other hand, there is the possibility that
black households’ likelihood of residing in the outer suburban rings will be, at minimum, similar
to those of other racial and ethnic groups, as suggested by the housing availability model
(Pfeiffer 2016).
The housing availability model provides clues on the processes by which black
Crowder 1998; Pfeiffer 2016; 2012). Borrowing elements from the spatial assimilation model
and ecological aspects of the broader metropolitan area, the housing availability model suggests
that the likelihood of residing in the outer suburban rings among black and other non-white
groups may be higher following the passage of the 1968 Fair Housing Act. Declines in housing
discrimination for housing built in the outer ring suburbs following the enactment of Fair
Housing Act, along with the increase in white group tolerance to residing in neighborhoods with
a higher share of nonwhites, has significantly minimized the barriers to which non-white groups,
especially black households, encounter as they seek to translate their SES levels into residence in
such places (Pfeiffer 2016). To the extent that residential segregation indices provide a general
overview of the degree of social and spatial distance between racial and ethnic groups, then
minorities may face weaker barriers to residential proximity with majority group members in
outer-suburban rings than in inner-suburban rings and central cities (Anacker et al. 2017).
Anacker et al. (2017) found that white-black residential segregation, as evinced by the index of
dissimilarity, was lower in outer-suburban rings, i.e. those suburbs where the majority of housing
was built after 1970, than their inner-ring counterparts, i.e. where the majority of suburban
housing was built before 1970, including central-cities. This suggest a growing tolerance for
racial and ethnic diversity in the former than the latter two locations, “where competition is
intense, racial segregation patterns are entrenched, and poorer communities nearby” (Pfeiffer
2016, p. 801). Therefore, the housing availability model suggests that white and non-white
household differences in the likelihood of residing in the outer-suburban rings will be smaller
than those in suburban inner-rings, net of differences in SES, acculturation characteristics, and
Previous research reveals mixed results on the degree to which the housing availability
model can describe black suburbanization outcomes in the outer versus the inner rings.
Consistent with the model, Pfeiffer (2016) finds that non-white groups, e.g. African-Americans,
residing in suburban neighborhoods where its housing was built after the Fair Housing Act
experienced better neighborhood conditions and greater racial equity, than those residing in
central cities and inner-suburban rings. In a case study of the Los Angeles region, the same
author finds limited support for the housing availability model in that differences in
neighborhoods conditions among racial groups with similar income is smaller among those
residing in the outer-suburban rings of the Los Angeles metropolitan area than those residing in
the inner city or its nearby suburbs (Pfeiffer (2012). While not focusing on the residential
attainment differences between inner and outer suburban rings, Timberlake et al. (2011),
however, find that the impact of housing growth on blacks’ suburbanization was the weakest
relative to the effect on whites, Asians, and Hispanics. Therefore, it appears that for blacks, and
other darker skin groups, the penalty of race supersedes other factors that are highly valued in
U.S. society, such as education and income (Charles 2003).
The place stratification model posits that race, prejudice and other forms of institutional
discrimination, such as actions by the real estate and mortgage lending industries, appear to be
the dominant force behind the suburban attainment patterns for specific non-white groups,
especially for blacks and black Hispanics, net of differences in socioeconomic status (Alba and
Logan 1993; Logan and Molotch 1987). According to this model, racial/ethnic groups and places
are hierarchically ordered where the most advantaged group, i.e., whites seeks to distance
themselves from less advantaged groups, i.e. non-whites (Logan and Molotch 1987). The ways
institutional acts of discrimination towards prospective minority homeseekers or renters, such as
the negative treatment from financial lending institutions, landlords, real estate agents, and
actions of neighborhood associations that seek to exclude minorities from buying homes in
predominantly white neighborhoods (Yinger 1995). Although the 1968 Fair Housing Act
essentially eliminated overt acts of housing discrimination on the basis of race and ethnicity;
nonetheless such acts have become subtler whose effect is to channel minority households to
lower quality neighborhoods (Turner et al. 2002).
Blacks and Hispanics are more likely to encounter discrimination, relative to comparable
whites, during the entire housing transaction process, such as being denied information about the
availability of houses or apartments, the opportunity to inspect housing units, the lack of
assistance with mortgage financing from real estate agents, as well as being geographically
steered towards certain neighborhoods, especially those with larger share of Hispanics and
blacks (Turner and Ross 2005:86; Turner et al. 2013). On average, the most common causes of
subtle forms of discrimination against minority households are real estate agents’ and white
customers’ prejudice which serve to channel minorities to predominantly non-white
neighborhoods (Oh and Yinger 2015; Rothstein 2017). All of the above actions serve to produce
suburban outcomes that vary by racial and ethnic origin. Non-Hispanic whites, on average, have
the highest probability of residing in the suburbs followed by non-Hispanic Asians, Hispanics,
and non-Hispanic blacks, even when controlling for differences in SES and acculturation status
(Alba and Logan 1991; Alba and Loga 1993; Charles 2003; Logan and Alba 1993; Rosenbaum
1996). Accordingly, it is expected that racial and ethnic differences in the odds of residing in the
controls for SES, acculturation characteristics, family/household status, and the region of where
each group resides.
DATA AND METHODS
The main data source used is 5-year 2012-2016 American Community Survey (ACS)
sample extracted from the Integrated Public Use Microdata Series (IPUMS) (Ruggles et al.
2018). Contrary to aggregate-level data of the decennial census, the ACS consists of
individual-level socioeconomic, demographic, and family/household data for various racial and ethnic
groups in the U.S. Despite the dataset’s limitations, such as its cross-sectional nature, its inability
to account for undocumented immigrants (Capps et al. 2018), and undercount of certain racial
and ethnic groups, such as blacks (U.S. Census Bureau 2012), the ACS has been widely used in
past and present research investigating racial and ethnic group locational attainment outcomes
(Alba and Logan 1991, 1993; Farrell and Firebaugh 2016; Crowell and Fossett 2017; Walker
2017). The sample2 is limited to non-Hispanic white, non-Hispanic black, non-Hispanic Asian3,
and Hispanic head of households4 who are between 25 and 64 years old. Following previous
research, each racial and ethnic group is limited to 10,000 cases to avoid differences in group
size from influencing the results (Logan and Alba 1993; Alba and Logan 1993).
2The group quarter population, which includes the institutionalized population residing in places such as
dormitories, military, or other group living arrangements, are excluded.
3 Hereafter referred to as “white”, “black”, “Asian” unless otherwise noted.
4 The process of choosing where to live entails a complex set of decisions on behalf of households, which evolve
The dependent variable differentiates between a suburb’s inner and outer rings5.
Following Anacker et al. (2017) and Hanlon (2010), the year in which each housing structure
was built is used to identify each respective suburban ring. The first stage in creating the
dependent variable involves identifying households located in a non-metropolitan or
metropolitan area, followed by distinguishing the latter category between those residing inside or
outside the metropolitan area’s central city6. This resulted in the creation of the familiar
central-city/outside of central city, i.e. suburbs, dichotomy variable which has been extensively used in
locational attainment research (Massey and Denton 1988; Frey and Speare 1988; Friedman and
Rosenbaum 2005)7. The sample is then restricted to only suburban locations. The second stage
differentiates between suburban inner and outer rings. Inner suburban rings are defined as those
where the majority of housing was built in 1969 or earlier, and outer suburban rings as those
whose housing was built in 1970 or later (Anacker et al. 2017; Hanlon, 2009; Lucy & Phillips,
2000, 2006).
The predictors are similar to those used in previous studies and are grouped into four
categories, namely socioeconomic status (SES), acculturation, family/household status, and the
region of where each group resides (Alba and Logan 1991; Logan and Alba 1993; Rosenbaum
and Friedman 2004). The variables used to tap into the measurement of SES are: household
5 While other labels have been used to describe such locations, e.g. mature and developed suburbs, the issues they
face remain the same (Anacker 2015).
6 Metropolitan area definitions vary by each decennial census, due to population and boundary shifts. As a result,
there is an inevitable loss of geographic area, especially those areas not identifiable or not located within a metropolitan statistical area. Only those individuals located within a designated metropolitan area and residing outside central-cities (henceforth referred to as “suburb”) are included in the analysis.
7 Identifying suburban locations in such a manner, however, raises two limitations. Firstly, suburban locations with
income, an ordinal variable measuring income in increments of $20,000, and educational
attainment, measuring respondents’ highest completed school grade level ranging from “less than
high school diploma” to “college degree or more.” Homeownership is also included as a proxy
for wealth (Alba et al. 1999; Logan and Alba 1993; Woldoff 2008). Acculturation is measured
by English language proficiency level and length of time spent in the U.S. (Alba and Nee 2003).
The final set of indicators measure family/household status and the region of where each
racial and ethnic group resides. Although the influence of family/household characteristics are
not directly related to the spatial assimilation model, previous research document their
importance in residential, and housing, attainment models (Logan and Alba 1993; Friedman and
Rosenbaum 2005; South et al. 2005; South and Crowder 1997). For example, changes in
family/household characteristics, such as its composition, size, and structure can influence a
household’s locational outcome (Rossi 1955; South and Deane 1993). Important life-cycle
changes, such as graduating from college, marriage, employment, and the arrival of children can
also increase, or influence, a household’s probability of moving to a larger housing unit that
meets their preferences and needs, either in the same region or a different state/city location
(South and Crowder 1997). Six predictors measure family/household characteristics:
householder’s sex, marital status, presence of own family members in the household, age, the
presence of own children under age 18, and household size. The variable “region” takes into
consideration each racial and ethnic group’s regional concentration.
The data analyses consist of two parts: bivariate and multivariate. The bivariate analyses
explore the background characteristics of the racial and ethnic groups of interest8. The
multivariate segment consists of calculating a series of logistic regression equations in order to
8 Tukey’s B post hoc tests are computed to assess statistical significance in group differences on the variables of
determine which predictors are more likely to predict each racial and ethnic group’s residence in
outer versus inner suburban rings. Logistic regression is the most preferred statistical
multivariate method to use when the dependent variable is dichotomous (Tabachnick and Fidell
2007). All categorical predictors are dummy coded, tested for multicollinearity, and
standardized. For ease of interpretation, the standardized odds ratios are presented which indicate
the change in the odds of residing in the outer versus inner suburban rings for each standard
deviation change in the associated predictors.
RESULTS
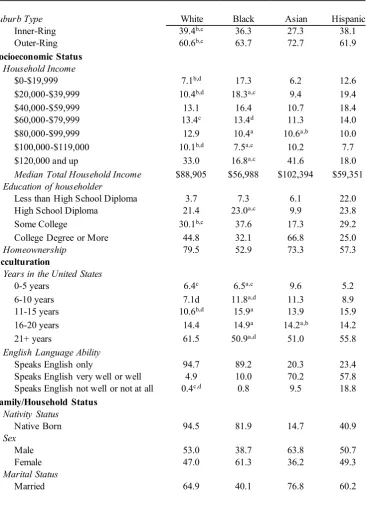
Table 1 presents the descriptive results of white, black, Asian, and Hispanic households’
individual-level background characteristics. Due to space limitations we only focus on the results
pertaining to SES and acculturation characteristics. The results reveal two main findings. First,
all racial and ethnic groups are more likely to reside in the outer suburban rings than their inner
ring counterparts. Second, differences between the groups of interest reveal a racial and ethnic
hierarchy, whereby Asians have higher shares of their households residing in the outer suburban
TABLE 1: Selected Descriptive Characteristics of White, Black, Asian, and Hispanic Households
Suburb Type White Black Asian Hispanic
Inner-Ring 39.4b,c 36.3 27.3 38.1
Outer-Ring 60.6b,c 63.7 72.7 61.9
Socioeconomic Status
Household Income
$0-$19,999 7.1b,d 17.3 6.2 12.6
$20,000-$39,999 10.4b,d 18.3a,c 9.4 19.4
$40,000-$59,999 13.1 16.4 10.7 18.4
$60,000-$79,999 13.4c 13.4d 11.3 14.0
$80,000-$99,999 12.9 10.4a 10.6a,b 10.0
$100,000-$119,000 10.1b,d 7.5a,c 10.2 7.7
$120,000 and up 33.0 16.8a,c 41.6 18.0
Median Total Household Income $88,905 $56,988 $102,394 $59,351
Education of householder
Less than High School Diploma 3.7 7.3 6.1 22.0
High School Diploma 21.4 23.0a,c 9.9 23.8
Some College 30.1b,c 37.6 17.3 29.2
College Degree or More 44.8 32.1 66.8 25.0
Homeownership 79.5 52.9 73.3 57.3
Acculturation
Years in the United States
0-5 years 6.4c 6.5a,c 9.6 5.2
6-10 years 7.1d 11.8a,d 11.3 8.9
11-15 years 10.6b,d 15.9a 13.9 15.9
16-20 years 14.4 14.9a 14.2a,b 14.2
21+ years 61.5 50.9a,d 51.0 55.8
English Language Ability
Speaks English only 94.7 89.2 20.3 23.4
Speaks English very well or well 4.9 10.0 70.2 57.8
Speaks English not well or not at all 0.4c,d 0.8 9.5 18.8
Family/Household Status
Nativity Status
Native Born 94.5 81.9 14.7 40.9
Sex
Male 53.0 38.7 63.8 50.7
Female 47.0 61.3 36.2 49.3
Marital Status
Married 64.9 40.1 76.8 60.2
To the extent the spatial assimilation theory predicts that suburban residence is linked to
higher levels of individual-level socioeconomic attainments, we expect a similar pattern with
in that all racial and ethnic group households have high educational attainment levels, i.e. have
earned a college degree or higher, nearly a quarter of each group’s household have household
incomes over $100,000, and more likely to be homeowners. Meanwhile, differences between the
groups reveal that white and Asian households are more likely to have higher median household
income, educational, and homeownership levels than their respective black and Hispanic
household counterparts. In addition, the findings also reveal that Asian households have higher
median household income and educational levels than white households. While black households
are more likely to have lower median household income level than Hispanics, the former group
is, however, more likely to have a higher share of households with some college or with a
college degree or higher than the latter group. With respect to homeownership, white households
are more likely to own their housing units, followed by Asian, Hispanic, and black households.
The findings in Table 1 also reveal four main findings with respect to differences in
acculturation. First, Asian, Hispanic, black households have higher share of foreign-born
households than whites. Second, over half of each group’s foreign-born households have been
residing in the U.S. for over twenty years. Third, Asians and blacks have higher shares of
recently arrived foreign-born households compared to the other two groups’ households. Lastly,
and with respect to English language fluency, all groups have relatively high English language
proficiency levels.
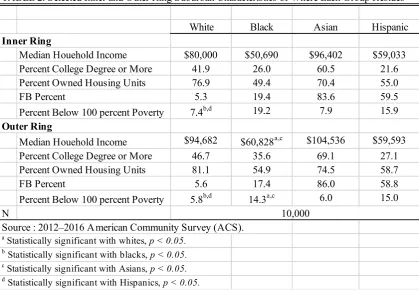
In addition to SES differences between the groups of interest, the results also reveal
differences in the SES characteristics of the suburban ring of where each group resides. Overall,
white and Asian households are more likely to reside in both outer and inner suburban rings with
TABLE 2. Selected Inner and Outer Ring Suburban Characteristics of Where Each Group Resides
White Black Asian Hispanic
Inner Ring
Median Houehold Income $80,000 $50,690 $96,402 $59,033
Percent College Degree or More 41.9 26.0 60.5 21.6
Percent Owned Housing Units 76.9 49.4 70.4 55.0
FB Percent 5.3 19.4 83.6 59.5
Percent Below 100 percent Poverty 7.4b,d 19.2 7.9 15.9
Outer Ring
Median Houehold Income $94,682 $60,828a,c $104,536 $59,593
Percent College Degree or More 46.7 35.6 69.1 27.1
Percent Owned Housing Units 81.1 54.9 74.5 58.7
FB Percent 5.6 17.4 86.0 58.8
Percent Below 100 percent Poverty 5.8b,d 14.3a,c 6.0 15.0 N
Source : 2012–2016 American Community Survey (ACS).
a Statistically significant with whites, p < 0.05. b Statistically significant with blacks, p < 0.05. c Statistically significant with Asians, p < 0.05. d Statistically significant with Hispanics, p < 0.05.
10,000
The finding that Asian and Hispanic households reside in both inner and outer suburban rings
with higher shares of foreign-bon than the other two groups tentatively hint to the possibility that
that they are able to bypass central cities and directly reside in suburban immigrant ethnic
enclaves (Alba and Nee 1997, 2003). These ethnic enclaves allow Asian and Hispanic
immigrants with modest economic means and limited English levels to reside in suburban
communities (Alba et al. 1999; Charles 2006; Logan, Wenquan, and Alba 2002).
To the extent that the aforementioned SES advantages exhibited by white and Asian
households relative to their black and Hispanic counterparts will explain the descriptive
differences as revealed in table 1, what remains to be seen is if there are differences in the rate at
versus inner suburban rings. The multivariate results will also test the degree to which these
descriptive differences in the type of suburban residence can be explained by differences in race
and ethnicity, SES, acculturation characteristics, and the remaining theoretically relevant
predictors.
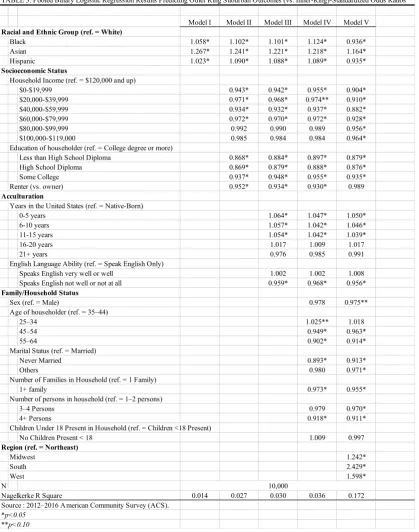
Table 3 presents the pooled, sequential, logistic regression models that estimate the
effects of each predictor on the odds of residing in the outer suburban rings versus their inner
ring counterparts. Model I controls only for race and ethnicity. Model II adds SES, i.e. household
income, occupation, education, and homeownership, and Model III incorporates acculturation
characteristics, i.e. length of time spent in the U.S. and English language proficiency levels. The
last two models, IV and V add family/household status and the region of where each racial and
ethnic group resides respectively. All results are presented as odds ratios to facilitate
TABLE 3. Pooled Binary Logisitic Regression Results Predicting Outer Ring Suburban Outcomes (vs. Inner-Ring)-Standardized Odds Ratios
Model I Model II Model III Model IV Model V
Racial and Ethnic Group (ref. = White)
Black 1.058* 1.102* 1.101* 1.124* 0.936*
Asian 1.267* 1.241* 1.221* 1.218* 1.164*
Hispanic 1.023* 1.090* 1.088* 1.089* 0.935*
Socioeconomic Status
Household Income (ref. = $120,000 and up)
$0-$19,999 0.943* 0.942* 0.955* 0.904*
$20,000-$39,999 0.971* 0.968* 0.974** 0.910*
$40,000-$59,999 0.934* 0.932* 0.937* 0.882*
$60,000-$79,999 0.972* 0.970* 0.972* 0.928*
$80,000-$99,999 0.992 0.990 0.989 0.956*
$100,000-$119,000 0.985 0.984 0.984 0.964*
Education of householder (ref. = College degree or more)
Less than High School Diploma 0.868* 0.884* 0.897* 0.879* High School Diploma 0.869* 0.879* 0.888* 0.876*
Some College 0.937* 0.948* 0.955* 0.935*
Renter (vs. owner) 0.952* 0.934* 0.930* 0.989
Acculturation
Years in the United States (ref. = Native-Born)
0-5 years 1.064* 1.047* 1.050*
6-10 years 1.057* 1.042* 1.046*
11-15 years 1.054* 1.042* 1.039*
16-20 years 1.017 1.009 1.017
21+ years 0.976 0.985 0.991
English Language Ability (ref. = Speak English Only)
Speaks English very well or well 1.002 1.002 1.008 Speaks English not well or not at all 0.959* 0.968* 0.956*
Family/Household Status
Sex (ref. = Male) 0.978 0.975**
Age of householder (ref. = 35–44)
25–34 1.025** 1.018
45–54 0.949* 0.963*
55–64 0.902* 0.914*
Marital Status (ref. = Married)
Never Married 0.893* 0.913*
Others 0.980 0.971*
Number of Families in Household (ref. = 1 Family)
1+ family 0.973* 0.955*
Number of persons in household (ref. = 1–2 persons)
3–4 Persons 0.979 0.970*
4+ Persons 0.918* 0.911*
Children Under 18 Present in Household (ref. = Children <18 Present)
No Children Present < 18 1.009 0.997
Region (ref. = Northeast)
Midwest 1.242*
South 2.429*
West 1.598*
N
Nagelkerke R Square 0.014 0.027 0.030 0.036 0.172 Source : 2012–2016 American Community Survey (ACS).
*p<0.05 **p<0.10
10,000
Two main findings emerge from the pooled results as revealed in Table 3. The first
the outer (versus inner) ring suburbs remain even when controlling for the effects of the
theoretically relevant predictors. Specifically, all nonwhite groups have higher odds of residing
in the outer suburban rings than white households, net of differences in SES, acculturation, and
family/household characteristics (see models I-IV). With respect to differences between the
groups the results reveal that Asian households are more likely to reside in the outer suburban
rings than white, black, and Hispanic households. For example, Asian households’ odds of
residing in outer rings suburbs are between 22% and 27% higher than the odds associated to
black and Hispanic households, which are between 6%-12% and 2%-9% respectively, even when
controlling for the effects of race/ethnicity, SES, acculturation, and family/household
characteristics separately or jointly (see Models I-IV).
The second main finding pertains to the effect of “region”. The odds of each racial and
ethnic group’s residence in the outer (versus inner) suburban rings change direction when adding
region to the set of predictors as revealed in Model V. As a result, Asian households continue to
remain more likely to reside in the outer suburban rings than white, black, and Hispanic
households. The aforementioned changes as produced by adding region to the set of predictors
possibly taps into metropolitan (structural) factors that may either hinder or enhance each
group’s ability to reside in the outer suburban rings. Features of the metropolitan region, such
residential segregation, population density, labor market structure, poverty rates, and availability
of affordable housing are all factors that can serve to stratify racial and ethnic group’s residential
outcomes in suburbia, as described by the place stratification model (Logan and Alba 1991;
Hanlon 2010).
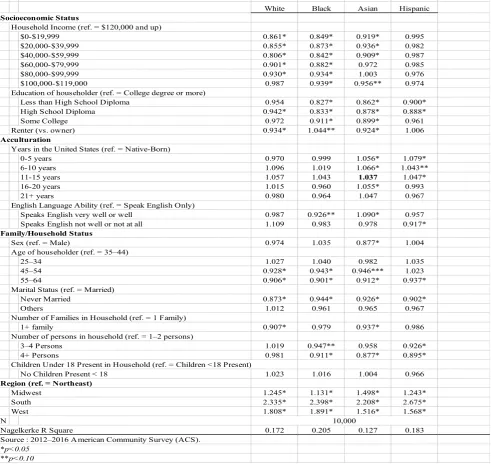
nuances involved in each group’s likelihood of residing in the outer versus inner suburban rings.
Table 4 presents the results from the individual level models for each racial and ethnic group of
interest10. Reflecting the pooled models in Table 3, the findings continue to reveal mixed results
to the expectations as outlined by the spatial assimilation model.
TABLE 4. Group Specific Logisitic Regression Results Predicting Outer Ring Suburban Outcomes (vs. Inner-Ring)-Standardized Odds Ratios
White Black Asian Hispanic
Socioeconomic Status
Household Income (ref. = $120,000 and up)
$0-$19,999 0.861* 0.849* 0.919* 0.995
$20,000-$39,999 0.855* 0.873* 0.936* 0.982
$40,000-$59,999 0.806* 0.842* 0.909* 0.987
$60,000-$79,999 0.901* 0.882* 0.972 0.985
$80,000-$99,999 0.930* 0.934* 1.003 0.976
$100,000-$119,000 0.987 0.939* 0.956** 0.974
Education of householder (ref. = College degree or more)
Less than High School Diploma 0.954 0.827* 0.862* 0.900*
High School Diploma 0.942* 0.833* 0.878* 0.888*
Some College 0.972 0.911* 0.899* 0.961
Renter (vs. owner) 0.934* 1.044** 0.924* 1.006
Acculturation
Years in the United States (ref. = Native-Born)
0-5 years 0.970 0.999 1.056* 1.079*
6-10 years 1.096 1.019 1.066* 1.043**
11-15 years 1.057 1.043 1.037 1.047*
16-20 years 1.015 0.960 1.055* 0.993
21+ years 0.980 0.964 1.047 0.967
English Language Ability (ref. = Speak English Only)
Speaks English very well or well 0.987 0.926** 1.090* 0.957 Speaks English not well or not at all 1.109 0.983 0.978 0.917*
Family/Household Status
Sex (ref. = Male) 0.974 1.035 0.877* 1.004
Age of householder (ref. = 35–44)
25–34 1.027 1.040 0.982 1.035
45–54 0.928* 0.943* 0.946*** 1.023
55–64 0.906* 0.901* 0.912* 0.937*
Marital Status (ref. = Married)
Never Married 0.873* 0.944* 0.926* 0.902*
Others 1.012 0.961 0.965 0.967
Number of Families in Household (ref. = 1 Family)
1+ family 0.907* 0.979 0.937* 0.986
Number of persons in household (ref. = 1–2 persons)
3–4 Persons 1.019 0.947** 0.958 0.926*
4+ Persons 0.981 0.911* 0.877* 0.895*
Children Under 18 Present in Household (ref. = Children <18 Present)
No Children Present < 18 1.023 1.016 1.004 0.966
Region (ref. = Northeast)
Midwest 1.245* 1.131* 1.498* 1.243*
South 2.335* 2.398* 2.208* 2.675*
West 1.808* 1.891* 1.516* 1.568*
N
Nagelkerke R Square 0.172 0.205 0.127 0.183
Source : 2012–2016 A merican Community Survey (ACS).
*p<0.05 **p<0.10
10,000
On average, SES exerts a positive relationship in residing in the outer suburban rings for
the majority of the racial and ethnic groups of interest. With the exception of Hispanics, all the
related to residence in the outer suburban rings, Table 4 reveals that white households with less
than a high school diploma and those who have attended some college are no more likely than
their higher educated counterparts to reside in the outer suburban rings. Hispanic households
with some college are also no more likely to reside in the outer suburban rings than their
counterparts with a college degree or higher. As expected, the effect of the last SES indicator,
tenure status, reveals that renter households are less likely to reside in the outer rings than their
respective homeowner counterparts. However, black household renters are more likely to reside
in the outer suburban rings compared to the other groups.
The results in Table 4 also provide tentative evidence to the notion that the returns to SES
differ between the racial and ethnic groups of interest. While black households incur a greater
loss to residing in the outer rings for all levels of income relative to those accrued by Asian
households, the former group’s losses, however, relative to whites present mixed results. With
respect to education, black households incur a greater loss in the odds of residing in the outer
suburban rings for every level of education compared to white, Asian, and Hispanic households.
This suggests that with each increment of educational attainment level, black households achieve
a greater return in residing in the outer suburban rings compared to those accrued by the other
groups. In other words, by virtue of white, Asian, and Hispanic households’ higher odds of
residing in the outer suburban rings for nearly every level of education, they all accrue smaller
improvements in the odds of residing in such places with each increment in education relative to
those accrued by black households. With respect to homeownership, black household renters
have higher odds of residing in the outer suburban rings than their respective white, Asian, and
their homeowner co-ethnics to reside in the outer suburban rings. Differences between white and
Asian households are nearly similar.
The effects of acculturation also reveal contradictory results to the main tenets of the
spatial assimilation model. Black and Asian households who do not speak English or those with
limited English language proficiency levels are no more likely to reside in the outer suburban
rings than their counterparts who speak English only (see Table 4). Interestingly, Asian
households who speak English well or very well have higher odds of residing in the outer rings
than their counterparts who speak English only. The effect among white households continues to
reveal mixed results. For example, white households with limited English language fluency
levels are no more likely than their counterparts who speak only English to reside in the outer
suburban rings. With respect to length of time spent in the U.S., the results for white and black
households are not statistically significant, as well as for some longer-term Asian arrivals, i.e.
those residing in the U.S. between 11-15 and 20+ years. In contradiction to the spatial
assimilation model, recently arrived Asian and Hispanic households, i.e. those residing in the
U.S. less than ten years, have higher odds of residing in the outer suburban rings compared to
each group’s native-born counterparts.
DISCUSSION
The present study examined inner and outer suburban ring attainment outcomes among
racial and ethnic groups residing in the nation’s metropolitan areas. While the spatial
assimilation model has relied on the ‘central-city/suburb’ dichotomy from which to measure the
revisit the model’s hypothesized predicted locational outcome. Therefore, the main objective was
to re-evaluate the extent to which the spatial assimilation model can accurately describe the
relationship between white, black, Asian, and Hispanic households’ SES, and acculturation,
characteristics with the odds of residing in the outer versus inner suburban rings.
Overall, both the bivariate and multivariate findings confirm and contradict the main
tenets of the spatial assimilation model. While all groups are more likely to reside in outer
suburban rings than their inner ring counterparts, a racial and ethnic hierarchy exists in that
Asians have higher shares of their households residing in the outer rings, followed by black,
Hispanic, and white households. Contrary to the spatial assimilation model, the multivariate
models fail to minimize racial and ethnic group differences in the odds of residing in outer
suburban rings relative to their inner ring counterparts. Despite the positive relationship between
all groups’ SES attainments and the odds of residing in the outer suburban rings, the multivariate
results also reveal that differences in the returns each group receives to each SES indicator varies
by race and ethnicity. Another key finding relates to the effect of region. The finding that the
addition of region reverses the direction of the odds of residing in the outer suburban rings for
both black and Hispanic households relative to those of Asian and white households points to a
critical difference in the process of seeking residence in the suburbs. This might suggest that the
advantage certain racial and ethnic groups have in residing in either the outer or inner suburban
rings lies in the ways of how they are perceived by institutional, and individual, housing agents
during their encounter with the suburban housing market (Rothstein 2017).
While this is the first study to explore the relationship between racial and ethnic group’s
SES attainments and residential outcomes between suburban inner and outer rings, it is not
the regional level, of how each racial and ethnic group seeks to secure residence across inner and
outer rings. Socioeconomic, demographic, and structural changes within suburbia also call for
future research unpacking the nuances involved in the processes as racial and ethnic groups seek
to convert their SES attainments into residence in neighborhoods across suburbia. Furthermore,
the study can be improved by differentiating each racial and ethnic group by place of birth,
generation, and/or national origin, so as to uncover underlying SES and acculturation differences
within and between each group’s likelihood of residing in either suburban ring. To the extent the
current findings are time contingent to the time period studied or can be replicated for other time
periods, the present study raises the continued importance of race and SES in influencing racial
and ethnic group’s locational attainment outcomes within suburbia.
APPENDIX 1
APPENDIX 1. Pooled Binary Logisitic Regression Results Predicting Outer Ring Suburban Outcomes (vs. Inner-Ring)-Standardized Coefficients (Standrd Errors)
Model I Model II Model III Model IV Model V
Racial and Ethnic Group (ref. = White)
Black 0.057* (0.013) 0.097* (0.013) 0.096* (0.013) 0.117* (0.013) -0.066* (0.015)
Asian 0.236* (0.013) 0.216* (0.013) 0.199* (0.018) 0.197* (0.018) 0.152* (0.019)
Hispanic 0.023* (0.013) 0.086* (0.013) 0.085* (0.016) 0.085* (0.016) -0.067* (0.018) Socioeconomic Status
Household Income (ref. = $120,000 and up)
$0-$19,999 -0.058* (0.013) -0.060* (0.013) -0.046* (0.014) -0.101* (0.015)
$20,000-$39,999 -0.030* (0.013) -0.033* (0.014) -0.026* (0.014) -0.094* (0.015)
$40,000-$59,999 -0.068* (0.013) -0.07* (0.013) -0.065* (0.013) -0.126* (0.014)
$60,000-$79,999 -0.028* (0.013) -0.031* (0.013) -0.028* (0.013) -0.074* (0.014)
$80,000-$99,999 -0.008 (0.012) -0.010 (0.012) -0.011 (0.012) -0.045* (0.013)
$100,000-$119,000 -0.015 (0.012) -0.016 (0.012) -0.016 (0.012) -0.037* (0.013)
Education of householder (ref. = College degree or more)
Less than High School Diploma -0.141* (0.012) -0.123* (0.013) -0.108* (0.013) -0.129* (0.014) High School Diploma -0.140* (0.012) -0.129* (0.012) -0.119* (0.013) -0.132* (0.013)
Some College -0.066* (0.012) -0.053* (0.013) -0.046* (0.013) -0.067* (0.013)
Renter (vs. owner) -0.049* (0.012) -0.068* (0.012) -0.073* (0.012) -0.011 (0.013)
Acculturation
Years in the United States (ref. = Native-Born)
0-5 years 0.062* (0.013) 0.046* (0.013) 0.048* (0.014)
6-10 years 0.055* (0.013) 0.041* (0.013) 0.045* (0.014)
11-15 years 0.052* (0.013) 0.041* (0.013) 0.038* (0.014)
16-20 years 0.017 (0.013) 0.009 (0.013) 0.017 (0.014)
21+ years -0.024 (0.015) -0.015 (0.015) -0.009 (0.016)
English Language Ability (ref. = Speak English Only)
Speaks English very well or well 0.002 (0.017) 0.002 (0.018) 0.08 (0.019)
Speaks English not well or not at all -0.042* (0.015) -0.032* (0.015) -0.045* (0.016) Family/Household Status
Sex (ref. = Male) -0.022 (0.013) -0.026** (0.014)
Age of householder (ref. = 35–44)
25–34 0.025** (0.013) 0.018 (0.014)
45–54 -0.052* (0.014) -0.038* (0.014)
55–64 -0.103* (0.015) -0.09* (0.016)
Marital Status (ref. = Married)
Never Married -0.113* (0.013) -0.092* (0.014)
Others -0.02 (0.012) -0.03* (0.013)
Number of Families in Household (ref. = 1 Family)
1+ family -0.027* (0.011) -0.046* (0.011)
Number of persons in household (ref. = 1–2 persons)
3–4 Persons -0.021 (0.014) -0.031* (0.014)
4+ Persons -0.085* (0.013) -0.094* (0.014)
Children Under 18 Present in Household (ref. = Children <18 Present)
No Children Present < 18 0.009 (0.015) -0.003 (0.015)
Region (ref. = Northeast)
Midwest 0.217* (0.012)
South 0.887* (0.015)
West 0.469* (0.013)
N
Constant 0.614 0.620 0.622 0.625 0.697
Source : 2012–2016 American Community Survey (ACS).
*p<0.05 **p<0.10
APPENDIX 2
APPENDIX 2. Group Specific Logisitic Regression Results Predicting Outer Ring Suburban Outcomes (vs. Inner-Ring)-Standardized Coefficients (Standard Errors)
Socioeconomic Status Coef SE Coef SE Coef SE Coef SE
Household Income (ref. = $120,000 and up)
$0-$19,999 -0.150* 0.032 -0.164* 0.030 -0.084* 0.034 -0.005 0.030 $20,000-$39,999 -0.157* 0.031 -0.135* 0.032 -0.066* 0.032 -0.019 0.030 $40,000-$59,999 -0.216* 0.028 -0.172* 0.031 -0.096* 0.030 -0.013 0.029 $60,000-$79,999 -0.104* 0.025 -0.126* 0.030 -0.029 0.028 -0.015 0.028 $80,000-$99,999 -0.072* 0.023 -0.068* 0.030 0.003 0.027 -0.024 0.028 $100,000-$119,000 -0.013 0.023 -0.063* 0.029 -0.045** 0.024 -0.026 0.027 Education of householder (ref. = College degree or more)
Less than High School Diploma -0.047 0.037 -0.19* 0.029 -0.149* 0.031 -0.105* 0.023 High School Diploma -0.06* 0.025 -0.182* 0.027 -0.13* 0.033 -0.118* 0.028 Some College -0.029 0.025 -0.094* 0.027 -0.107* 0.030 -0.039 0.029 Renter (vs. owner) -0.068* 0.029 0.044** 0.026 -0.079* 0.029 0.006 0.025
Acculturation
Years in the United States (ref. = Native-Born)
0-5 years -0.031 0.068 -0.001 0.039 0.054 0.021 0.076 0.027 6-10 years 0.091 0.077 0.019 0.035 0.064 0.023 0.042 0.024 11-15 years 0.056 0.074 0.043 0.037 0.036 0.025 0.046 0.022 16-20 years 0.015 0.062 -0.041 0.036 0.053 0.025 -0.007 0.022 21+ years -0.02 0.056 -0.037 0.037 0.046 0.034 -0.034 0.025 English Language Ability (ref. = Speak English Only)
Speaks English very well or well -0.013 0.059 -0.076** 0.046 0.086* 0.034 -0.044 0.029 Speaks English not well or not at all 0.104 0.094 -0.018 0.068 -0.022 0.028 -0.087* 0.023
Family/Household Status
Sex (ref. = Male) -0.027 0.026 0.034 0.028 -0.131* 0.032 0.004 0.030 Age of householder (ref. = 35–44)
25–34 0.026 0.030 0.040 0.029 -0.018 0.029 0.034 0.025 45–54 -0.074* 0.029 -0.059* 0.030 -0.055** 0.030 0.022 0.028 55–64 -0.099* 0.031 -0.104* 0.032 -0.092* 0.033 -0.065* 0.032 Marital Status (ref. = Married)
Never Married -0.136* 0.029 -0.057* 0.026 -0.077* 0.033 -0.103* 0.026 Others 0.012 0.026 -0.04 0.026 -0.036 0.033 -0.034 0.025 Number of Families in Household (ref. = 1 Family)
1+ family -0.098* 0.026 -0.021 0.024 -0.065* 0.024 -0.015 0.020 Number of persons in household (ref. = 1–2 persons)
3–4 Persons 0.019 0.029 -0.055** 0.029 -0.042 0.031 -0.077* 0.030 4+ Persons -0.019 0.031 -0.093* 0.030 -0.131* 0.029 -0.111* 0.027 Children Under 18 Present in Household (ref. = Children <18 Present)
No Children Present < 18 0.022 0.032 0.016 0.029 0.004 0.035 -0.035 0.030
Region (ref. = Northeast)
Midwest 0.219* 0.019 0.123* 0.024 0.404* 0.031 0.217* 0.031 South 0.848* 0.029 0.875* 0.028 0.792* 0.035 0.984* 0.030
West 0.592* 0.031 0.637* 0.038 0.416* 0.024 0.025
N 0.45*
Constant 0.714 0.533 0.905 0.555
Nagelkerke R Square
Source : 2012–2016 American Community Survey (ACS).
*p<0.05
REFERENCES
Adelman, Robert, Hui-Shien Tsao, Stewart Tolnay, and Kyle Crowder. 2001.
Neighborhood Disadvantage Among Racial and Ethnic Groups: Residential Location in 1970 and 1980. The Sociological Quarterly 42: 603-32.
Alba, R & Nee, V. 1997. Rethinking Assimilation Theory for a New Era of Immigration.
International Migration Review, 31: 826-74.
Alba, Richard, and John R. Logan. 1991. Variation on Two Themes: Racial and Ethnic Patterns in Attainment of Suburban Residence. Demography 28: 431-53.
Alba, Richard, and John R. Logan. 1993. Minority Proximity to Whites in the Suburbs: An Individual Analysis of Segregation. American Journal of Sociology 98: 1388-1427.
Alba, Richard, and Victor Nee. 1997. Rethinking Assimilation Theory for a New Era of Immigration. International Migration Review 31: 826-74.
Alba, Richard, and Victor Nee. 2003. Remaking the American Mainstream: Assimilation and Contemporary Immigration. Cambridge: Harvard University Press.
Alba, Richard, John Logan, and Brian Stults. 2000. The Changing Neighborhood Contexts of the Immigrant Metropolis. Social Forces 79: 587-621.
Alba, Richard, John Logan, Brian Stults, Gilbert Marzan, and Wenquan Zhang. 1999. Immigrant Groups in Suburbs: A Reexamination of Suburbanization and Spatial Assimilation.
American Sociological Review 64: 446-60.
Allard, W. Scott. 2017. Places in Need: The Changing Geography of Poverty. New York: Russell Sage Foundation.
Anacker, Katrin. 2015. The New American Suburb: Poverty, Race, and the Economic Crisis. Burlington: Ashgate.
Anacker, Katrin B., Christopher Niedt, and Chang Kwon. 2017. Analyzing Segregation in Mature and Developing Suburbs in the United States. Journal of Urban Affairs 39: 819-32.
Anacker, Katrin B. 2015. Analyzing Census Tract Foreclosure Risk Rates in Mature and Developing Suburbs in the United States. Urban Geography 36: 1221-40.
Capps, Randy, James D. Bachmeier, and Jennifer Van Hook. 2018. Estimating the
Charles, Camille Z. 2006. Won’t You Be My Neighbor? Race, Residence, and Inter-Group Relations in Los Angeles. New York: Russell Sage Foundation.
Charles, Camille Z. 2003. The Dynamics of Racial Residential Segregation. Annual Review of Sociology 29: 167-207.
Coley, R. L., Leventhal, T., Lynch, A. D., & Kull, M. 2013. Relations between Housing Characteristics and the Well-Being of Low-Income Children and Adolescents.
Developmental Psychology 49: 1775-89.
Evans, G. W., Wells, N. M., Chan, H. E. & Saltzman, H. 2000. Housing Quality and Mental Health. Journal of Consulting and Clinical Psychology 68: 526-30.
Farrell, R. Chad. 2016. Immigrant Suburbanisation and the Shifting Geographic Structure of Metropolitan Segregation in the United States. Urban Studies 53: 57-76.
Farrell CR, Firebaugh G. 2016. Is immigrant neighborhood inequality less pronounced in suburban areas? Social Science Research 57:161-76.
Friedman, Samantha, and Emily Rosenbaum. 2005. Does Suburban Residence Mean Better Neighborhood Conditions for all Households? Assessing the Influence of Nativity Status and Race/Ethnicity. Social Science Research 36:1–27.
Frey, William. 2015. Diversity Explosion. Washington, D.C.: Brookings Institution Press.
Frey, William and Alden Speare. 1988. Regional and Metropolitan Growth and Decline in the United States. New York: Russell Sage Foundation.
Gallagher, L. 2013. The End of the Suburbs: Where the American Dream is Moving. New York: Portfolio.
Gordon, Milton M. 1964. Assimilation in American Life. New York: Oxford University Press.
Hanlon, B. 2009. A Typology of Inner-Ring Suburbs: Class, Race, and Ethnicity in U.S. Suburbia. City and Community 8: 221-46.
Hanlon, B. 2010. Once the American Dream: Inner-Ring Suburbs of the Metropolitan United States. Philadelphia: Temple University Press.
Hanlon, B., and Vicino, T. J. 2007. The Fate of Inner Suburbs: Evidence from Metropolitan Baltimore. Urban Geography 28: 249–75.
Hudnut, W.H. 2003. Halfway to Everywhere: A Portrait of America’s First-Tier Suburbs. Washington, DC: Urban Land Institute.
Kneebone, Elizabeth, and Alana Berube. 2013. Confronting Suburban Poverty in America.
Washington, DC.: Brookings Institution Press.
Lee, S., & Leigh, N. G. (2007). Intrametropolitan Spatial Differentiation and Decline of Inner-Ring Suburbs: A Comparison of Four US Metropolitan Areas. Journal of Planning Education and Research 27: 146-64.
Leigh, N. G., and Lee, S. 2005. Philadelphia’s Space In Between: Inner-Ring Suburb Evolution.
Opolis 1: 13–32.
Logan, John R. and Harvey Molotch. 1987. Urban Fortunes. Berkeley: University of California Press.
Logan, John R. and Richard D. Alba. 1991. Variations on Two Themes: Racial and Ethnic Patterns in the Attainment of Suburban Residence. Demography 28: 431-53.
Logan, John R. Richard D. Alba, Shu-Yin Leung. 1996. Minority Access to White Suburbs: A Multiregional Comparison. Social Forces 74: 851-81.
Logan, John R. Richard D. Alba, Tom McNulty, and Brian Fisher. 1996. Making a Place in the Metropolis: Locational Attainment in Cities and Suburbs. Demography 33: 443-53.
Logan, John R. Richard D. Alba. 1993. Locational Return to Human Capital: Minority Access to Suburban Community Resources. Demography 30: 243-68.
Logan, John R., Zhang Wenquan, and Richard Alba D. 2002. Immigrant Enclaves and Ethnic Communities in New York and Los Angeles. American Sociological Review 67: 299-322.
Lucy, W.H. and Phillips, D.L. 2000. Confronting Suburban Decline: Strategic Planning or Metropolitan Renewal. Washington, DC: Island Press.
Lucy, W.H. and Phillips, D.L. 2006. Tomorrow’s Cities, Tomorrow’s Suburbs. Chicago: Planners Press.
Massey, Douglas and Brendan Mullan. 1985. Processes of Hispanic and Black Spatial Assimilation. American Journal of Sociology 89: 836-73.
Massey, Douglas, and Nancy Denton. 1988. Suburbanization and Segregation in U.S. Metropolitan Areas. American Journal of Sociology 94: 592-626.
Oh, S., & Yinger, J. 2015. What Have We Learned from Paired Testing in Housing Markets?
Cityscape 17: 15-60.
Pfeiffer, Deirdre. 2012. Has Exurban Growth Enabled Greater Racial Equity in Neighborhood Quality? Evidence from the Los Angeles Region. Journal of Urban Affairs 34: 347–71.
Pfeiffer, Deirdre. 2016. Racial Equity in the Post-Civil Rights Suburbs? Evidence from US Regions 2000–2012. Urban Studies 53: 799–817.
Puentes, R. and Orfield, M. 2002. Valuing America’s First Suburbs: A Policy Agenda for Older Suburbs in the Midwest. Washington, DC: The Brookings Institution Press.
Rosenbaum, Emily and Samantha Friedman. 2004. Generational Patterns in Home Ownership and Housing Quality among Racial/Ethnic Groups in New York City, 1999. The International Migration Review, 38: 1492-1533.
Rosenbaum, Emily and Samantha Friedman. 2007. The Housing Divide: How Generations of Immigrants Fare in New York’s Housing Market. New York: New York University Press.
Rosenbaum, Emily. 1996. Racial/Ethnic Differences in Home Ownership and Housing Quality, 1991. Social Problems 43: 403-26.
Rossi, Peter. 1955. Why Families Move: A Study in the Social Psychology of Urban Residential Mobility. Glencoe: Free Press.
Rothstein, Richard. 2017. The Color of Law: The Forgotten History of How Our Government Segregated America. New York: Liveright Publishing.
Steven Ruggles, Sarah Flood, Ronald Goeken, Josiah Grover, Erin Meyer, Jose Pacas, and Matthew Sobek. IPUMS USA: Version 8.0 [dataset]. Minneapolis, MN: IPUMS, 2018.
https://doi.org/10.18128/D010.V8.0 (accessed on 20 August 2018).
Sampson, Robert J. (2012). The Great American City: Chicago and the Enduring Neighborhood Effect. Chicago: University of Chicago Press.
Sampson, Robert J., Jeffrey D. Morenoff, and Thomas Gannon-Rowley. 2002. Assessing “Neighborhood effects”: Social Processes and New Directions in Research. Annual Review of Sociology 28: 44 3-78.
Sharkey, Patrick. 2013. Stuck in Place: Urban Neighborhoods and the End of Progress Toward Racial Equality. Chicago: University of Chicago Press.
Short, J., Hanlon, B. and Thomas J. Vicino. 2007. The Decline of Inner Suburbs: The New Suburban Gothic in the United States. Geography Compass 1: 641–56.
South, Scott. And Kyle Crowder. 1998. Leaving the 'Hood: Residential Mobility between Black, White, and Integrated Neighborhoods. American Sociological Review 63: 17-26.
South, Scott and Glenn Deane. 1993. Race and Residential Mobility: Individual Determinants and Structural Constraints. Social Forces 72: 147-67.
South, Scott J. and Kyle D. Crowder. 1997. Escaping Distressed Neighborhoods: Individual, Community, and Metropolitan Influences. American Journal of Sociology 102:1040–84.
South, Scott J., Kyle Crowder, and Erick Chavez. 2005. Geographic Mobility and Spatial Assimilation among U.S. Latino Immigrants. International Migration Review 39: 577– 607.
Swanstrom, Todd, Colleen Casey, Robert Flack, and Peter Dreier. 2004. Pulling Apart:
Economic Segregation Among Suburbs and Central Cities in Major Metropolitan Areas. Washington, DC: Brookings Institution Press.
Tabachnick, Barbara G., and Linda S. Fidell. 2001. Using Multivariate Statistics, 4th ed. Boston: Allyn and Bacon.
Timberlake, Jeffrey M., Aaron J. Howell, and Amanda J. Staight. 2011. Trends in the Suburbanization of Racial/Ethnic Groups in U.S. Metropolitan Areas, 1970 to 2000.
Urban Affairs Review 47:218−55.
Turner, Margery A., Stephen Ross L. 2005. How racial discrimination affects the search for housing. In The Geography of Opportunity: Race and Housing Choice in Metropolitan America, ed. X Souzade Briggs, pp. 81–100. Washington, DC: Brookings Institution Press
Turner, Margery A., Stephen Ross, George Galster, and John Yinger. 2002. Discrimination in metropolitan housing markets: National results from phase I HDS 2000. Washington, D.C.: U.S. Department of Housing and Urban Development.
Turner, Margery, Rob Santos, Diane Levy, Doug Wissoker, Claudia L. Aranda, and Rob Ptingolo. 2013. Housing Discrimination Against Racial and Ethnic Minorities 2012. Washington, DC: U.S. Department of Housing and Urban Development.
U.S. Census Bureau. 2012. Newsroom: Census Bureau Releases Estimates of Undercount and Overcount in the 2010 Census. Washington, DC: U.S. Census Bureau. Retrieved June 8, 2017 (https://www.census.gov/newsroom/releases/archives/2010_census/cb12-95.html).
Wilkes, Rima and John Iceland. 2004. Hypersegregation in the Twenty-First Century: An Update and Analysis. Demography, 41: 23–36.
Wilson, Jill, and Audrey Singer. 2011. Immigrants in 2010 Metropolitan America: A Decade of Change. Washington, D.C.: Brookings Institution.
Woldoff, Rachael A. 2008. Wealth, Human Capital, and Family across Racial/Ethnic Groups: Integrating Models of Wealth and Locational Attainment. Urban Studies 45: 527-51.