R E V I E W
Statistical Challenges in Development of Prognostic
Models in Diffuse Large B-Cell Lymphoma:
Comparison Between Existing Models
–
A Systematic
Review
This article was published in the following Dove Press journal: Clinical Epidemiology
Jelena Jelicic1
Thomas Stauffer Larsen1,2 Henrik Frederiksen 1,2 Bosko Andjelic 3 Milos Maksimovic4 Zoran Bukumiric5
1Department of Hematology, Odense
University Hospital, Odense, Denmark;
2Department of Clinical Research,
University of Southern Denmark,
Odense, Denmark;3Department of
Haematology, Blackpool Victoria Hospital, Lancashire Haematology
Centre, Blackpool, UK;4Department of
Ophthalmology, Aalborg University Hospital, Aalborg, Denmark;
5Department of Statistics, Faculty of
Medicine, University of Belgrade, Belgrade, Serbia
Background and Aim: Based on advances in the diagnosis, classification, and manage-ment of diffuse large B-cell lymphoma (DLBCL), a number of new prognostic models have been proposed. The aim of this study was to review and compare different prognostic models of DLBCL based on the statistical methods used to evaluate the performance of each model, as well as to analyze the possible limitations of the methods.
Methods and Results:A literature search identified 46 articles that proposed 55 different prognostic models for DLBCL by combining different clinical, laboratory, and other para-meters of prognostic significance. In addition, six studies used nomograms, which avoid risk categorization, to create prognostic models. Only a minority of studies assessed discrimina-tion and/or calibradiscrimina-tion to compare existing models built upon different statistical methods in the process of development of a new prognostic model. All models based on nomograms reported the c-index as a measure of discrimination. There was no uniform evaluation of the performance in other prognostic models. We compared these models of DLBCL by calculat-ing differences and ratios of 3-year overall survival probabilities between the high- and the low-risk groups. We found that the highest and lowest ratio between low- and high-risk groups was 6 and 1.31, respectively, while the difference between these groups was 18.9% and 100%, respectively. However, these studies had limited duration of follow-up and the number of patients ranged from 71 to 335.
Conclusion:There is no universal statistical instrument that could facilitate a comparison of prognostic models in DLBCL. However, when developing a prognostic model, it is recom-mended to report its discrimination and calibration in order to facilitate comparisons between different models. Furthermore, prognostic models based on nomograms are becoming more appealing owing to individualized disease-related risk estimations. However, they have not been validated yet in other study populations.
Keywords:diffuse large B-cell lymphoma, discrimination, calibration, prognosis, models, nomograms
Introduction
The most commonly used prognostic index for risk stratification of patients with
diffuse large B-cell lymphoma (DLBCL) is the International Prognostic Index
(IPI).1,2Since the introduction of rituximab in DLBCL therapy, the discriminative
abilities of the IPI have been challenged in many studies.2–6Predominantly, based on
the new insights into the pathobiology of disease, the predictive power of different
Correspondence: Thomas Stauffer Larsen Department of Hematology, Odense University Hospital, Odense, Denmark Tel +45 2145 0236
Fax +45 6541 3035
Email [email protected]
Clinical Epidemiology
Dove
press
open access to scientific and medical research
Open Access Full Text Article
Clinical Epidemiology downloaded from https://www.dovepress.com/ by 118.70.13.36 on 24-Aug-2020
biomarkers for prognosis has been extensively investigated and this has led to numerous attempts at incorporating clinical, biological, laboratory, immunohistochemical, and
genetic markers in prognostic scores.7–15However, none of
the newly developed models has been as widely used as the IPI.
Despite the standard treatment with chemoimmunother-apy, approximately 30% of patients experience disease
relapse or are refractory to therapy.16Therefore, the
utiliza-tion of selected group of patients’ characteristics through
a statistical model is important to identify high-risk patients
who could potentially benefit from more intensive
immuno-chemotherapy and/or molecular-targeted agents.17
Prognostic risk models, which are a mathematically precise way to summarize properties of measurements and their
associations, are created to predict events.18When
develop-ing a model, it is important to provide some evaluation of its
performance in comparison to an existing model.19 The
usefulness of a prognostic test in clinical practice depends mainly on the ability of the test to stratify patients into different risk groups and to provide accurate predictions about their future outcome. However, when biomarkers are included in statistical models for predicting a clinical
out-come, two problems can occur, namely“error in
discrimina-tion”and“error in calibration”.20 To achieve accurate risk
prediction, validation of the specific prediction model is
needed. For that task, various statistical methods have been
suggested in the literature.20–22
In our previous systematic review, we described the studies that reported different prognostic models for newly diagnosed DLBCL with a focus on clinical, laboratory, molecular, and/or imaging parameters included in each model. However, the analysis of statistical methods used to compare the novel models in DLBCL with the pre-viously reported models, to the best of our knowledge, has never been performed. Therefore, this study aims to investigate the statistical instruments that have been used to develop, compare, and evaluate the performance of prognostic models for DLBCL. Another aim is to analyze possible limitations of each statistical method that can restrict the wide usage of the derived model.
Materials and Methods
Search Strategy
Similarly to our previous research, this review was con-ducted in accordance with the guidelines of the Preferred Reporting Items for Systematic Reviews and
Meta-analysis.23 A comprehensive search was conducted in
PubMed and Embase to identify original publications that proposed prognostic scores for newly diagnosed
DLBCL.24 Only studies in English published between
1993 and 15 July 2019 were considered.
The relevant Medical Subject Headings (MeSH) were used where possible and the following search terms were used in our analysis: lymphoma, large B-cell, diffuse/ DLBCL, index/indices, model, score, prognosis/prognos-tic, outcome, survival, and comparison. The additional
eligible studies were retrieved through secondary
references.24 The search results were independently
dou-ble-screened by the research team (JJ, MM, BA) according to inclusion/exclusion criteria at the abstract and the
full-text screening. All the studies included in the final list
were checked for data availability by BA and underwent full statistical analysis, performed by ZB.
Selection Criteria and Data Extraction
This analysis included studies that developed a new risk model for newly diagnosed DLBCL patients by combining at least two parameters, of which one must be a clinical or a laboratory parameter with or without imaging or a molecular prognostic marker. The studies evaluated
overall survival (OS) using the Kaplan–Meier method
and/or expressed the outcome as the percentage of surviv-ing patients. The exclusion criteria referred to all articles that did not provide a new prognostic model (eg case reports, commentaries, meeting reports, reviews), as well as those that analyzed only one subtype of DLBCL, pro-posed an index based exclusively on histopathological or
molecular data, and/or lacked sufficient data for estimating
OS. Moreover, we excluded studies that only tested scores previously developed on patient populations other than
newly diagnosed DLBCL.24
After exclusion of the irrelevant studies based on the titles and abstracts, the full texts of the selected articles were analyzed. We also reviewed the full text of the studies from which a decision could not be made on the
abstract alone. All studies included in the final list were
reviewed for their data accuracy.24The data extracted from
each study were all of the following whenever reported: author and publication year, index name, risk categories, number of patients per group of new index and previously reported index (eg IPI, revised IPI), model performance, and OS expressed as the 3-year percentage of surviving patients. If missing, the 3-year OS for newly created models and previously reported models (used to compare
Clinical Epidemiology downloaded from https://www.dovepress.com/ by 118.70.13.36 on 24-Aug-2020
with the newly developed model) was estimated from the survival curves using GetData Graph Digitizer 2.26. Three-year OS was chosen because the majority of studies report this endpoint.
For the studies that compared performance of a new score and previously tested scores, the statistical methods of comparison were recorded. Additional statistics included c-index, Bayesian information criterion (BIC), concordance
probability estimate (CPE), Akaike’s information criterion
(AIC), Hosmer–Lemeshow goodness of fit, and receiver
operating characteristics (ROC) curves. The difference between c-index was calculated in the studies that reported the c-index. For each new score, the difference and propor-tion between high- and low-risk groups were calculated. We
first extracted 3-year OS measures, then these values were
compared between high-risk and low-risk groups using calculations of differences and proportions. Proportion was assessed by dividing 3-year OS estimates in high-risk patients by those in low-risk patients, while the difference was calculated by subtraction of 3-year OS of the low-risk group from the high-risk group. This value was expressed in percentages. Furthermore, similar calculations were per-formed if the studies reported 3-year OS survival for pre-viously reported indices (eg IPI). If the 3-year OS was not reached because of censored patients, or if the OS was 0%, the proportion was labeled as not applicable (NA) for mathematical reasons. The scores with the highest values of the difference and proportion were regarded as those with better differentiation between risk categories.
Results
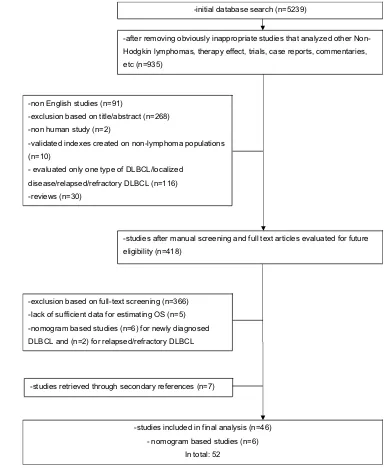
The initial search strategy identified 5239 articles, but after
the inclusion/exclusion criteria were used, of 418 potentially
relevant articles, 46 studies were included in the final list.
Among these, seven additional articles were retrieved through the references included in the eligible studies and relevant reviews (Figure 1). Although the IPI was developed based on a broad cohort of patients with aggressive lym-phoma subtypes, this model was included in the current study
because it is widely used for prognostication in DLBCL.1,24
Furthermore, the search strategy identified six additional
studies that used nomograms to develop prognostic
models.25–30Although these studies did not meet the
inclu-sion criteria regarding OS and risk stratification, they are
briefly discussed later owing to their individualized approach
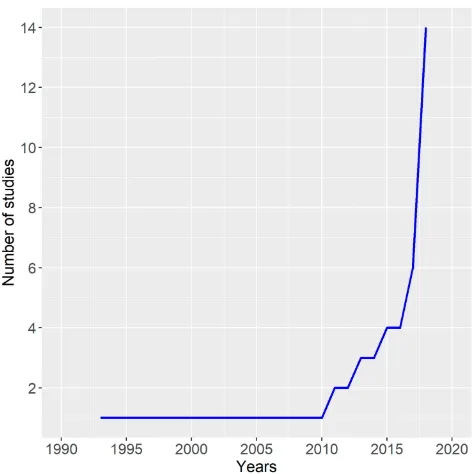
for risk prediction. In total, 52 studies were analyzed. In 46 studies, a total of 55 prognostic models were proposed for DLBCL patients. From 1993 until 2019,
a significant increase in the number of proposed prognostic
models for DLBCL patients has been observed (Figure 2). In all, 40 studies proposed one prognostic model, while
four studies proposed two models,10,31-33 one proposed
three,1and one study proposed four prognostic models.11
In total, 26 prognostic models used a four-category risk
stratification with recognition of low-, low–intermediate-,
high–intermediate-, and high-risk groups (Tables 1–4).
Three-category risk stratification (low-, intermediate-,
and high-risk groups) was proposed in 20 studies.
Two-category risk stratification with high- and low-risk groups
was reported in six studies, whilefive-category risk
strati-fication was proposed in three studies.
Each of six studies that developed nomograms pro-posed just one prognostic model based on the individual risk prognostication. Additional data regarding each study
are provided in thesupplementary table.
Statistical Analysis
Twelve of 46 studies analyzed populations with more than
400 patients (range 403–2031), while 32 studies included
fewer patients (range 45–391). Among studies based on
nomograms, three of six included more than 400 patients. The majority of studies lacked the splitting of the analyzed population into training and validation sets as
well as a comparison to previously proposed models.24
Seven studies of 46 used training and validation sets to
develop a prognostic index and to validate it.1,2,16,31,34-36
Among the studies using nomograms, three used both
internal and external validation,26–28 one used internal
validation only,25 and two did not assess the performance
through validation.29,30
Model performance was evaluated using different methods, which are discussed in the following subsections.
C-Statistics
As a measure of discrimination, the area under the receiver operating characteristics (ROC) curve for survival outcomes
(the c-index) was used in seven of 46 studies.7,16,32,34,37-39
Higher values of the c-index indicated better discrimination. The value of the c-index for the novel prognostic models
ranged from 0.708 for the comorbidity National
Comprehensive Cancer Network-IPI (cNCCN-IPI) to 0.830 for the lipoprotein prognostic index (Lipo-PI). The c-index was also calculated for the indices that were previously
reported, such as IPI (range 0.67–0.76), revised IPI
(c-index 0.642), and NCCN-IPI (range 0.6950.791). Two
studies pointed to the use of Harrell’s c-index/modified
Clinical Epidemiology downloaded from https://www.dovepress.com/ by 118.70.13.36 on 24-Aug-2020
method as a discrimination method,16,32while one reported
the use of the c-index according to Uno et al.22
Concordance Probability Estimate (CPE)
The discrimination of the newly developed prognostic models and previously developed models was measured
by CPE along with its 95% confidence intervals (CI) in
four of 46 studies.2,3,10,40 A higher CPE indicated better
discrimination. The CPE value was 0.66 for E-IPI,30.781
for a new risk model,40 0.783 for modified NCCN-IPI,10
and 0.8 for NCCN-IPI. For the compared models, the
lowest CPE value was 0.59 for R-IPI,3 while the highest
was 0.76 for NCCN-IPI.40
Bayesian Information Criterion (BIC)
A global measure of fit, the BIC was assessed in two
studies, where lower values of BIC indicate a betterfit.7,32
Akaike
’
s Information Criterion (AIC)
The performance of indices was compared by a measure of
global fit (AIC) in five studies, in which a lower value
indicated a betterfit.2,3,9,31,40The lowest AIC of 662.5 was
-initial database search (n=5239)
-after removing obviously inappropriate studies that analyzed other Non-Hodgkin lymphomas, therapy effect, trials, case reports, commentaries, etc (n=935)
-non English studies (n=91)
-exclusion based on title/abstract (n=268) -non human study (n=2)
-validated indexes created on non-lymphoma populations (n=10)
- evaluated only one type of DLBCL/localized disease/relapsed/refractory DLBCL (n=116) -reviews (n=30)
-studies after manual screening and full text articles evaluated for future eligibility (n=418)
-exclusion based on full-text screening (n=366) -lack of sufficient data for estimating OS (n=5) -nomogram based studies (n=6) for newly diagnosed DLBCL and (n=2) for relapsed/refractory DLBCL
-studies included in final analysis (n=46) - nomogram based studies (n=6)
In total: 52 -studies retrieved through secondary references (n=7)
Figure 1Flowchart representing the selection process of including studies published between 1993 and July 2019.
Clinical Epidemiology downloaded from https://www.dovepress.com/ by 118.70.13.36 on 24-Aug-2020
observed in a new risk model,40 while the highest value
was 4566 in NCCN-IPI.2 Of the compared models, the
highest AIC value was observed in the IPI2and the lowest
in NCCN-IPI.40
Hosmer
–
Lemeshow Goodness of Fit
One study used Hosmer–Lemeshow goodness of fit to
assess calibration, by comparing the proportions of patients whose estimated risk shifted in the correct and
wrong directions on the basis of a χ2-test within
reclas-sified categories for each score separately.36
Relative Brier Score Reduction (RBSR)
One study reported RBSR, which represents a measure of the overall model performance. The lower the Brier score for a set of predictions, the better the predictions are
calibrated.34
Receiver Operating
Characteristics (ROC) Curves
In 11 of 46 studies, the cut-off of a continuously distributed
measurement for OS prediction was defined as the point at
which the sensitivity plus the specificity were maximized in the
ROC curves.15,35,37,40-47One study each used ROC curves to
select the best cut-off of beta-2 microglobulin (B2M),40
C-reactive protein (CRP),44lymphocyte to monocyte ratio,44
platelet to lymphocyte ratio (PLR),45 tumor-infiltrating
T-lymphocyteproportion and ratio between CD4-positive and
CD8-positive T-lymphocytes,48age,35maximum standardized
uptake value,47 and ratio Deauville score.46 In two studies,
ROC was used to assess the albumin level,35,44and in two
the absolute monocyte count and absolute lymphocyte
count.42,43 One study used X-tile software to calculate the
optimal cut-off value for the albumin to globulin ratio.41
Regarding the absolute monocyte count, absolute lym-phocyte count, and platelet level, previously reported
cut-off points were used infive studies.9,33,49-51However, the
majority of studies used institutional upper/lower limits of normal (ULN/LLN) for the continuously distributed
mea-surements, including hemoglobin levels, platelet counts,52
absolute monocyte count, absolute neutrophil count, B2M,
LDH,37B2M,36,45,53,54and lipid levels.16
Three studies used other statistical techniques (eg per-centile value, medians) for testing different cut-off points
of continuous measurements.8,33,55
Difference and Ratio in 3-Year Overall
Survival Between Risk Groups
Fifteen of 46 studies reported 3-year OS for novel prognostic
models, while OS was calculated from Kaplan–Meier curves
for the rest3,9,10,16,31,34,35,39,40,44,52,56-59 (Tables 1–3). Only the minority of studies (six of 46) reported 3-year OS for
compared indices.9,10,31,39,44,52Regarding 3-year OS of the
novel models, the highest ratio between the low- and
high-risk groups was 6,53 while the lowest was 1.31.41 These
studies included 71 and 335 patients, respectively. In six articles the ratio in 3-year OS between low-risk and high-risk groups was not applicable owing to the short follow-up of high-risk patients or there being no surviving patients at 36
months.35,45,47,56,60,61 The difference in 3-year OS ranged
from 18.9%41to 100%56with335 and 105 patients,
respec-tively, being analyzed.
Regarding the IPI, the ratio between risk groups ranged from 1.38 to 7.73, and the difference from 22.9% to 68.8%. The lowest age-adjusted IPI (aaIPI) ratio score between the low-risk and high-risk groups was 2.05 and the highest was 2.48, while the lowest difference was 42.0% and the highest was 53.4%. Regarding NCCN-IPI, the ratio ranged from 1.75 to 3.70, and the difference from 40.9% to 72.9%. Additional information regarding differences and the
ratios of other indices are provided inTables 1–4.
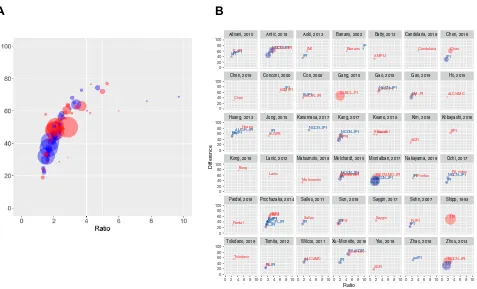
Figure 3AandBshows the graphical presentation of the
ratio and difference, with preferable position close to the upper right point, which indicates better model power. Both Figure 2Graph showing an increasing number of reported studies over the past
two decades.
Clinical Epidemiology downloaded from https://www.dovepress.com/ by 118.70.13.36 on 24-Aug-2020
T
able
1
Summar
y
of
Characteristics
(Number
of
Patients,
3-Y
ear
OS
P
er
Risk
Categor
y,
Differ
ence/Ratio
Betw
een
High-and
Low-Risk
Gr
oups,
and
Additional
Statistics
Used
to
Compar
e
Novel
Model
and
Pr
e
viously
De
veloped
Models)
of
Studies
that
Repor
ted
F
our
-Risk
Categorization
Pr
ognostic
Model
F
our
-Categor
y
Models
IPI
1
aaIPI
≤
60
Y
ears
1
aaIPI
>60
1
Β
2M
IPI
53
E-IPI
3
Salles
et
al
7
Huang
et
al
9
NCCN-IPI
2
No
of
pts
24
2031
1274
761
71
267
284
274
1650
No
of
pts/3-y
ear
OS
(%)
per
gr
oup
L LI HI H 711/(~77.4) 548/(~58.0) 447/(~45.5) 325/(~27.4) 280/(~88.9) 408/(~76.0) 408/(~53.1) 178/(~35.5) 137/NA 236/NA 266/NA 122/NA 28/(~72.0) 6/(~50.0) 6/(~37.0) 31/(~12.0) 72/(86.0) 75/(74.0) 77/(58.0) 43/(36.0) 56/(~94.7) 84/(~86.9) 58/(~64.0) 86/(~49.4) 52/(~97.5) 115/(~87.2) 85/(~69.5) 22/(~49.3) 88/(95.0) 93/(79.0) 69/(40.0) 25/(18.0)
Additional
statistics
24
NA
NA
NA
NA
AIC=1147 CPE=0.66 c-index=0.69 BIC=1145
AIC=771.102
AIC
4566
CPE=0.8
Ratio
(L/H)
2.83
2.48
NA
6.0
2.39
1.92
5.28
1.98
Differe
nce
(L
–
H)
50.0
53.4
NA
60.0
50.0
45.3
77.0
48.2
T
otal
no
of
pts
in
compar
ed
index
NA
NA
NA
IPI
=104
IPI=267 R-IPI=267 aaIPI=267
IPI=347
IPI=274 R-IPI=274 ALC/R-IPI=274
IPI=1650
3-ye
ar
OS
(%)
per
L/H
gr
oup
L H
NA
NA
NA
IPI:
~75.8/~9.8
aaIPI:
NA
IPI:
83.0/43.0
R-IPI:
NA/57.0
aaIPI:
83.0/35.0
IPI:
~84.0/~51.0
IPI:
95.0/45.0
R-IPI:
100.0/
47.0 ALC/R-IPI: 94.0/29.0
IPI:
~93.8/~61.7
Additional
statistics
NA
NA
NA
NA
IPI:
AIC=1155;
CPE=0.63 R-IPI:
AIC=1168;
CPE=0.59 aaIPI:
AIC=1163;
CPE=0.62
c-index=0.67 BIC=1153
IPI: AIC=798.715 R-IPI: AIC=791.263 ALC/R-IPI: AIC=780.935 AIC=4627 CPE=0.74
Ratio
(L/H)
of
compared
index
NA
NA
NA
IPI=7.73
IPI=1.93 aaIPI=2.37
IPI=1.65
IPI=2.11 R-IPI=2.13 ALC/R-IPI=3.24
IPI=1.52
Differe
nce
(L
–
H)
of
compared
index
NA
NA
NA
IPI=66.0
IPI=40.0 aaIPI=48.0
IPI=33.0
IPI=50.0 R-IPI=53.0 ALC/R-IPI=65.0
IPI=32.1
Clinical Epidemiology downloaded from https://www.dovepress.com/ by 118.70.13.36 on 24-Aug-2020
Differe
nce
in
c-statistic
NA
NA
NA
NA
NA
0.02
NA
NA
F
our
-Categor
y
Models
ABE4
31
Nols et
al
60
Melchar
dt
et
al
10
DLBCL-PI
32
aaDLBCL-PI
32
K
ong
et
al
56
Kanemasa et
al
40
M-IPI-R
11
No
of
pts
24
379
73
403
1803
1169
105
274
471
No
of
pts/3-y
ear
OS
(%)
per
gr
oup
L LI HI H 51/(94.0) 125/(77.0) 149/(63.0) 54/(35.0) NA/(~90.0) NA/(~75.6) NA/(~50.0) NA/(~0.0) 99/(97.8) 75/(82.7) 198/(65.9) 31/(44.2) 596/(~92.4) 471/(~76.8) 417/(~58.9) 319/(~44.8) 318/NA 360/NA 296/NA 147+48/NA 65/(100.0) 23/(91.3) 9/(55.6) 8/(0.0) 26/(100.0) 162/(87.0) 50/(57.2) 36/(23.4) 78/(~90.2) 201/(~82.3) 163/(~53.1) 29/(~18.1)
Additional
statistics
24
MoC
0.686
AIC
1304
NA
CPE=0.783
c-index=0.77
c-index=0.79
NA
CPE=0.781 AIC=662.5
NA
Ratio
(L/H)
2.69
NA
2.21
2.07
NA
NA
4.27
4.99
Differe
nce
(L
–
H)
59.0
90.0
53.6
47.6
NA
100
76.6
72.1
T
otal
no
of
pts
in
compar
ed
index
IPI=374 aaIPI=372 E-IPI=372
IPI=73
IPI=499 NCCN-IPI =499
IPI=1990
IPI=NA
IPI=105
NCCN-IPI=274
IPI=499 L197/(~86.7) H
76/(~43.3)
3-ye
ar
OS
(%)
per
L/H
gr
oup
L H
IPI:
83.0/51.0
aaIPI
82.0/40.0
E-IPI:
82.0/41.0
NA
IPI:
90.9/45.0
NCCN-IPI: 97.7/39.5
NA
NA
NA
NCCN-IPI: 100.0/27.1
IPI:
~86.7/~43.3
Additional
statistics
IPI:
AIC=1336;
MoC=0.635 aaIPI:
AIC=1325;
MoC=0.650 E-IPI:
AIC=1292;
MoC=0.665
NA
IPI:
CPE=0.713
NCCN-IPI: CPE=0.753
c-index=0.73
c-index=0.76
NA
CPE=0.760 AIC=678.1
NA
Ratio
(L/H)
of
compared
index
IPI=1.63 aaIPI=2.05 E-IPI=2.0
NA
IPI=2.02 NCCN-IPI =2.47
NA
NA
NA
NCCN-IPI =3.69
IPI=2.0
Differe
nce
(L
–
H)
of
compared
index
IPI=32.0 aaIPI=42.0 E-IPI=41.0
NA
IPI=45.9 NCCN-IPI =58.2
NA
NA
NA
NCCN-IPI =72.9
IPI=43.4
(
Continued
)
Clinical Epidemiology downloaded from https://www.dovepress.com/ by 118.70.13.36 on 24-Aug-2020
T
able
1
(Continued).
F
our
-Categor
y
Models
IPI
1
aaIPI
≤
60
Y
ears
1
aaIPI
>60
1
Β
2M
IPI
53
E-IPI
3
Salles
et
al
7
Huang
et
al
9
NCCN-IPI
2
Differe
nce
in
c-statistic
NA
NA
NA
0.04
0.03
IPI=499
NA
NA
F
our
-Categor
y
Models
KPI
34
AC
A
35
GEL
T
AMO-IPI
36
Kang
et
al
38
ICPS
44
cNCCN-IPI
39
LIPO-PI
16
Li et
al
47
T
oledano
et
al
46
No
of
pts
24
323
555
1672
621
564
958
367
NA
181
No
of
pts/3-y
ear
OS
(%)
per
gr
oup
L LI HI H 105/(96.4) 138/(84.7) 36/(63.8) 44/(33.3) 181/(86.0) 224/(72.0) 132/(51.0) 18/(0.0) 190/(~96.6) 972/(~84.6) 284/(~69.6) 226/(~46.3) 146/(~96.4) 153/(~89.4) 233/(~71.3) 89/(~54.4) 202/(95.6) 144/(88.2) 99/(76.0) 119/(62.2) 33/(100.0) 330/(86.0) 475/(63.0) 120/(27.0) NA/(98.0) NA/(82.8) NA/(50.0) NA/(34.3)
NA/ ~83.7 NA/ ~43.2 NA/ ~38.0 NA/ NA 80/(~87.8) 63/(~63.4) 9/(~43.7) 29/(~29.0)
Additional
statistics
24
c-index=0.740 RBSR=30.5%
NA
χ
2=9.54; p=0.299
c-index=0.739
NA
c-index=0.708
c-index=0.830
NA
NA
Ratio
(L/H)
2.89
NA
2.09
1.77
1.54
3.7
2.86
NA
2.71
Differe
nce
(L
–
H)
63.1
86
50.3
42.0
33.4
63.0
63.7
NA
55.4
T
otal
no
of
pts
in
compar
ed
index
R-IPI=NA NCCN-IPI=NA
IPI=NA
IPI=1764 NCCN-IPI =1777 IPI=621 NCCN-IPI=621
IPI=564
IPI=962 NCCN-IPI=962
NCCN-IPI=NA
IPI=77
IPI=181
3-ye
ar
OS
(%)
per
L/H
gr
oup
L H
NA
NA
IPI:
~91.9/
~54.7 NCCN-IPI: ~95.3/~54.4
IPI:
~90.2/~53.3
NCCN-IPI: ~95.6/
~39.3
IPI:
87.6/51.5
IPI:
84.0/39.0
NCCN-IPI: 91.0/27.0 NCCN-IPI: 100.0/31.9
NA
NA
Additional
statistics
R-IPI: c-index=0.642 RBSR=13.5% NCCN-IPI: c-index=0.736 RBSR=25.1%
NA
χ
2=16.4; p=0.037
IPI:
c-index=0.705
NCCN-IPI:
c-index=0.710
NA
IPI:
c-index=0.687
NCCN-IPI: c-index=0.695
c-index=0.791
NA
NA
Clinical Epidemiology downloaded from https://www.dovepress.com/ by 118.70.13.36 on 24-Aug-2020
parts of thefigure allow the visual comparison of different models owing to their position with the identical range on
theXandYaxes. The studies with a larger number of patients
had lower variability than the studies with a limited number
of patients (Figure 3A,B). Furthermore, it was observed that
the IPI in different studies tends to have a lower difference and ratio (Figure 3B).
Prognostic Models Based on Nomograms
A total of six studies proposed prognostic models for DLBCL patients based on calculated individual risk
using nomograms (Table 4).25–27,29,30 In all studies, the
predictive accuracy of the nomogram was evaluated using discrimination and/or calibration. Three studies used split-ting of the analyzed population into training and validation
sets.26–28 One study combined the machine learning
method, known as a stacking algorithm, with clinical data obtained from nationwide lymphoma registries in order to develop a stacking-based prognostic model,
which was superior to both IPI and NCCN-IPI.28
All nomogram-based studies reported the c-index25–30
and one study also applied integrated Brier score (IBS).28
Two studies reported the c-index for estimating
progression-free survival.25,30 The nomogram and other prognostic
indices were compared with the 2 log likelihood (2LL) and
the AIC in terms of goodness offit in one study.29Calibration
plots were reported in three nomogram studies26,27,29,while
one study applied Hosmer–Lemeshow goodness of fit to
assess calibration .25New models were typically compared
with established indices such as IPI, NCCN-IPI, and R-IPI.
Discussion
Our review shows that a large number of new prognostic models for patients with DLBCL have been proposed, aiming at improving the discriminative power compared to the IPI. However, general application of the majority of these new prognostic models has been prevented because of a lack of validation, limited number of analyzed
patients, and other statistical difficulties regarding model
development. The most commonly validated models used for prognostication as well as for the comparison with
other novel models were IPI, R-IPI, and NCCN-IPI.24
Among these, NCCN-IPI had the highest performance values, although the performance of models based on nomograms was superior to the NCCN-IPI. However, these models are relatively new and have not been vali-dated in other study populations.
Ratio (L/H) of compared index NA NA
IPI=1.68 NCCN-IPI =1.75 IPI=1.69 NCCN-IPI=2.43 IPI=1.7 IPI=2.15 NCCN-IP=3.37 NCCN-IPI =3.13 NA NA Differe nce (L – H) of compared index NA NA
IPI=37.2 NCCN-IPI =40.9 IPI=36.9 NCCN-IPI=56.3 IPI=36.1 IPI=45.0 NCCN-IPI=64.0 NCCN-IPI =68.1 NA NA Differe nce in c-statistic KPI vs R-IPI=0.098 KPI vs NCCN-IPI =0.004 NA NA Ne w index vs IPI=0.034 Ne w index vs NCCN-IPI=0.029 NA cNCCN-IPI vs NCCN-IPI=0.013 cNCCN-IPI vs IPI=0.021 0.039 NA NA Abbre viations: aaDLBCL-PI, age-adjusted DLBCL-PI; aaIPI, age-adjusted IPI; ABE4, age, bulk, Eastern Cooperativ e Oncology Gr oup (ECOG); A C A, age, comorbidity , albumin; AIC , Akaik e ’ s information criterion; ALC, absolute lymphocyte count; B2M, beta-2 micr oglobulin; BIC , Ba yesian information criterion; c-index, concordance index; cNCCN-IPI, comorbidity NCCN-IPI ; CPE, concor dance pr obability estimate; DLBCL-PI, diffuse large B-cell lymphoma pr ognostic index; E-IPI, elderly IPI; H, high; HI, high – intermediate; I, intermediate; ICPS, in fl ammation-based cumulativ e pr ognostic score system; IPI, International Pr ognostic Index; KPI, K yoto Pr ognostic Index; L, low; LI, low – intermediate; LIPO-PI, lipopr otein pr ognostic index; M-IPI-R, molecularly adjusted IPI for R-CHOP; MoC , measur e of concordance; NA, not applicab le; NCCN-IPI, National Compr ehensiv e Cancer Netw ork; no , number ; OS, ov erall sur vival; pts, patients; RBSR, re lativ e Brier scor e re duction; R-IPI, re vised IPI.
Clinical Epidemiology downloaded from https://www.dovepress.com/ by 118.70.13.36 on 24-Aug-2020
T able 2 Summar y of Characteristics (Number of Patients, 3-Y ear OS P er Risk Categor y, Differ ence/Ratio Betw een High-and Low-Risk Gr oups, and Additional Statistics Used to Compar e Novel Model and Pr e viously De veloped Models) of Studies that Repor ted Thr ee-Risk Categorization Pr ognostic Model Thr ee-Categor y Models Barrans et al 13 R-IPI 4 ALC/R-IPI 55 ALC/ AMC 42 IMI 49 AMPLI 50 ABE3 31 Melchar dt et al 10 L-GPS 14 No of pts 24 155 365 88 366 229 245 379 353 213 No of pts/3-y ear OS (%) per gr oup
L I H
75/(~77.0) 24/(~50.5) 56/(~18.2) 37/ (~94.2) 164/ (~79.8) 164/(60.9) 39/(~90.4) 31/(~65.0) 18/(~52.6) 119/(~88.5) 186/(~71.2) 61/(~41.2)
128/ (~86.8) 89/ (~61.5) 12/ (~28.1) 105/(~92.0) 119/)~76.0) 21/(~60.0)
87/(92.0) 231/(67.0) 61/(36.0) 42/(94.2) 246/(69.3) 65/(39.5) 76/~91.8 108/~74.3 29/~39.8
Additional statistics 24 NA NA NA NA NA NA NA NA Ratio (L/H) 4.23 1.55 1.72 2.15 3.09 1.53 2.55 2.38 2.31 Differe nce (L – H) 58.8 33.3 37.8 47.3 58.7 32.0 56.0 54.7 52.0 T otal no of pts in compared index IPI=143 IPI=365 R-IPI=88 IPI=366 IPI=229 IPI=244 R-IPI=374 ALC/R-IPI=374 The same as T able 4 IPI=213 3-ye ar OS (%) per L/H gr oup L H IPI: ~76.7/ ~7.9 IPI: ~83.0/ ~60.1 R-IPI: ~100.0/ 58.1 IPI: ~86.0/ ~42.4 IPI: ~86.5/ ~51.8 IPI: ~86.7/NA R-IPI: 80.0/58.0 ALC/R-IPI: 80.0/50.0 IPI: ~91.5/~30.5 Additional statistics NA NA NA NA NA NA R-IPI: AIC 1340; MoC=0.605 ALC/R-IPI: AIC 1337; MoC=0.619 NA Ratio (L/H) of compared index IPI=9.71 IPI=1.38 R-IPI=1.72 IPI=2.03 IPI=1.67 NA R-IPI=1.38 ALC/R-IPI=1.6 IPI=3.0 Differe nce (L – H) of compared index IPI=68.8 IPI=22.9 R-IPI=41.9 IPI=43.6 IPI=34.7 NA R-IPI=22.0 ALC/R-IPI=30.0 IPI=61.6 Differe nce in c-statistic NA NA NA NA NA NA NA NA Thr ee-Categor y Models
ALC/ AMC PS
43 Sa ygin et al 6 P A index 51 Candelaria et al 54 IA CA 61 Matsumoto et al 58 Zhao et al 45 Chen et al 48 K eane et al 33
HP index 52
DM-PI 59 No of pts 24 148 312 391 131 99 185 309 66 141 89 553
Clinical Epidemiology downloaded from https://www.dovepress.com/ by 118.70.13.36 on 24-Aug-2020
No of pts/3-y ear OS (%) per gr oup
L I H
39/(~94.3) 79/(~72.5) 30/(~50.3)
111/ (~88.7) 174/(~69/ 6) 27/ (~43.5) 243/(~88.9) 125/(~54.4) 23/(26.7)
58/(80.0) 43/(55.5) 30/(19.8) 39/NA 44/NA 16/NA 79/(94.6) 81/(82.0) 25/(61.4) NA/(~88.0) NA/(~54.5) NA/(0.0) 206/ (96.1) 266/ (74.8) 81/(49.4) NA/ (~48.1) NA/ (~40.4) NA/ (~16.9) 42/(79) 39/(52) 8/(30)
NA/(~97.2) NA/(~57.8) NA/(~41.1)
Additional statistics 24 NA NA NA NA NA NA NA NA NA NA A UC=0.752 Ratio (L/H) 1.87 2.04 3.39 4.04 NA 1.54 NA 2.85 2.36 2.63 1.94 Differe nce (L – H) 44.0 45.2 62.2 60.2 NA 33.2 88.0 31.2 56.1 49.0 46.7 T otal no of pts in compared index IPI=148 IPI=413 IPI=391 NCCN-IPI=391 IPI=141 A C A=99 NA IPI=309 aaIPI=NA R-IPI=55 NA IPI=89 IPI=553 3-ye ar OS (%) per L/ H gr oup L H NA NA IPI: ~90.4/~56.8 NCCN-IPI: ~100.0/~49.6 NA NA NA IPI: ~59.9/NA aaIPI: ~90.0/~38.1 NA NA
IPI: 87.0/ 38.0
IPI: 92.8/ 51.8 Additional statistics NA NA NA NA NA NA NA NA NA NA A UC=0.732 Ratio (L/H) of compared index NA NA IPI=1.59 NCCN-IPI=2.0 NA NA NA aaIPI=2.36 NA NA IPI=2.29 IPI=1.79 Differe nce (L – H) of compared index NA NA IPI=33.6 NCCN-IPI=50.4 NA NA NA aaIPI=51.9 NA NA IPI=49.0 IPI=41.0 Differe nce in c-statistic NA NA NA NA NA NA NA NA NA NA A UC=0.02 Abbre viations: aaIPI, age-adjusted IPI; ABE3, age, bulk, Eastern Cooperativ e Oncology Gr oup (ECOG); A C A, age, comorbidity , albumin; AIC , Akaik e ’ s information criterion; ALC , absolute lymphocyte count; ALC/AMC PS, ALC/AMC pr ognostic index; AMC , absolute monocyte count; AMPLI, absolute monocyte and lymphocyte pr ognostic index; A UC , ar ea under the cur ve; c-index, conc ordance index; DM-PI, diabetes mellitus pr ognostic index; H, high; HP index, hemoglobin platelet index; I, intermediate; IA C A, IADL (instrumental activities of daily living) and age, comorbidity , albumin; IMI, immunologic al index; IPI, International Pr ognostic Index; L, low; L-GPS, lactate deh ydr ogenase (LDH) plus Glasgow Pr ognostic Index; MoC , measur e of concor dance; NA, not applicable; NCCN-IPI, National Compr ehensiv e Cancer Netw ork IPI; no , number ; OS, ov erall sur vival; PA index, platelet albumin index; pts, patients; R-IPI, re vised IPI.
Clinical Epidemiology downloaded from https://www.dovepress.com/ by 118.70.13.36 on 24-Aug-2020
T able 3 Summar y of Characteristics (Number of Patients, 3-Y ear OS P er Risk Categor y, Differ ence/Ratio Betw een High-and Low-Risk Gr oups, and Additional Statistics Used to Compar e Novel Model and Pr e viously De veloped Models) of Studies that Repor ted T w o-and Fiv e-Risk Categorization Pr ognostic Model T w o-Categor y Models SIL 8 Lanic et al 12 P ar dal et al 57 AG R 15 AG R 41 LAR 33 Fiv e-Categor y Models Chen et al 37 IPI +CD37 –+ABC 11 IPI+IHC 11 No of pts 24 366 45 108 232 335 210 817 471 453 No of pts/3-y ear OS (%) per gr oup L H 245/(~92.4) 121/(~68.5) 24/(~91.0) 21/(~37.0) NA/(58.0) NA/(25.0) 139/ (~75.2) 93/ (~46.6) 188/ (~78.9) 147/ (~60.0) NA/ (~86.4) NA/ (~57.9) L LI HI H VH 106/(~98.9) 196/(~93.8) 172/(~88.9) 310/(~71.4) 33/(~38.5) 54/(~94.3) 157/(~86.1) 97/(~70.5) 135/(~49.8) 28/(~19.9) 88/(~94.2) 126/(~82.1) 149/(~66.4) 74/(~34.0) 16/NA
Additional statistics 24 NA NA NA NA NA NA c-index=0.75 NA NA Ratio (L/H) 1.35 2.46 2.32 1.61 1.31 1.48 2.79 4.7 NA Differe nce (L – H) 23.9 54.0 33.0 28.6 18.9 57.9 60.4 74.4 NA T otal no of pts in compar ed index IPI=366 R-IPI=366 aaIPI=57 R-IPI=245 IPI=93 IPI=335 IPI=206 IPI=817 IPI=499 The same as pr e vious 3-ye ar OS (%) per L/H gr oup L H IPI: NA R-IPI: ~95.9/ ~71.3 NA NA NA NA NA IPI:~95.8/ ~66.0 IPI: ~86.7/~43.3 Additional statistics NA NA NA NA NA NA c-index=0.71 NA NA Ratio (L/H) of compared index R-IPI=1.34 NA NA NA NA NA IPI=1.45 IPI=2.0 NA Differe nce (L – H) of compared index R-IPI=24.6 NA NA NA NA NA IPI=29.8 IPI=43.4 NA Differe nce in c-statistic NA NA NA NA NA NA NA NA NA Abbre viations: aaIPI, age-adjusted IPI; ABE, age, bulk, Eastern Cooperativ e Oncology Gr oup (ECOG); A GR, albumin to globulin ratio; c-index, concordance index; H, high; IPI, International Pr ognostic Index; IPI+IHC , IPI + immunohistochemistr y; L, low; LAR, lactate deh ydr ogenase (LDH) to absolute lymphocyte count ratio; NA, not applicable; no , number ; OS, ov erall sur vival; pts, patients; R-IPI, re vised IPI; SIL, soluble interleukin.
Clinical Epidemiology downloaded from https://www.dovepress.com/ by 118.70.13.36 on 24-Aug-2020
T able 4 Summar y of Characteristics (Number of Patients, Additional Statistics Used to Compar e Novel Model and Pr e viously De veloped Models) of Studies that Used Nomograms Nomog ram Han et al 27 Biccler et al 28 Zhong et al 26 Cho w et al 25 Go et al 29 Go et al 30 No of pts 1070 5173 538 76 187 232 T est/validation gr oup 748/322 2759/2414 228/310 Internal validation (PFS) Additional statistics c-index=0.77 (5-y ear) Calibration plot/ cur ve
c-index=0.756 IBS=0.131 Time-var
ying AU C c-index=0.81 (2-yea r) Calibration plot/cur ve c-index=0.81 Hosmer and Lemeshow c-index=0.80 AIC=599.77 – 611.77 Calibration plot c-index=0.79 Ratio/difference NA NA NA NA NA NA T otal no of pts in compare d index
IPI=748 R-IPI=748 NCCN-IPI=748
IPI:
NA
NCCN-IPI:
NA
IPI=228 NCCN-IPI=228 ICPS=228 Infl
ammator
y
IPI=179
IPI=76
IPI=187 R-IPI=187 NCCN-IPI=187 IPI=232 R-IPI=232 NCCN-IPI=232
3-ye ar OS (%) per L/H gr oup L H IPI: 78.6/37.8 R-IPI: 91.5/43.5 NCCN-IPI: 85.1/ 38.7 NA IPI: 92.6/59.2 NCCN-IPI: 93.7/60.1 ICPS: 97.1/66.2 In fl ammator y IPI: 95.9/54.7 NA NA NA Additional statistics IPI: c-index=0.73 R-IPI: c-index=0.70 NCCN-IPI: c-index=0.71 IPI: IBS=0.150
c-index=0.662 NCCN-IPI: IBS=0.144 c-index=0.681
IPI: c-index=0.72 NCCN-IPI: c-index=0.72 ICPS: c-index=0.69 In fl ammator y IPI: c-index=0.69 c-index=0.75 IPI: − 2LL 613.41, AIC 615.41, c-index=0.77 R-IPI: − 2LL=630.47; AIC=632.47; c-index=0.74 NCCN-IPI:-2LL 614.18; AIC 616.18; c-index 0.77 IPI: c-index=0.74
R-IPI: c-index=0.71 NCCN-IPI: c-index=0.75
Ratio IPI=2.08; R-IPI=2.1; NCCN-IPI=2.2 NA IPI=1.56; In fl ammator y IPI=1.75, NCCN-IPI=1.56; ICPS=1.47 NA NA NA Differ ence
IPI=40.8; R-IPI=48.0; NCCN-IPI=46.4
NA IPI=33.4; In fl ammator y IPI=41.2; NCCN-IPI=33.6; ICPS=1.47 NA NA NA Differ ence in c-statistic N vs IPI=0.04 N vs R-IPI=0.07 N vs NCCN-IPI =0.06 N vs IPI=0.094 N vs NCCN-IPI =0.075 N vs IPI=0.09 N vs NCCN-IPI=0.09 Nv sI n fl ammator y IPI=0.12 N vs ICPS=0.12 N vs IPI=0.06 N vs IPI=0.03 N vs R-IPI=0.06 N vs NCCN-IPI=0.03 N vs IPI=0.05 N vs R-IPI=0.08 N vs NCCN-IPI =0.04 Abbre viations: AIC , Akaik e ’ s information criterion; AUC, area under the cur ve; c-index, concordance index; H, high; IBS, integrated Brier scor e; ICPS, in fl ammation-based cumulative pr ognostic score system; IPI, International Pr ognostic Index; L, low; 2LL, 2 log lik elihood; N, nomogram; NA, not applicable; NCCN-IPI, National Compr ehensive Cancer Netw ork-IPI; no , number ; OS, ov erall sur vival; PFS, pr ogr ession-fr ee surviv al; pts, patients; R-IPI, Revis ed IPI.
Clinical Epidemiology downloaded from https://www.dovepress.com/ by 118.70.13.36 on 24-Aug-2020
The traditional splitting of data into the training and validation data sets when developing a new model was used in only 19% of studies. Using the training data set, it is possible to construct an initial prediction model, the accu-racy of which is then assessed using the validation set. However, the usefulness of any model actually depends on its accuracy, ie the ability of the model to correctly identify
each patient’s outcome.17To report the discrimination
(accu-racy) value of the model, seven studies plus all studies based on nomograms used the concordance (c) statistic, which is
conceptually similar to the ROC curve.17The c-index scores
between 0.5 (no discrimination) and 1.0 (perfect
discrimination).20The value of the c-index for novel
prog-nostic models ranged from 0.708, indicating a good model, to 0.830, indicating a strong model. However, the c-index for the widely applied indices such as IPI, R-IPI, and NCCN-IPI had the lowest value of only approximately 0.6, which
defines low discrimination powers. In the analyzed studies
the c-index refers to time-to-event outcome (OS). In such analyses, the c-index and its interpretation are less well established than a binary outcome, since some patients had
not experienced an event at the time of analysis.17There is no
consensus on how to handle time-to-event data, because this
requires exclusion of censored patients or using indirect estimates of survival, based on the regression model, with
a tendency to give lower c-statistics than other methods.17,62
Another issue with the c-statistic is that it measures discri-mination and not calibration, which is the agreement between
observed outcomes and predictions.17 The c-statistic is not
a good measure of the actual probability of events if only
a small number of patients experience the event of interest.17
In addition, four studies reported CPE in order to evaluate the discriminatory power and the predictive accuracy of
non-linear statistical models.2,3,10,40 An early estimate of the
concordance probability, which was the predominant
discri-mination statistic adapted for survival analysis, was Harrell’s
c-index, used in three studies.16,25,32,63 However, Harrell’s
c-index was influenced by the rate of patient accrual and the
length of the study. To avoid this limitation, Uno et al intro-duced inverse probability censoring weights to the c-index.
This method was used in one study.22,33,39
In six studies, the performance of indices was compared
using the AIC.2,3,9,29,40,64To compare the quality of a set of
statistical models (to perform model comparisons) with each
other, two studies used another criterion for model selection–
the BIC, which measures the trade-off between modelfit and
IPIaaIPIE−IPI
Chen
IPI R−IPIALC/R−IPI
Huang
Kong
Pardal
Toledano IPI
NCCN−IPIcNCCN−IPI
b2M IPIIPI
L−GPSIPI
Lanic
R−IPIALC/R−IPIIPI E−IPI aaIPI ABE3ABE4
R−IPI SIL
IPI IMI
ALC/R−IPI R−IPI
NCCN−IPI
Matsumoto
IPISalles
IPI ALC/AMC
BarransIP
DLBCL−PI
IPIKang NCCN−IPI
IPIMelchardt1Melchardt2NCCN−IPI
ICPS IPI
IPI IPI+CD37−M−IPI−R
AMPLI
LIPO−PINCCN−IPI
Keane2Keane1
IPINCCN−IPIGELTAMO−IPI
Saygin
AGR
Candelaria
IPIDM−PI
AGR
IPIHP index
IPIR−IPI
aaIPI IPI
Chen
ALC/AMC
KPI
IPI NCCN−IPIPA index
IPI
IPI NCCN−IPI
Toledano, 2019 Tomita, 2012 Wilcox, 2011 Xu−Monette, 2016 Yue, 2018 Zhao, 2018 Zhou, 2014 Pardal, 2018 Prochazaka, 2014 Salles, 2011 Sun, 2018 Saygin, 2017 Sehn, 2007 Shipp, 1993 Kong, 2016 Lanic, 2012 Matsumoto, 2018 Melchardt, 2015 Montalban, 2017 Nakayama, 2019 Ochi, 2017 Huang, 2013 Jung, 2015 Kanemasa, 2017 Kang, 2017 Keane, 2018 Kim, 2018 Kobayashi, 2016
Chen, 2019 Conconi, 2000 Cox, 2008 Gang, 2015 Gao, 2018 Gao, 2019 Ho, 2015 Advani, 2010 Antic, 2018 Aoki, 2013 Barrans, 2002 Batty, 2013 Candelaria, 2018 Chen, 2016
0 2 4 6 8 10 0 2 4 6 8 10 0 2 4 6 8 10 0 2 4 6 8 10 0 2 4 6 8 10 0 2 4 6 8 10 0 2 4 6 8 10 0
20 40 60 80 100
0 20 40 60 80 100
0 20 40 60 80 100
0 20 40 60 80 100
0 20 40 60 80 100
0 20 40 60 80 100
Ratio
Diff
erence
A
B
Figure 3Graphical presentation of difference and ratio between high- and low-risk groups of novel models (red circles) and previously reported (compared) models (blue
circles). (A) Difference/ratio presentation of all models and (B) each study. Ratio is presented on the x-axis, while difference is presented on the y-axis and is expressed in
percentages. Larger circles indicate a larger study population, while the closeness to the right upper point indicates a bigger difference and ratio between compared groups.
Clinical Epidemiology downloaded from https://www.dovepress.com/ by 118.70.13.36 on 24-Aug-2020
complexity of the model.7,18,32Both BIC and AIC balance
the level offit (based on the log-likelihood, a basic estimate
offit) with model complexity. Furthermore, the formula for
the BIC is similar to the formula for the AIC, but with
a different penalty for the number of parameters.18 Lower
AIC and BIC values are preferred, and indicate a more
explanatory and informative model.64The AIC is the
com-monly used model selection tool for choosing between alter-native models and has a preference for more complex models compared to the BIC, owing to its ability to eliminate unne-cessarily complicated models, which contain too many
para-meters for accurate estimation on a given data set.64
However, the AIC takes into account each model and ranks them from the best to worst, then it chooses between the
models based on the goodness offit using the lowest number
of variables that explains the outcome best. This means that if all models are poor, it will choose the best of these, because
quality is not taken into account.65 Furthermore, when the
sample size is small, there is a high probability that the AIC will select models that have too many parameters, leading to
overfitting. To address such potential overfitting, alternative
versions of the AIC have been proposed to make it easier to compare models estimated on different data sets of varying
sizes.66
Two studies used the Hosmer–Lemeshow test goodness
of fit to assess calibration.25,36,67 Models are well
cali-brated if expected and observed event rates in subgroups of risk models are similar. The main limitations of this test are that it is based on an arbitrary grouping of observa-tions, it has poor power in small data sets, and the result is
expressed only in a p-value.68 In addition, three models
used a calibration plot, described as a graphical illustration
of the Hosmer–Lemeshow test, which is another method to
assess calibration in which the observed event status is plotted against the predicted risk estimates. The plot is often supplied with a calibration curve to help to diagnose
a lack of fit, and will lie on the 45-degree line in a
well-calibrated model.68,69 Some authors have suggested the
use of the calibration slope, which, in addition to the
p-value, provides a confidence interval and a measure of
size of effect, since the estimated slope is obtained from the regression model and does not require the patients to be grouped. Therefore, the calibration slope does not
suf-fer from the limitations of the Hosmer–Lemeshow test.68
To determine the optimal cut-off point for contin-uous measurements for predicting OS, 11 of 46 studies used the ROC curve, which maximizes the likelihood
ratio.15,35,37,40–47 The ROC curve analysis has earned
a place in biomedical studies when interpreting the results of diagnostic accuracy of a continuous marker. The performance of a marker is evaluated by the area under the ROC curve (AUC), an indicator of overall
“accuracy”, in which a higher AUC value indicates
a better performance. However, there is variation in
the sensitivity and specificity from point to point
along the ROC curve and therefore it is important to consider the aims of diagnostic tests with respect to the
significance and costs of a false-positive or negative
interpretation.70 Regarding the cut-off points of
contin-uous variables used in prognostic models in DLBCL, it is obvious that different thresholds based on ROC results were incorporated in the models, where an
addi-tional five studies used cut-off points that had already
been reported.9,33,49–51However, in ROC, one’s choice
of the value based on specificity and sensitivity can
largely depend on the data set, meaning that the opti-mal cut-off value in one population might not be the optimal value in another.
Because of the lack of comparisons between prognostic models and the use of a variety of statistical methods for model comparison, it was not possible to make a universal compar-ison. Therefore, we have chosen to compare models by using very simple tools: the difference and proportion between scores among low-risk and high-risk groups. The bigger the observed value between the low- and high-risk groups, the
better the model’s power. However, the number of patients in
the high-risk group has a major impact on the results. Hence, it is not surprising that the highest ratio was observed in a study including just 73 patients, while the highest difference was observed in a study that analyzed 337 patients. However, these tools have pointed to the rather limited power of the IPI, as well as the lower prognostic value of models developed in a limited number of patients. Although these are simple meth-ods of comparison, they can give a false impression of super-iority of one model, possibly due to a limited number of patients in high-risk groups or relatively short follow-up. Thus, they should be used as an addition to other performance measures and not as the primary method of comparison owing to these limitations. The studies that used nomograms pre-sented a visual representation of a statistically predictive model that estimates the probability of a clinical event by calculating the cumulative effect of weighted independent
variables.71 Although these models cannot be compared by
the ratio or difference because they do not use risk categories, they provide the discrimination and/or calibration to compare different prognostic models. Irrespective of the fact that that
Clinical Epidemiology downloaded from https://www.dovepress.com/ by 118.70.13.36 on 24-Aug-2020
these complex models did not entirely fulfill our inclusion criteria, their recognition indicates the current trend towards more individualized prognostication. This is mainly due to the fact that grouping of patients into risk categories results in an ineffective use of the data and tends to reduce the predictive accuracy of a prognostic model. In addition, the complexity of
nomograms can be offset by using electronic versions.72Still,
there are no guidelines regarding which value could be used in decision making when nomograms are used for prognostica-tion. However, it would advance clinical application if future studies evaluated nomograms in the risk-adapted therapeutic
strategies.26Nevertheless, due to other limitations of
nomo-grams, the focus of future studies, besides developing new models, should be validation of the existing prognostic
models.73
In addition, one study developed a prognostic model by combining data from a clinical database with machine learning
techniques.28 The stacking algorithm, used in the study, is
a way of ensembling multiple regression models to obtain
survival curves, eliminating the need for the specification of
one prognostic modeling approach.74Although the machine
learning technique is not a new concept, it is gaining more
attention in the classification, prognostication, and genetic
analysis of DLBCL.28,75,76It is evident that the clinical and
genetic heterogeneity of DLBCL, as well as overlapping of
DLBCL subgroup classifications, represent significant
chal-lenges for accurate outcomes prediction.74 To provide
a prediction of clinically relevant outcomes for patients with DLBCL, future studies will likely have to combine different factors (clinical, sociodemographic, tumor microenvironment, genetic, etc), possibly with the aid of the machine learning and high-dimensional data analysis or other statistical methods in order to develop comprehensive, multilevel prognostic models
that should be easily applicable in clinical care.74
Conclusion
Although an increasing number of prognostic models for DLBCL has emerged in the past two decades, there is no universally accepted statistical method of reporting prognos-tic models in DLBCL. When reporting a new prognosprognos-tic model, we would recommend assessing the discrimination and calibration of the prognostic model. Other measures of its performance may be used when adding a novel predictor
to an established model.19 In addition, comparisons of
dif-ferent available prognostic models based on the same popu-lation should be provided. This is needed in order to avoid the vagueness that currently exists in the literature, owing to an inability to compare current prognostic models in DLBCL.
Furthermore, to adapt models to a more individualized approach, an increasing number of models based on nomo-grams has been published. These models generally report the discrimination and calibration in order to compare the novel model with previous models, and tend to have higher pre-dictive accuracy by avoiding potential loss of information due to the omission of risk categorization. However, future prognostication studies that integrate advances in statistics with growing knowledge on the diagnostics, pathology, and therapy of DLBCL are necessary.
Acknowledgment
This work is dedicated to our teacher and dear friend Professor Goran Trajkovic, who died too early.
Author Contributions
All authors made substantial contributions to conception and design, acquisition of data, or analysis and interpreta-tion of data; took part in drafting the article or revising it
critically for important intellectual content; gave final
approval of the version to be published; and agree to be accountable for all aspects of the work.
Disclosure
The authors report no conflicts of interest in this work.
References
1. Shipp MA. A predictive model for aggressive non-hodgkin’s lym-phoma. the international non-hodgkin’s lymphoma prognostic factors
project.N Engl J Med.1993;329:987–994.
2. Zhou Z, Sehn LH, Rademaker AW, et al. An enhanced international prognostic index (NCCN-IPI) for patients with diffuse large B-cell
lymphoma treated in the rituximab era.Blood.2014;123(6):837–842.
doi:10.1182/blood-2013-09-524108
3. Advani RH, Chen H, Habermann TM, et al. Comparison of conven-tional prognostic indices in patients older than 60 years with diffuse large B-cell lymphoma treated with R-CHOP in the US Intergroup Study (ECOG 4494, CALGB 9793): consideration of age greater than
70 years in an elderly prognostic index (E-IPI). Br J Haematol.
2010;151(2):143–151. doi:10.1111/j.1365-2141.2010.08331.x
4. Sehn LH, Berry B, Chhanabhai M, et al. The revised international prog-nostic index (R-IPI) is a better predictor of outcome than the standard IPI for patients with diffuse large B-cell lymphoma treated with R-CHOP.
Blood.2007;109(5):1857–1861. doi:10.1182/blood-2006-08-038257
5. Hong J, Kim SJ, Chang MH, et al. Improved prognostic stratification
using NCCN- and GELTAMO-international prognostic index in
patients with diffuse large B-cell lymphoma. Oncotarget. 2017;8
(54):92171–92182. doi:10.18632/oncotarget.20988
6. Saygin C, Jia X, Hill B, et al. Impact of comorbidities on outcomes of
elderly patients with diffuse large B-cell lymphoma.Am J Hematol.
2017;92:989–996.
7. Salles G, de Jong D, Xie W, et al. Prognostic significance of
immu-nohistochemical biomarkers in diffuse large B-cell lymphoma: a study
from the lunenburg lymphoma biomarker consortium. Blood.
2011;117:7070–7078.
Clinical Epidemiology downloaded from https://www.dovepress.com/ by 118.70.13.36 on 24-Aug-2020
8. Tomita N, Sakai R, Fujisawa S, et al. SIL index, comprising stage, soluble interleukin-2 receptor, and lactate dehydrogenase, is a useful
prognostic predictor in diffuse large B-cell lymphoma.Cancer Sci.
2012;103:1518–1523.
9. Huang Y-C, Liu C-Y, Lu H-J, et al. Comparison of prognostic models for patients with diffuse large B-cell lymphoma in the rituximab era.
Ann Hematol.2013;92:1513–1520.
10. Melchardt T, Troppan K, Weiss L, et al. A modified scoring of the
NCCN-IPI is more accurate in the elderly and is improved by
albu-min andβ2 -microglobulin.Br J Haematol.2015;168(2):239–245.
doi:10.1111/bjh.13116
11. Xu-Monette ZY, Li L, Byrd JC, et al. Assessment of CD37 B-cell
antigen and cell-of-origin significantly improves risk prediction in
diffuse large B-cell lymphoma. Blood. 2016;128(26):3083–3100.
doi:10.1182/blood-2016-05-715094
12. Lanic H, Mareschal S, Mechken F, et al. Interim positron emission tomography scan associated with international prognostic index and germinal center B cell-like signature as prognostic index in diffuse
large B-cell lymphoma.Leuk Lymphoma.2012;53(1):34–42. doi:10.
3109/10428194.2011.600482
13. Barrans SL, Carter I, Owen RG, et al. Germinal center phenotype and bcl-2 expression combined with the International Prognostic Index
improves patient risk stratification in diffuse large B-cell lymphoma.
Blood.2002;99(4):1136–1143. doi:10.1182/blood.V99.4.1136
14. Jung S-H, Yang D-H, Ahn J-S, Kim Y-K, Kim H-J, Lee -J-J. Serum
lactate dehydrogenase with a systemic inflammation score is useful
for predicting response and survival in patients with newly diagnosed
diffuse large B-cell lymphoma.Acta Haematol.2015;133(1):10–17.
doi:10.1159/000360068
15. Kim S-H, Go S-I, Seo J, et al. Prognostic impact of pretreatment albumin to globulin ratio in patients with diffuse large B-cell
lym-phoma treated with R-CHOP.Leuk Res. 2018;71:100–105. doi:10.
1016/j.leukres.2018.07.014
16. Gao R, Liang J-H, Wang L, et al. Low serum cholesterol levels predict inferior prognosis and improve NCCN-IPI scoring in diffuse
large B cell lymphoma. Int J Cancer. 2018;143(8):1884–1895.
doi:10.1002/ijc.31590
17. Caetano SJ, Sonpavde G, Pond GR. C-statistic: a brief explanation of
its construction, interpretation and limitations.Eur J Cancer.2018;
90:130–132. doi:10.1016/j.ejca.2017.10.027
18. Vrieze SI. Model selection and psychological theory: a discussion of the differences between the Akaike information criterion (AIC) and
the Bayesian information criterion (BIC).Psychol Methods.2012;17
(2):228–243. doi:10.1037/a0027127
19. Steyerberg EW, Vickers AJ, Cook NR, et al. Assessing the perfor-mance of prediction models: a framework for traditional and novel
measures.Epidemiology. 2010;21(1):128–138. doi:10.1097/EDE.0b
013e3181c30fb2
20. Tripepi G, Jager KJ, Dekker FW, Zoccali C. Statistical methods for the
assessment of prognostic biomarkers (Part I): discrimination.Nephrol
Dial Transplant.2010;25(5):1399–1401. doi:10.1093/ndt/gfq018
21. Tripepi G, Jager KJ, Dekker FW, Zoccali C. Testing for causality and
prognosis: etiological and prognostic models. Kidney Int.2008;74
(12):1512–1515. doi:10.1038/ki.2008.416
22. Uno H, Cai T, Pencina MJ, D’Agostino RB, Wei LJ. On the
C-statistics for evaluating overall adequacy of risk prediction
proce-dures with censored survival data.Stat Med.2011;30(10):1105–1117.
doi:10.1002/sim.4154
23. Liberati A, Altman DG, Tetzlaff J, et al. The PRISMA statement for reporting systematic reviews and meta-analyses of studies that
eval-uate health care interventions: explanation and elaboration. PLoS
Med.2009;6(7):e1000100. doi:10.1371/journal.pmed.1000100
24. Jelicic J, Larsen TS, Maksimovic M, Trajkovic G. Available prognostic
models for risk stratification of diffuse large B cell lymphoma patients:
a systematic review.Crit Rev Oncol Hematol.2019;133:1–16. doi:10.1016/j.
critrevonc.2018.10.006
25. Chow A, Phillips M, Siew T, et al. Prognostic nomogram for diffuse large B-cell lymphoma incorporating the international prognostic index with
interim-positron emission tomographyfindings.Intern Med J.2013;43
(8):932–939. doi:10.1111/imj.12194
26. Zhong H, Chen J, Cheng S, et al. Prognostic nomogram incorporating
inflammatory cytokines for overall survival in patients with
aggres-sive non-Hodgkin’s lymphoma. EBioMedicine. 2019;41:167–174.
doi:10.1016/j.ebiom.2019.02.048
27. Han Y, Yang J, Liu P, et al. Prognostic nomogram for overall survival
in patients with diffuse large B-cell lymphoma.Oncologist.2019;24
(11):e1251–e1261. doi:10.1634/theoncologist.2018-0361
28. Biccler JL, Eloranta S, de Nully Brown P, et al. Optimizing outcome prediction in diffuse large B-cell lymphoma by use of machine learning and nationwide lymphoma registries: a nordic lymphoma
group study.JCO Clin Cancer Informatics.2018;2(2):1–13. doi:10.
1200/CCI.18.00025
29. Go S-I, Park MJ, Song H-N, et al. Prognostic impact of sarcopenia in patients with diffuse large B-cell lymphoma treated with rituximab plus cyclophosphamide, doxorubicin, vincristine, and prednisone.
J Cachexia Sarcopenia Muscle. 2016;7(5):567–576. doi:10.1002/
jcsm.12115
30. Go S-I, Park S, Kim JH, et al. A new prognostic model using the NCCN-IPI and neutrophil-to-lymphocyte ratio in diffuse large B-cell
lymphoma.Tumori J.2018;104(4):292–299. doi:10.5301/tj.5000694
31. Procházka V, Pytlík R, Janíková A, et al. A new prognostic score for elderly patients with diffuse large B-cell lymphoma treated with R-CHOP: the prognostic role of blood monocyte and lymphocyte
counts is absent.PLoS One.2014;9(7):e102594. doi:10.1371/journal.
pone.0102594
32. Gang AO, Pedersen M, d’Amore F, et al. A clinically based
prog-nostic index for diffuse large B-cell lymphoma with a cut-off at 70
years of age significantly improves prognostic stratification:
population-based analysis from the danish lymphoma registry.Leuk
Lymphoma.2015;56(9):2556–2562. doi:10.3109/10428194.2015.101
0078
33. Keane C, Tobin J, Talaulikar D, et al. A high LDH to absolute lymphocyte count ratio in patients with DLBCL predicts for a poor
intratumoral immune response and inferior survival. Oncotarget.
2018;9(34):23620–23627. doi:10.18632/oncotarget.25306
34. Kobayashi T, Kuroda J, Yokota I, et al. The kyoto prognostic index for patients with diffuse large B-cell lymphoma in the rituximab era.
Blood Cancer J.2016;6(1):e383–e383. doi:10.1038/bcj.2015.111
35. Miura K, Konishi J, Miyake T, et al. A host-dependent prognostic model for elderly patients with diffuse large B-cell lymphoma.
Oncologist.2017;22(5):554–560. doi:10.1634/theoncologist.2016-0260
36. Montalbán C, Díaz-López A, Dlouhy I, et al. Validation of the NCCN-IPI for diffuse large B-cell lymphoma (DLBCL): the addition
ofβ 2 -microglobulin yields a more accurate GELTAMO-IPI. Br
J Haematol.2017;176(6):918–928. doi:10.1111/bjh.14489
37. Chen Y, Neelapu S, Feng L, et al. Prognostic significance of baseline
peripheral absolute neutrophil, monocyte and serum
β2-microglobulin level in patients with diffuse large b-cell
lym-phoma: a new prognostic model. Br J Haematol. 2016;175
(2):290–299. doi:10.1111/bjh.14237
38. Kang J, Yoon S, Suh C. Relevance of prognostic index with
β2-microglobulin for patients with diffuse large B-cell lymphoma in
the rituximab era. Blood Res. 2017;52(4):276. doi:10.5045/br.20
17.52.4.276
39. Antic D, Jelicic J, Trajkovic G, et al. Is it possible to improve prognostic value of NCCN-IPI in patients with diffuse large B cell
lymphoma? The prognostic significance of comorbidities. Ann
Hematol.2018;97(2):267–276. doi:10.1007/s00277-017-3170-z
40. Kanemasa Y, Shimoyama T, Sasaki Y, et al. Beta-2 microglobulin as
a significant prognostic factor and a new risk model for patients with
diffuse large B-cell lymphoma.Hematol Oncol.2017;35(4):440–446.
doi:10.1002/hon.2312
Clinical Epidemiology downloaded from https://www.dovepress.com/ by 118.70.13.36 on 24-Aug-2020