University of South Carolina
Scholar Commons
Theses and Dissertations
5-8-2015
Facile Method for Large Scale Alignment of One
Dimensional Nanoparticles and Its Biomedical
Application
Sheng Feng
University of South Carolina - Columbia
Follow this and additional works at:https://scholarcommons.sc.edu/etd Part of theOrganic Chemistry Commons
This Open Access Dissertation is brought to you by Scholar Commons. It has been accepted for inclusion in Theses and Dissertations by an authorized administrator of Scholar Commons. For more information, please [email protected].
Recommended Citation
FACILE METHOD FOR LARGE SCALE ALIGNMENT OF ONE DIMENSIONAL
NANOPARTICLES AND ITS BIOMEDICAL APPLICATION
by
Sheng Feng
Bachelor of Science Henan Normal University, 2007
Master of Science
Beijing Normal University, 2010
Submitted in Partial Fulfillment of the Requirements
For the Degree of Doctor of Philosophy in
Chemistry
College of Arts and Sciences
University of South Carolina
2015
Accepted by:
Qian Wang, Major Professor
John H. Dawson, Committee Member
Caryn E. Outten, Committee Member
Hexin Chen, Committee Member
DEDICATION
This dissertation is dedicated to my lovely supportive wife, Yuhui, my cute smart
ACKNOWLEDGEMENTS
I sincerely acknowledge the following individual. I could never finish this
dissertation without all the helps and efforts they have offered.
First of all, I am deeply grateful to my mentor, Dr. Qian Wang. I have learned so
much from him. His diligent work driven by his curiosity towards the unknown intrigues
me to pursuit the career of science. He is also such an excellent teacher that he always uses
analogies from daily life to explain academic phenomena. Besides this, he is also my
teacher about social interaction. He has set an example for not only my scientific career,
but also personal life.
Secondly, I would like to express my acknowledgement to the following professors,
colleagues, and former lab members who have given me so many helps and mentorship:
Associate Professor Hexin Chen, Associate Professor Caryn E. Outten, Professor John H.
Dawson, Associate Professor Chuanbing Tang, Assistant Professor Hui Wang, Associate
Professor Ming Xian, Associate Professor Xinfeng Liu, Associate Professor John J.
Lavigne, Dr. Xingjie Zan, Dr. Gary Horvath, Dr. Xinrui Duan, Dr. Elisabeth Balizan, Dr.
Jittima Amie Luckanagul, Dr. Nikki Sitasuwan, Dr. Dan Manesco, Nick Mank, and Lin
Lu.
Lastly, I want to thank my family: my wife and my parents for their love and
ABSTRACT
Topographical cues can profoundly affect cellular behaviors. This thesis investigate
how to utilize the topographical cues generated by two techniques, flow assembly and
electrospinning, to regulate cellular behaviors.
First of all, a facile and robust method to align one-dimensional (1D) nanoparticles
(NPs) in large scale has been developed. Using flow assembly, representative rod-like
nanoparticles, including tobacco mosaic virus (TMV), gold nanorods and bacteriophage
M13, have been aligned inside capillaries by controlling flow rate and substrate surface
properties. The properties of 1D NPs, such as stiffness and aspect ratio, play a critical role
in the alignment. Furthermore, these hierarchically organized structures can be used to
support cell growth, where cell orientation and morphology are controlled. When C2C12
myoblasts were cultured on surfaces coated with aligned TMV, we found that nanoscale
topographic features were critical to guide the cell orientation and myogenic
differentiation. This method can be used in the fabrication of complex assemblies with 1D
NPs and has wide applications in tissue engineering, sensing, electronics and optical fields.
Furthermore, we combined this flow assembly method with genetically modified
TMV mutants with reported cell adhesion sequences (i.e. RGD1, RGD7, PSHRN3, P15,
and DEGA) to generate biomimetic substrates with specific cell adhesion motifs and
precisely controlled structural organization for guiding cell behaviors by providing desired
outgrowth and the resultant aligned TMV mutants substrates were able to dictate
directional neurite outgrowth of N2a cells. Hence, the plant virus-based materials provide
tremendous promise for neural tissue engineering in the future.
In addition, we generated the electrospun polycaprolactone (PCL) microfibers for
three dimensional (3D) culture of breast cancer cell lines, MCF-7. We found that cancer
stem cells (CSCs), a small group of tumor-initiating cells within tumors as the main
contributors of tumor growth, metastasis, and recurrence, have significantly increased the
proportion in the whole population. The expression of stem cell markers, including OCT3/4
and SOX2, and breast CSC-specific markers, SOX4 and CD49f, was significantly
upregulated, and the mammosphere-forming capability in cells cultured in 3D PCL
scaffolds increased. The fibrous scaffolds also induced the elongation of MCF-7 cells and
extended cell proliferation. The increase of CSC properties after culturing in 3D scaffolds
was further confirmed in the other two luminal-type mammary cell lines, T47D and
SK-BR-3, and a basal-type cell line, MDA-MB-231. Moreover, we observed the upregulation
of epithelial to mesenchymal transition and increased invasive capability in cells cultured
in 3D PCL scaffolds. These data suggests that the increase of CSC proportion in 3D culture
system may account for the enhanced malignancy. Therefore, our 3D PCL scaffolds can
potentially be used for CSCs enrichment and anti-cancer drug screening.
Finally, by electrospinning of polycaprolactone solutions containing
N-(benzoylthio)benzamide (NSHD1), a H2S donor, we fabricated fibrous scaffolds with
hydrogen sulfide (H2S) releasing capability (H2S-fibers). The resultant microfibers are
while the peak of donor alone showed at 45 minutes. H2S release half-lives of H2S-fibers
were 10-20 times longer than that of donor alone. Furthermore, H2S-fibers can protect cells
from H2O2 induced oxidative damage by significantly decreasing the production of
intracellular reactive oxygen species (ROS). Given that H2S has a broad range of
physiological functions, H2S-fibers hold great potential for various biomedical applications.
In summary, the emerging area of nanotechnology have been applied for
biomedical application as well as the fundamental study of the interaction between cell
behaviors and surrounding nanomaterials. Here, we have generated a robust and facile
method that can align various 1D NPs in a large quantity. The resulting substrates in
capillaries can be used to guide the directionality of cell growth. Meanwhile, we
investigated the effects of electrospun microfibers on breast cancer stem cells and
TABLE OF CONTENTS
DEDICATION ... iii
ACKNOWLEDGEMENTS ... iv
ABSTRACT ...v
LIST OF TABLES ...x
LIST OF FIGURES ... xi
CHAPTER 1:FACILE METHOD FOR LARGE SCALE ALIGNMENT OF ONE DIMENSIONAL NANOPARTICLES AND CONTROL OVER MYOTUBES ORIENTATION ...1
1.1INTRODUCTION ...1
1.2RESULTS AND DISCUSSION...3
1.3CONCLUSIONS ...20
1.4EXPERIMENTS ...21
1.5REFERENCE ...27
CHAPTER 2:FLOW ASSEMBLY OF TMVMUTANTS TO GUIDE DIRECTIONAL OUTGROWTH OF NEURITES ...36
2.1INTRODUCTION ...36
2.2RESULTS AND DISCUSSION...38
2.3 CONCLUSIONS ...49
2.4 EXPERIMENTS ...50
2.5 REFERENCE ...54
3.2RESULTS AND DISCUSSION...60
3.3CONCLUSIONS ...76
3.4EXPERIMENTS ...77
3.5REFERENCE ...83
CHAPTER 4:BIOLOGICAL THIOLS-TRIGGERED HYDROGEN SULFIDE RELEASING MICROFIBERS AS CELL SCAFFOLDS FOR TISSUE ENGINEERING ...91
4.1INTRODUCTION ...91
4.2RESULTS AND DISCUSSION...94
4.3CONCLUSIONS ...111
4.4EXPERIMENTS ...111
LIST OF TABLES
Table 1.1 Sample preparation conditions and results ...26
Table 1.2 Parameters of different 1D NPs used in experiments ...26
Table 2.1 List of isolated TMV mutants ...39
LIST OF FIGURES
Figure 1.1 Schematic illustration of flow assembly...4
Figure 1.2 AFM image of aligned TMV on the inner surface of commercial PCL tube after flow assembly, prepared with a TMV concentration of 0.02 mg·mL-1 and flow rate at 200 cm·s-1...6
Figure 1.3 Charge-charge interaction affects flow assembly. ...8
Figure 1.4 AFM images of flow assembly TMV on chitosan modified capillary tube at different flow rates ...10
Figure 1.5 AFM images of flow assembly with different concentrations of TMV on chitosan modified capillary tubes at a fixed flow rate of 200 cm·s-1 ...12
Figure 1.6 Flow assembly of other 1D NPs ...14
Figure 1.7 Alignment and differentiation of myotubes ...17
Figure 1.8 Fluorescent images of the C2C12 cells with the induction of differentiation for 7 days on the tubes with different NPs ...18
Figure 1.9 Immunofluorescent images of myoblasts ...19
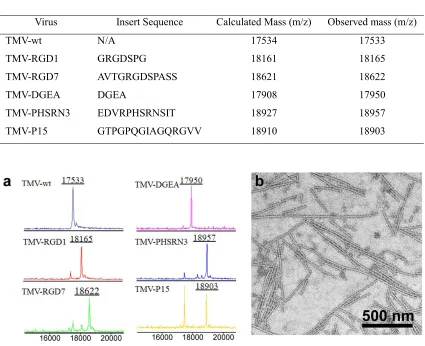
Figure 2.1 Characterizations of TMV mutants ...39
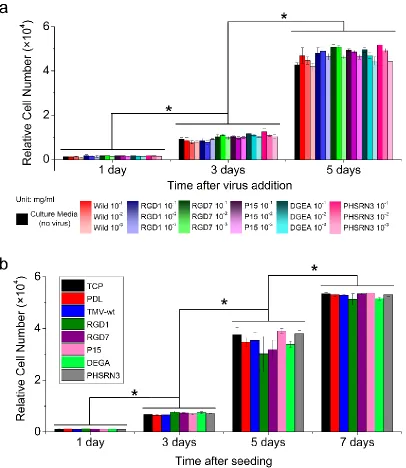
Figure 2.2 Biocompatibility of TMV materials ...40
Figure 2.3 Visualization of TMV coating on tissue culture plastics ...41
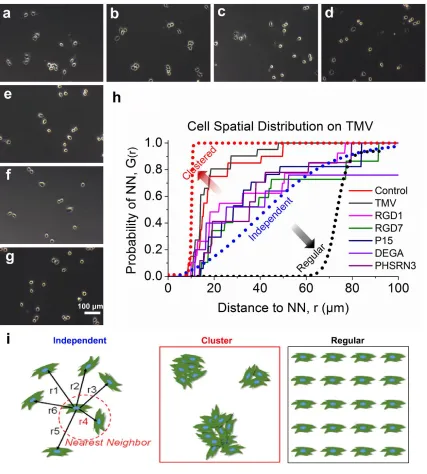
Figure 2.4 Growth patterns of differentiated N2a cells on TMV substrates ...44
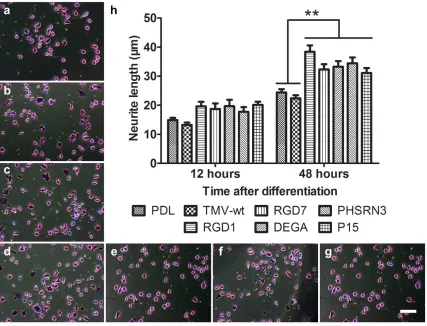
Figure 2.5 Neurite outgrowth of N2a cells on TMV substrates ...45
Figure 2.6 Flow assembly of TMV in capillaries in various densities ...46
Figure 2.7 AFM images of flow assembly of TMV ...47
Figure 2.9 Orientation of neurite outgrowth on aligned TMV substrates...49
Figure 3.1 PCL fibrous scaffolds were fabricated by the electrospinning process ...60
Figure 3.2 Fluorescence microscopy images of MCF-7 cells cultured in 2D tissue culture plastics...61
Figure 3.3 Fluorescence microscopy images of T47D, SK-BR-3, and MDA-MB-231 cells cultured in 2D tissue culture plastics and 3D PCL fibrous scaffolds ...62
Figure 3.4 MCF-7 cells seeded in PCL fibrous scaffold occupied architectural features of the matrix in three dimensions as observed using confocal microscope ...63
Figure 3.5 The proliferations of MCF-7 in 2D TCP and 3D PCL scaffolds were measured at indicated time points by CellTiter-Blue assay ...64
Figure 3.6 The proliferations of MDA-MB-231 in 2D tissue culture plastics and 3D PCL fibrous scaffolds ...64
Figure 3.7 Epithelial breast cancer cell lines, MCF-7, T47D, and SK-BR-3 cultured on PCL fibrous scaffolds increased ALDH-positive population compared with counterparts cultured on tissue culture plastics ...66
Figure 3.8 Epithelial breast cancer cell lines, MCF7, T47D, and SK-BR-3 on PCL fibrous scaffolds increased the property of stemness ...67
Figure 3.9 MDA-MB-231 cells cultured in PCL fibrous scaffolds displayed increased CSCs properties and gene expression pattern of EMT ...69
Figure 3.10 Cells from PCL fibrous scaffolds culture displayed a mesenchymal morphology after being re-plated in TCP (right), relative cells from TCP (left) ...70
Figure 3.11 Culture on PCL fibrous scaffolds increases the invasion of MCF-7, T47D, and SK-BR-3 cells ...71
Figure 3.12 Immunofluorescence staining for E-cadherin in MCF-7 and T47D cells
cultured in tissue culture plastics and PCL fibrous scaffolds ...72
Figure 3.13 After culturing for 6 days on PCL fibrous scaffolds and tissue culture plastics,
cell extracts were used for Western blot analysis to detect the expression of E-cadherin and
Vimentin ...73
Figure 3.15 Real time quantitative PCR analysis of CD24, CD44 variants and TGF-β3 expression in MCF-7 and MDA-MB-231 cells cultured in 3D scaffolds compared to cells
on tissue culture plastics ...75
Figure 4.1 Electrospinning setup ...95
Figure 4.2 Morphology of H2S-fibers ...96
Figure 4.3 EDX and FT-IR analysis of PCL-fibers and H2S-fibers ...97
Figure 4.4 Characterization of aligned and randomly oriented H2S-fibers ...98
Figure 4.5 Release profiles of H2S-fibers ...100
Figure 4.6Cumulative Release of H2S Donors from H2S-fibers. ...102
Figure 4.7 Cytotoxicity of NSHD1 in the absence or presence of cysteine ...104
Figure 4.8 Effects of H2S-fibers on cell viability ...105
Figure 4.9 Fluorescence images of H9c2 cells cultured in H2S-fibers ...106
Figure 4.10 Fluorescence images of H9c2 cells cultured in H2S-fibers and PCL-fibers .106 Figure 4.11 H2S detection in NIH 3T3 cells and H9c2 cells ...107
Figure 4.12 H2S-fibers protected cells from H2O2 induced oxidative injury ...108
Figure 4.13 Time course of H2S-fibers protecting cells from H2O2 induced oxidative injury. H9c2 cells ...109
Figure 4.14 H2S-fibers reduced levels of reactive oxygen species (ROS) production in H2O2 treated H9c2 cells ...109
CHAPTER 1
FACILE METHOD FOR LARGE SCALE ALIGNMENT OF ONE
DIMENSIONAL NANOPARTICLES AND CONTROL OVER
MYOTUBES ORIENTATION
Portions of this chapter appear in the following manuscript: facile method for large
scale alignment of one dimensional nanoparticles and control over myotubes orientation.1
1.1 INTRODUCTION
One-dimensional (1D) nanoparticles (NPs), such as nanorods, and nanotubes,
have become attractive building blocks for modern materials with wide applications in
tissue engineering,2 medicine,3 electronics,4 and optical devices.5 Due to their unique anisotropic shapes and shape related properties of 1D NPs, the orientation and alignment
of 1D NPs is crucial for final material properties.6-7 For example, it has been shown that
both electrical and thermal conductivity of carbon nanotubes increases along the alignment
direction; and the enhancement was strongly dependent on the degree of alignment.8-9
Therefore, controlling 1D NPs orientation is an important topic during the development of
1D NPs materials.
A variety of methods have been proposed for integrating organized 1D NPs into
devices. One group of methods is based on the interaction between 1D NPs and supporting
substrates, where the orientation of 1D NPs is directed by surface chemical
functionalities,10 micropatterns fabricated by lithography,11 or the capillary force at a
is to employ an external force. This external force can be a contact shear force,13-15 electric
field,16 fluid flow,4, 17-18 or surface pressure.19 For example, using shear force generated by
fluid flow, Lieber and coworkers have demonstrated that indium phosphide, gallium
phosphide, and silicon nanowires were aligned by flowing nanowire suspensions through
polydimethylsiloxane templated microchannels.17 Inspired by the simple physics behind
this fluid flow method, we seek to expand it beyond the original microchannel setup, and
develop a cost-effective, time-saving, high-throughput and generally applied method to
control 1D NPs orientation in large scale.
Many cells or tissues with the aligned organization in vivo include neural cells20
corneal tissue,21 vascular tissue,22 musculoskeletal tissue23 and myocardial tissue.24
Directing cell orientation and differentiation is critical for tissue engineering in term of
mimicking the real tissue, in most of which the cell are directed by orientated extracellular
matrix (ECM) proteins.25,26 Taking advantage of 1D NPs to direct cell growth and
differentiation has been demonstrated by Werner, where aligned 1D collagen fiber
enhanced myotube organization and length, and modulated the growth and fate of
mesenchymal stem cells.27 In our previously studies, aligned bacteriophage M13 thin film
was utilized to guide cell oriented along the M13 aligned direction through directing the
secreted ECM protein.27,28 In addition, the confined spaces, perpendicularly to the capillary,
provided by tobacco mosaic virus (TMV) patterned rings were used to direct the
perpendicular orientation of smooth muscle cells to the capillary, which is believed to have
great potential to develop a vascular grafting.28
In this study, a facile and robust method to align one-dimensional (1D)
rod-like nanoparticles, including TMV, gold nanorods and bacteriophage M13, have been
aligned inside glass tubes by controlling flow rate and substrate surface properties (Figure
1.1a). TMV has the shape of a hollow cylinder (18 nm in diameter, 300 nm in length, and
4 nm cavity), consists of 2,130 identical subunits that assemble helically around single
strand RNA (Figure 1.1b and 1.1c) and can be modified chemically and genetically.30,31
The uniformly ordered nanostructure and well-defined geometry of TMV provides a
unique building block for nanomaterial development and biomedical applications.29-40
Therefore, TMV was chosen to optimize the experimental setup and assembly conditions.
When C2C12 myoblasts were cultured on surfaces coated with aligned TMV, we found
that nanoscale topographic features were critical to guide the cell orientation and myogenic
differentiation. This method can be used to fabricate complex structures with 1D
nanoparticles and will have wide applications in tissue engineering, sensing, electronics
and optical fields.
1.2 RESULTS AND DISCUSSION
1.2.1 Setup of the Flow Assembly for the Alignment of 1D NPs
The setup of the experiment is schematically illustrated in Figure 1.1a, which is
consisted of a glass capillary tube (inner diameter ~0.16 cm, length ~15 cm), a solution
feeder tube (plastic tubing with inner diameter ~0.15 cm) and high pressure gas cylinder
with a valve to control gas and subsequent fluid flow rate. One end of the plastic feeder
tube is connected to the glass capillary tube, and the other end is left open for filling 1D
NPs solution, and subsequent connection to a high pressure cylinder. All connection areas
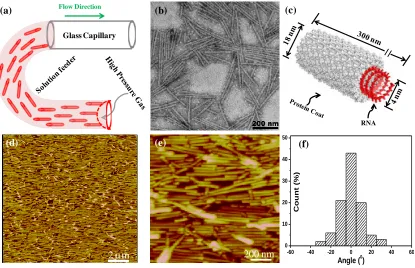
Figure 1.1. Schematic illustration of flow assembly. (a) Schematic illustration of experimental setup. One end of feeder tube is connected to the capillary while the other end is kept open for filling of 1D NPs solutions and subsequent high pressure gas. 1D NPs solution is only filled into the plastic tube, keeping the glass capillary tube empty. Then the solution in the feeding tube is driven through the capillary tube by the high pressure gas. After the NPs solution flows through the capillary tube, the capillary is dried by a continuing gas flow. The arrow “→” indicates flow direction. (b) Transmission election microscopy (TEM) image and (c) structure illustration of TMV. (d) AFM image of aligned TMV on the inner surface of a capillary tube after the flow assembly, prepared with a TMV
concentration of 0.05 mg·mL-1 and a flow rate of 200cm·s-1. (e) Magnified image of (d).
(f) A histogram of TMV angular spread distribution with respect to flow direction.1
Before the fluid flow, the capillaries were immersed in chitosan solution (1
mg·mL-1 in 0.1% acetic acid at pH 6.5) for 20 mins, and then dried by the N2 flow. In a
typical experiment, 10 mL TMV (0.05 mg·mL-1) was filled into a plastic feeder tube and
driven through a capillary by a fluid flow rate of 200 cm·s-1, then dried completely with air
flow. TMV particles were distributed evenly with 96% surface coverage and an overall
alignment along the long axis of the capillary, as shown under AFM (Figure 1.1d and 1.1e).
More importantly, such alignment was observed on over 20 random positions in the inner
(a) Flow Direction
Glass Capillary 2 mm (b) (c) RNA (f) (e) (d)
200 nm -60 -40 -20 0 20 40 60
0 10 20 30 40 50 Cou nt (% )
surface of the glass tube, indicating a uniform coverage over the whole capillary tube. The
orientation of TMV was further quantitatively assessed by analyzing angles of more than
200 nanorods with respect to flow direction. The angular spread distribution histogram of
TMV is shown in Figure 1.1f. Over 84% TMV nanorods were aligned within ± 10°, and
the rest were distributed between ± 10-30°.In addition, with this method, we also generated
the aligned TMV in the polycaprolactone (PCL) tubes (Figure 1.2), which is a widely used
material for tissue engineering. The coverage of TMV is lower in PCL tubes than glass
capillary tubes at the same prepared conditions, likely due to the difference of the surface
chemistry between PCL tubes and glass capillary tubes, which will be further discussed in
the next section.
1.2.2 Effects of Surface Properties on the TMV Alignment
In order to understand the origin of the aligned structure and key factors on
controlling the alignment, various control experiments were carried out. All samples and
their corresponding preparing conditions were listed in Table 1.1. All samples were
prepared under same TMV concentration (0.02 mg·mL-1) and flow rate (200 cm·s-1). After
the samples were ready, at least 20 AFM images were taken for each sample from the
random position of capillary tubes. Based on the AFM images, TMV angular spread
distribution histograms were obtained by analyzing the angles of more than 200 particles
with respect to the flow direction, then the histograms were simulated by Gaussian
equation. The alignment degrees of 1D NPs were also evaluated by the half-height peak
width (HPW), i.e. the peak width at the half-height of peak. The smaller the HPW number
is, the better alignment the sample has.17 The surface coverage was used to estimate the
experiment was performed under the described condition, but no fluid flow was applied.
Only randomly distributed TMV (Figure 1.3a) with 44% surface coverage was observed.
The value of HPW is 176°, which is very close to the totally random distribution of 180°.
This result indicates that such aligned TMV nanorods structure was generated by the
shearing force from the solution flow.
Figure 1.2. AFM image of aligned TMV on the inner surface of commercial PCL tube
after flow assembly, prepared with a TMV concentration of 0.02 mg·mL-1 and flow rate at
200cm·s-1. In brief, PCL tube with inner diameter ~1.8 mm was purchased from
Cole-Parmer Company and was cut into 10 cm in length. Before fluid flow, the tube was treated
by immersing in 2 mg·mL-1 polyallyamine hydrochloride (PAH) solution (pH = 11.0)
overnight for aminolysis, and then washed by copious hydrogen chloride solution (pH = 2)
for 2 mins. Then (PSS/PAH)2 was coated on inner surface of PCL tube by following
procedure: alternatively immersing capillaries in PSS (1 mg·mL-1) for 20 min and PAH
solution (1.0 mg·mL-1 pH=5.0) for 20 min. Water was used to rinse in between each
deposition step until the desired number of layers was obtained. The (PSS/PAH)2 coated
tubes was used for the fluid flow assembly.1
The interaction between TMV and the substrate plays an important role on forming
this oriented structure. This interaction depends on two major factors: the surface energy
and the surface charge distribution. Because the pI of TMV is around 3.4,41 in our general
protocol, chitosan was used to give the capillary a positively charged internal surface. The
-60 -40 -20
0
20 40 60
0
20
40
Count (% )Angle (
0)
HPW=440
(a)
water contact angle of chitosan coated surface was 48 ± 2. In Control 2 and 3, two other
cationic compounds, poly(diallyldimethylammonium chloride) (PDDA) and
(3-aminopropyl)triehoxysilane (APTES), were used to obtain similar positively charged
surface, but different surface energy. Simply judged from the water contact angles, Control
2 has higher while Control 3 has lower surface energy than chitosan modified surface
(water contact angles were 30 ± 1 and 81 ± 2, respectively). After the fluid flow, similar
assembly morphologies were obtained (Figure 1.3b) for both cases. Their comparable
HPW and surface coverage percentvalues with the typical sample (Table 1.1) indicate the
surface energy was not a key factor on controlling the alignment. On the other hand, if the
surface was negatively charged or neutral, as shown in Control 4-6, the high HPW were
generated (Table 1.1), suggesting TMV particles were randomly distributed (Figure 1.3c).
In addition, the surface coverage of Control 4-6 are much lower than the Control 2-3 and
typical chitosan modified samples (Table 1.1) due to electrostatic repulsion between TMV
and the substrate. These results revealed that the electrostatic interaction between TMV
and the substrate is critical for the formation of the aligned structure. To confirm this
hypothesis, we increased the ionic strength of the TMV solution by adding 50 mM
phosphate buffer (pH 7.0) to weaken the electrostatic attraction between TMV and chitosan
coated surface (Control 7). As our expectation, weakening attraction resulted in increased
HPW and decreased surface coverage (Table 1.1 and Figure 1.3d), indicating much less
TMV particles deposited and a worse alignment. Overall, the shearing force generated by
fluid flow can drag TMV particles to align along the flow direction, i.e. the long axis of
capillary tube, due to its anisotropic shape. The attractive force between TMV and capillary
Finally, we found that, once it was dried by following gas immediately, the
deposited TMV with aligned structure was almost no change on the HPW and slight
decrease in surface coverage after it was immersed into PBS solution at 37 C for 24h
(Figure 1.3f). This feature suggests that it is a relatively stable environment for the cell
study. However, TMV particles could be washed off if the sample was not dried completely
by the gas glow (Figure 1.3e), which gave a decreased surface coverage and a similar HPW
(Control 8 in Table 1.1).
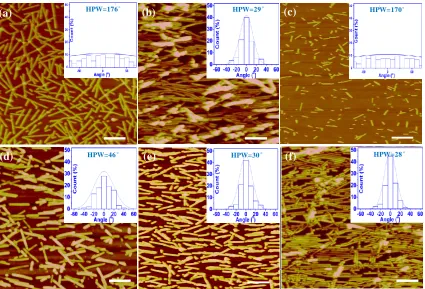
Figure 1.3. Charge-charge interaction affects flow assembly. AFM images of (a) Control 1; (b) Control 2 (Control 3 gave similar results); (c) Control 4-6; (d) Control 7; (e) Control
8; and (f) The typical sample after immersed into PBS for overnight at 37 C. All scale
bars indicate 200 nm. The insets are the histograms of TMV angular distribution at corresponding flow rates. The curve in each histogram is fitted by Gaussian equation based on the histogram data. The angle distribution histograms were obtained by statistical analysis of angular distribution of about 200 TMV particles with respect to the flow direction.1
(a) (b) (c)
(d) (e) (f)
HPW=176° HPW=29° HPW=170°
HPW=30° HPW=28°
1.2.3 Effect of Flow Rate on TMV Alignment
For testing the effect of flow shearing force on the alignment of TMV, different
flow rates ranging from 50 to 200 cm·s-1 were applied to prepare samples with fixed TMV
concentration at 0.02 mg·mL-1. Based on the AFM images (Figure 1.4a-d), TMV angular
spread distribution histograms were obtained by analyzing the angles of more than 200
particles with respect to the flow direction, then the histograms were simulated by Gaussian
equation (insets of Figure 1.4a-d). Obviously, with the increased flow rate, the width of
TMV angular distribution was narrowed, while the distribution near angle 0° in the
histograms increased. To evaluate the alignment degree of 1D NPs, the HPW was plotted
against flow rate and shown in Figure 1.4e. The HPW decreased from 52° to 28°with the
increased flow rate from 50 cm·s-1 to 200 cm·s-1. It implies that the alignment of TMV was
improved greatly by increasing the flow rate, which is consistent with the previous report.17
This phenomenon can be explained from the Newton shear flow theory: the shearing force
increases proportionally with the flow rate. Because the TMV particles are aligned in
response to the shearing force, a higher flow rate means a bigger shearing force, hence
leads to a better alignment. The best alignment in the experimental flow range for this
system is that about 84% TMV nanorods were aligned within ± 10° at flow rate 200 cm·s
-1. Thus the flow rate of 200 cm·s-1 was used for next samples preparation if it was not
mentioned specially. In all tested flow rate range, samples exhibited constant surface
coverage around 85%, as shown in Figure 1.4e. For testing the effect of flow shearing
force on the alignment of TMV, different flow rates ranging from 50 to 200 cm·s-1 were
applied to prepare samples with fixed TMV concentration at 0.02 mg·mL-1. Based on the
by analyzing the angles of more than 200 particles with respect to the flow direction, then
the histograms were simulated by Gaussian equation (insets of Figure 1.4a-d). Obviously,
with the increased flow rate, the width of TMV angular distribution was narrowed, while
the distribution near angle 0° in the histograms increased. To evaluate the alignment degree
of 1D NPs, the HPW was plotted against flow rate and shown in Figure 1.4e. The HPW
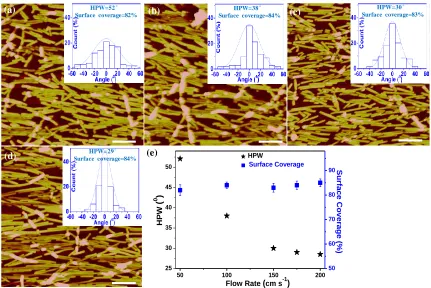
Figure 1.4. AFM images of flow assembly TMV on chitosan modified capillary tube at different flow rates: (a) 50 cm·s-1; (b) 100 cm·s-1; (c) 150 cm·s-1; and (d) 175 cm·s-1. The
TMV concentrations were 0.02 mg·mL-1. The insets are the histograms of TMV angular
distribution at corresponding flow rates. The curve in each histogram was fitted by Gaussian equation based on the histogram data. The angle distribution histograms were obtained by statistical analysis of angular distribution of about 200 TMV particles with respect to the flow direction. (e) The dependence of HPW direction on flow rate. All scale
bars indicate 200 nm.1
decreased from 52° to 28°with the increased flow rate from 50 cm·s-1 to 200 cm·s-1. It implies that the alignment of TMV was improved greatly by increasing the flow rate, which
50 100 150 200
25 30 35 40 45 50 H P W ( 0 )
Flow Rate (cm s-1)
HPW Surface Coverage 50 60 70 80 90Surfa c e Cov e rag e (% ) (a) (b) (d) (c) (e) HPW=52° Surface coverage=82%
HPW=38° Surface coverage=84%
HPW=30° Surface coverage=83%
is consistent with the previous report.16 This phenomenon can be explained from the Newton shear flow theory: the shearing force increases proportionally with the flow rate.
Because the TMV particles are aligned in response to the shearing force, a higher flow rate
means a bigger shearing force, hence leads to a better alignment. The best alignment in the
experimental flow range for this system is that about 84% TMV nanorods were aligned
within ± 10° at flow rate 200 cm·s-1. Thus the flow rate of 200 cm·s-1 was used for next
samples preparation if it was not mentioned specially. In all tested flow rate range, samples
exhibited constant surface coverage around 85%, as shown in Figure 1.4e.
1.2.4 Influence of TMV Concentration on Alignment and Substrate Coverage
The surface coverage of the TMV can be controlled by the TMV concentration. As
shown in Figure 1.5a-c, the average coverage are about 95%, 86% and 50% for the TMV
concentration at 0.05, 0.02 and 0.005 mg·mL-1 respectively. In addition, the decreased
concentration also led to the slightly decreased alignment, as revealed by the HPW of the
simulated peaks (insets of Figure 1.5a-c). These results are consistent with previous
report.42 The differences in coverage in micro-scale as well as the alignment are important
for controlling cell orientation and differentiation, which will be further discussed in the
following cell study section.
1.2.5 Influence of 1D NPs Physical Properties on the Alignment
We extended our method to other 1D NPs and showed how the physical properties
affect the fluid flow assembly. A selection of different kinds of representative 1D NPs were
studied, including potato virus X (PVX),43 TMV-Aniline hybridized fibers,41 filamentous
properties (aspect rations and rigidity). The preparation and purification of the selected 1D
NPs were described in detailed in the Experimental Section. The physical properties of
these 1D NPs are listed in Table 1.2 and TEM images are shown in Figure 1.6a-d.
Figure 1.5. AFM images of flow assembly with different concentrations of TMV on
chitosan modified capillary tubes at a fixed flow rate of 200 cm·s-1: (a) 0.05 mg·mL-1; (b)
0.02 mg·mL-1; and (c) 0.005 mg·mL-1. The insets are their corresponding angular spread
distribution histograms of TMV with respect to the flow direction and HPW values.1
We fixed the flow rate at 200 cm·s-1and the 1D NPs concentration at 0.02 mg·mL-1
during the flow assembly process and the final results were observed by AFM (Figure
1.6e-h). The particle alignment with respect to the fluid flow direction was analyzed, and
corresponding angular spread distribution histograms were obtained as shown in the insets
of the Figure 1.6e-h. The alignment degree was evaluated by the HPW, as plotted in Figure
1.6e. All of these 1D NPs showed the aligned orientation but with different degree. We
hypothesize that rigidity and aspect ratio of 1D NPs are two major factors on the alignment,
and 1D NPs with higher aspect ratio and higher rigidity can lead to a better alignment.
To study how the rigidity and aspect ratio affect the alignment, we set those 1D
NPs into several pairs for comparison, based on comparable rigidity or aspect ratio. The
role of rigidity on the alignment was illustrated by comparing alignment degrees of two 1D
NPs with similar aspect ratio, but different modulus, i.e. GNRs and TMV. The HPW of
500 nm
(c)
(a) (b)
500 nm
500 nm 500 nm
(a) HPW=26 (b) (c)
0
Surface coverage=95%
HPW=280
Surface coverage=86%
HPW=330
GNRs (14°) is much narrower angular spread than TMV (28°) because of the 45-fold
higher modulus of GNRs (Figure 1.6h versus Figure 1.1d), suggesting the higher rigidity
of 1D NPs result in the better alignment. The dependence of alignment on the aspect ratio
of 1D NPs could be reflected when compared two 1D NPs with similar modulus, but
different aspect ratio, e.g. TMV vs. TMV-Aniline fiber. The HPW of TMV-Aniline fiber
had been narrowed to 16° from 28° with the increased length from 300 nm to 4 mm (Figure
1.6f versus Figure 1.1d). Similarly, PVX, a little bit longer than TMV but with comparable
rigidity, showed a slightly better alignment degree (25° in HPW) than TMV (28° in HPW)
(Figure 1.6e versus Figure 1.1d). Furthermore, under comparable modulus, TMV, PVX
and TMV-Aniline fiber having gradually increased aspect ratio displayed the gradual
decrease in HPW. All of these results indicate higher aspect ratio of 1D NPs leads to a
higher alignment degree. Compared the HPW of TMV-Aniline fiber (16°) to M13 (44°),
much bigger difference between TMV-Aniline fiber and M13 than other pairs of 1D
bio-NPs was observed due to the synergetic enhancement from longer length and higher
modulus of TMV-Aniline fiber than M13 (Figure 1.6f versus Figure 1.6g). The surface
coverage is over 90% for all tested samples except the GNRs with 34% surface coverage
(Figure 1.6). The low coverage of the GNRs might be caused by its surface chemistry
defects.46
Finally, all tested 1D NPs had formed the aligned orientation. Among these 1D NPs,
TMV-Aniline fiber and GNRs have higher rigidities (Table 2.2), thus resulting in the best
alignment, i.e. 95% particles aligned within ± 10o and 98% aligned within ± 10o,
respectively, which may have potentials in the electronic and optic applications.47-48 The
NPs, which should be considered when this method is applied. The same method might be
used to control the alignment of other 1D NPs if optimized fluid flow and suitable attraction
between 1D NPs and substrate were applied
Figure 1.6. Flow assembly of other 1D NPs. (a-d) are the TEM images of (a) PVX; (b) TMV-Aniline fiber; (c) M13; and (d) gold nanorods (GNRs). (e-h) are the AFM images of inner wall of capillary after flow assembly with (e) PVX; (f) TMV-Aniline fiber; (g) M13;
and (h) GNRs, with fixed flow rate of 200 cm·s-1and the concentration of 0.02 mg·mL-1 of
NPs. The capillary was modified by (PDDA/PAA)3 for (h), others are modified by
chitosan. The insets in (e-h) are their corresponding angular spread distribution histograms with respect to the flow direction. Each histogram was obtained by statistical analysis of angular distribution of about 200 nanorods. (i) The HPW plot of different 1D NPs. The scale bars indicate 400 nm for all TEM images (a-d), 200 nm for (e), 500 nm for (f) and
(g), and 1 μm for (h).1
(a) (b) (c) (d)
(i)
20 30 40
Fiber M13 GNRs
TMV-An PVX TMV HPW ( 0 )
(e) (f) (g)
(h)
HPW=250 Surface coverage=91%
HPW=170 Surface coverage=93%
HPW=440 Surface coverage=98%
1.2.6 Alignment and Differentiation of Myotubes
Enhancing the differentiation and alignment of cells in biomaterials is crucial for
engineering functional tissues with anisotropic properties.49 For example, in native
musculoskeletal tissue, the myoblasts form aligned fibers in a highly organized manner
through the fusion into the multi-nucleated myotubes.23 The similar organization with the
alignment also exists in myocardial tissue.24 This aligned arrangement is indispensable for
tissues to generate the contractile force. Using the aligned topographical features created
by flow assembly, we studied the orientation and differentiation of C2C12 myoblasts
guided by the contact cues.
Skeletal myogenesis, as a terminal differentiation process, is involved in the
differentiation and fusion of proliferating mono-nucleated myoblasts into multi-nucleated
myoblasts. C2C12 myoblasts have been used as a model system to study various types of
muscular dystrophies in vitro.50-52 Many studies have described the patterning of C2C12
cells on different modified surfaces. For instance, micro-contact printing has been used to
generate fibronectin islands with different geometric cues to study the C2C12 cells
alignment and maximize the differentiation.53 Previous study revealed a 2D substrate
coated with TMV or TMV mutants promotes rat bone marrow stromal cells osteogenic
differentiation.54 However, how the aligned TMV surfaces affect the alignment and
differentiation of C2C12 cells is still unknown. Four kinds of aligned TMV and
TMV-RGD-coated capillaries, TMVH, TMVL, RGDH and RGDL, were prepared for cell studies.
The letter H denotes high coverage (starting with 0.02 mg·mL-1 of TMV or TMV-RGD),
while L denotes low coverage (starting with 0.005 mg·mL-1 of TMV or TMV-RGD) of
200 cm·s-1, and random arranged TMV coated capillary tubes were used as the control. TMV-RGD here is the mutant TMV with inserted sequence GRGDSPG, and had been
proved to enhance cell attachment and stimulate osteogenic differentiation.30, 55
We first seeded C2C12 myoblasts in capillary tubes with different TMV alignments
and allowed cells to attach overnight. We did not observe any significant difference in the
cells attachment to substrates among different groups. After 3 day proliferation, cells were
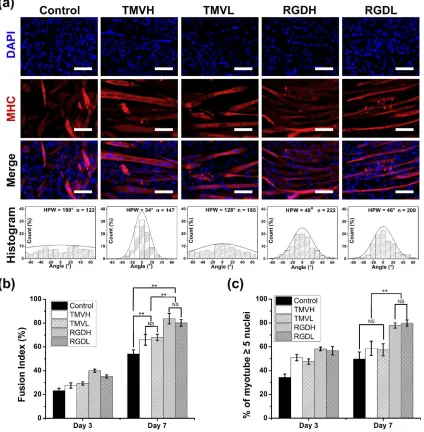
subjected to differentiation medium (DM). Figure 1.7a shows the fluorescence images of
the cells with myosin heavy chain (MHC) (red) and DAPI (blue) staining on different
substrates after 7 days cultured in DM (representative images with low magnification are
shown in Figure 1.8). The appearance of MHC staining indicated the formation of the
myotubes in all groups.
In order to quantify the degree of the myotube alignment, using ImageJ software,
we measured the angles of myotubes with respect to the flow direction in 15 low
magnification fluorescence images in each group and plotted the angular distribution
histograms (Figure 1.7a). The TMVH showed the best alignment with HPW 34o; and the
RGDH and RGDL showed the moderate alignment. RGDH (HPW 46o) was a little higher
than RGDL (HPW 48o); and the TMVL displayed seldom alignment (HPW 126o), while
there was no alignment (HPW 180o) in the random TMV coated sample. Within the
deviation of ± 20 o, about 93% of myotubes were aligned for TMVH, and this number
decreased to 81%, 75%, and 49% for RGDH, RGDL and TMVL, respectively. The low
degree of the alignment in TMVL might be due to the low density of TMV is insufficient
peptides, to C2C12 cells. By displaying the cell binding motifs, the low density of
TMV-RGD was still able to generate moderate guidance for the alignment of cells.
Figure 1.8. Fluorescent images of the C2C12 cells with the induction of differentiation for 7 days on the tubes with different NPs. Cells were stained for anti-MHC (red) and DAPI
(blue). All scale bars indicate 200 μm.1
To quantify the differentiation of myoblasts, we calculated the fusion index and
maturation index from the immunofluorescence images by determining the number of
nuclei from multinucleated myocytes over the number of total nuclei in that field and the
percentage of myotubes with 5 or more nuclei, respectively.56 Two independent
experiments were performed and 6 randomly images were used to determine the fusion
index and maturation index for each group. The results show that the fusion indices for
cells in TMVH and TMVL groups (66.1 ± 4.6% and 67.9 ± 2.6%, respectively)
significantly increased compared to the control group (54.1 ± 3.4%) (p < 0.01). There is no
significant difference between TMVH and TMVL groups. In addition, the fusion indices
for cells in RGDH and RGDL (83.7 ± 4.4% and 80.2 ± 2.9%, respectively) are significant
higher than counterparts in TMVH, TMVL and control groups (p < 0.01). There is no
significant difference between RGDH and RGDL groups. Furthermore, the maturation
indices of cells in RGDH and RGDL groups (77.9 ± 2.6% and 80.0 ± 2.2%, respectively)
and 49.8 ± 5.9 %, respectively). Taken together, the myotubes in RGDH and RGDL had
the highest level of differentiation, which is consistent with previous report that RGD
peptide promotes the myotubes differentiation.57-59 Cells in TMVH and TMVL also
increased the level of differentiation compared to control groups.
Figure 1.9. Immunofluorescent images of myoblasts (a-c), nuclei are DAPI-stained (blue), and actin filaments are rhodamine-phalloidin stained (red). Angular spread of myoblast actin filaments with respect to the flow direction is shown in (d-f). Un-aligned TMV as control (a and d); high coverage aligned TMV (b and e); and low coverage aligned TMV
-80 -60 -40 -20 0 20 40 60 80 0 20 40 Cou nt (% )
Angle (0)
-80 -60 -40 -20 0 20 40 60 80 0
20 40
Angle (0)
Cou
nt
(%
)
-80 -60 -40 -20 0 20 40 60 80 0 20 40 Cou nt (% )
Angle (0)
Previous study has observed that the alignment of myoblasts promote their
differentiation.60 The differentiation of myoblasts depends on two critical events: the
growth arrest 61 and the end-to-end contacts between myoblasts.62 In day 3, we observed
the C2C12 cells aligned along the orientation of TMV particles by F-actin staining (Figure
1.9). The alignment of myoblasts on capillary tubes with TMV particles may enhance
aligned end-to-end contacts between the cells. Therefore higher percentages of cells in
groups with aligned orientation were fused to differentiate into myotubes than control
groups.
1.3 CONCLUSIONS
In this work, we have demonstrated that the fluid flow assembly can serve as a
facile and robust method to align 1D NPs in large scale. The formation of thus aligned 1D
NPs was dominated by the shearing force generated by the fluid flow, interactions between
1D NPs and substrate, and the following drying process. In addition, the alignment degree
and coverage of the 1D NPs can be readily controlled by the flow rate, the concentration
and the nature properties (length and modulus) of the 1D NPs. In general, a better aligned
structure can be produced when longer and stiffer 1D NPs are used at higher flow rate and
higher concentration. This method has been used to align various kinds of 1D NPs,
including rod-like viral particles, hybridized conductive nanowires, and inorganic 1D NPs.
Capitalizing on the simplicity, flexibility and macro-scale of this method, this technique
can engineer aligned 1D NPs, with wide potential applications on tissue engineering,
electronic, and optical fields. Furthermore, compared to control group, the aligned virus
particles successfully guided myotubes alignment, and enhanced the myogenic
mimic organized structures of the extracellular matrix (ECM), and can support and dictate
the cell growth, spreading and other responses, which is critical for many applications in
the emerging field of tissue engineering.
1.4 EXPERIMENTS
1.4.1 Materials
Poly(acrylic acid) (PAA) (MW 450000), poly(diallyldimethylammonium chloride)
(PDDA) (20 wt % in water, M~200 000-350 000 g/mol), poly(styrene sulfonate) (PSS)
(MW 70000 g/mol), chitosan (high purity, MW 60000-120000) and
aminopropyltriethoxysilane (APTES) were purchased from Sigma-Aldrich; the materials
were used as received. Deionized water (18.2 MΩ.cm) used for rinsing and preparing all
the solutions was obtained from a Millipore Simplicity 185 purification unit. Serum media,
DMEM high glucose, was made by adding 6.7 g powder media (Hyclone, SH30003.03),
1.2 g sodium bicarbonate (Fisher Scientific , S233-500), 3.57 g HEPES (Cellgro,
61-034-RM), 5.0 mL L-glutamine solution (Invitrogen, 25030081), and 5 mL
penicillin-streptomycin (Invitrogen, 15140122) to 500 mL water (Millipore Synergy UV system, 18.2
MΩ.cm). The solution was then brought to pH 7.4 using 1 M sodium hydroxide solution
(J.T. Baker, E31H10). The media was sterilized by vacuum filtration using a low protein
binding media filter (Corning 0.22 µm, 431097). Then after filtration 50 mL fetal bovine
serum (FBS) was added (Atlanta Biologicals, S12450).
1.4.2 Purification of 1D NPs
The TMV, TMVRGD1 and PVX were harvested from the infected leaves according
0.2% -mercaptoethanol was added into crashed leaves, and centrifuged at 9000 rpm for
15 min. The supernatant was clarified with equal volume of CHCl3 and n-butanol (1:1
ratio). Toward the aqueous supernatant, 10% PEG800 and 0.2 M NaCl were added to
precipitate TMV. After the centrifugation, the pellets were resuspended in 10 mM
phosphate buffer. Finally, the pure viruses were obtained after the process of
ultracentrifugation for 2.5 h at 42 000 rpm (rotor Ti 75).
1.4.3 Filamentous Bacteriophage.
M13 was harvested from the infected E. coli according to previously reported
method.38,63 Briefly, 1 L of E. coli ER2738 culture was grown in LB-tet media to mid-log
phase and infected with 1 mL of wild type M13 bacteriophage (1012 PFU/mL). The
culture was incubated at 37 C with shaking for 5-6 h, centrifuged to remove bacterial
cells, the virus collected by PEG-NaCl (20% PEG and 2.5 mol·L-1 NaCl) precipitation
and reconstituted in Tris buffer.
1.4.4 Synthesis of TMV-Aniline Fibers
TMV-Aniline fibers was synthesized according to reported method.64 Briefly,
distilled aniline (10 L) and ammonium persulfate (10 mg·mL-1, 1 mL) were added to TMV
solution (1 mg·mL-1, 4 mL). The reaction was taken at room temperature for 24 h. The
reaction mixture was purified by dialysis for 5 h.
1.4.5 Synthesis of Gold Nanorods (GNRs)
GNRs was synthesized according to the seed-mediate growth method.45 The seed
solution is prepared as follows: the 0.6 mL ice-cold NaBH4 (10 mM) was added into the
of the seed solution for 3 minutes. The growth solution was prepared by mixing CTAB
solution (0.2 M) and HAuCl4 (0.5 mM) with same volume. The GNRs growth was
achieved by three steps: 1) 0.2 mL seeding solution was added into 2 mL growth solution,
which was transferred to 20 mL growth solution after 10 s; 2) after 30 s, the solution in
step 2 was poured into 200 mL growth solution; 3) the GNRs was synthesized by
incubating the solution at 25 C for 18h. The GNRs was purified by centrifuge with spin
speed 4000 rpm for 8 min. After re-dispersed into water, the GNRs were used for the
assembly.
1.4.6 Modifications of Capillary Tube
The polyelectrolytecoated capillaries were obtained by alternatively immersing
capillaries in PDDA (1 mg·mL-1) for 20 min and PSS or PAA solution (1.0 mg·mL-1) for
20 min, until (PDDA/PAA)3 or (PDDA/PSS)3 are obtained, where the value 3 indicates the
number of bilayers. Water was used to rinse in between each deposition step until the
desired number of layers was obtained. For chitosan modified capillaries: By immersing
into chitosan (1 mg·mL-1 in 0.1% acetic acid at pH=6.5), the chitosan coated capillaries
were obtained. The resulting samples were washed by water before using. The APTES
modified capillaries: Capillaries were immersed into 1% APTES in ethanol/water (95:5 by
volume) for 10 min and washed with pure ethanol three times, and dried with Nitrogen,
then incubated in vacuum at 120-130 C for one hour.
1.4.7 Flow Assembly of 1D NPs
Typically, 10 mL solution containing 1 D NPs was injected into the 1D NPs feeder
connected to capillary tube. The solution was driven through the capillary tube, and dried
by the following gas. The flow rate of solution was controlled by the gas pressure applied
to the flow.
1.4.8 Characterization of 1D NPs
A solution of 1D NPs was dropped on the glow-discharged Formvar-carbon coated
copper grid. After drying, the sample was negatively stained with 2% uranyl acetate for
TEM (Philips CM-12 transmission electron microscope at 80 kEV) observation. The
surface morphology was observed by AFM (SPA300, Seiko) in the tapping mode. The
angles of 1D NPs were measured with ImageJ software and then plotted in angular
distribution histograms. For M13, segments longer than 500 nm were measured for plot.
1.4.9 Cell Culture
The murine-derived muscle cell line, C2C12, was purchased from American Type
Culture Collection (ATCC, Manassas, VA). Cells were cultured in Dulbecco’s modified
Eagle’s medium (DMEM, #D6046, Sigma–Aldrich) supplemented with 10% heat
inactivated fetal bovine serum (Hyclone, Thermo Scientific), 100 U·mL-1 penicillin and
100 μg·mL-1 streptomycin (Gibco BRL, Invitrogen Corp., Carlsbad, CA, USA). C2C12 at
80-90% confluency were detached and re-suspend into culture medium in a concentration
of 2 × 10⁶ cells per mL. The capillary tubes with TMV particles sucked the cell suspension.
After 5 hours, put the tubes with cells into the 12 well plates with culture medium. After
three days, the cells were shifted to differentiation medium (DM), which is DMEM
supplemented with 2% horse serum (Lonza Inc., Williamsport, PA). The medium was
1.4.10 Immunofluorescence Microscopy
Differentiated C2C12 cells were washed once with PBS and fixed with 4%
paraformaldehyde (Sigma-Aldrich, P6148) in PBS for 15 minutes. Cells were then blocked
with 5% goat serum and 0.3% TritonX100 for 60 min in PBS. The cells were incubated
with MF20 (anti-myosin heavy chain (MHC), Developmental Studies Hybridoma Bank
(DSHB), University of Iowa, IA) overnight at 4 °C and followed by ChromeoTM 642 Goat
anti-Mouse lgG (Active motif, Germany) and DAPI (Sigma, USA) in dark. Cells then were
imaged using an Olympus IX81 microscope. The images were analyzed with ImageJ
software. The images obtained from the MHC and DAPI signals were pseudo-colored red
and blue respectively.
1.4.11 Calculation of Fusion Index and Maturation Index
The fusion index was calculated by determining the ratio of nuclei number in
myocytes with two or more nuclei over the total number of nuclei. The maturation index
was the percentage of myotubes with five or more nuclei. Because the cells are in the
capillary tubes, cells on the edge were out of focus in images with low magnification. Cells
on the edge, which were out of focus, were not used for analysis.
1.4.12 Statistical Analysis
Statistical analysis for mean comparison was performed by using one-way analysis
of variance (ANOVA) Turkey’s test in OriginPro 8.5. All data values in this study were
Table 1.1. Sample preparation conditions and results.
Note: a The subscript in this column noted as the modification cycle number; and the
modification methods are shown in experimental part. b The sample was washed by water
(Y) or not (N) before it was dried. c The aligned structure asFigure 1.1e can be obtained
(Y) or not (N).
Table 1.2. Parameters of different 1D NPs used in experiments.
1D NPs TMV PVX TMV-Aniline
fiber M13 GNRs
Contour length L (nm) 300 550 4, 000 880 350
Diameter (nm) 18 13.5 18.5 4.5 25
Aspect ratio 17 41 216 196 16
Persistent length P (mm) ~1, 00065 - - 1.2766 -
Modulus (GPa) 1.167-68 0.8567 1.2366 0.6267-68 6469
Samples Modification a Surface
charge
Phosphate buffer concentration
(mM)
Flow rate ( cm·s-1)
Washed before
dryb
Results
HPW ()c coverage Surface
(%)
Typical Chitosan1 + 0 200 N 28 (Y) 96
Control 1 Chitosan1 + 0 0 N 176 (N) 44
Control 2 PDDA1 + 0 200 N 29 (Y) 88
Control 3 APTES1 + 0 200 N 29 (Y) 87
Control 4 (PDDA/PSS)3 - 0 200 N 170 (N) 5
Control 5 (PDDA/PAA)3 - 0 200 N 169 (N) 8
Control 6 Glass Neutral 0 200 N 172 (N) 10
Control 7 Chitosan1 + 50 200 N 46 (N) 57
1.5 REFERENCE
1. Zan, X.; Feng, S.; Balizan, E.; Lin, Y.; Wang, Q. Facile method for large scale
alignment of one dimensional nanoparticles and control over myoblast orientation and
differentiation. ACS Nano 2013,7 (10), 8385-96.
2. Tay, C. Y.; Irvine, S. A.; Boey, F. Y. C.; Tan, L. P.; Venkatraman, S.
Micro-/Nano-engineered Cellular Responses for Soft Tissue Engineering and Biomedical Applications.
Small 2011,7 (10), 1361-78.
3. Chung, W. J.; Oh, J. W.; Kwak, K.; Lee, B. Y.; Meyer, J.; Wang, E.; Hexemer, A.;
Lee, S. W. Biomimetic self-templating supramolecular structures. Nature 2011, 478
(7369), 364-8.
4. Sun, B. Q.; Sirringhaus, H. Surface tension and fluid flow driven self-assembly of
ordered ZnO nanorod films for high-performance field effect transistors. J Am Chem Soc
2006,128 (50), 16231-7.
5. Duan, X. F.; Niu, C. M.; Sahi, V.; Chen, J.; Parce, J. W.; Empedocles, S.; Goldman,
J. L. High-performance thin-film transistors using semiconductor nanowires and
nanoribbons. Nature 2003,425 (6955), 274-8.
6. Murphy, C. J.; San, T. K.; Gole, A. M.; Orendorff, C. J.; Gao, J. X.; Gou, L.;
Hunyadi, S. E.; Li, T. Anisotropic metal nanoparticles: Synthesis, assembly, and optical
applications. J Phys Chem B 2005,109 (29), 13857-70.
7. Xia, Y. N.; Yang, P. D.; Sun, Y. G.; Wu, Y. Y.; Mayers, B.; Gates, B.; Yin, Y. D.;
Kim, F.; Yan, Y. Q. One-dimensional nanostructures: Synthesis, characterization, and
8. Hone, J.; Llaguno, M. C.; Nemes, N. M.; Johnson, A. T.; Fischer, J. E.; Walters, D.
A.; Casavant, M. J.; Schmidt, J.; Smalley, R. E. Electrical and thermal transport properties
of magnetically aligned single walt carbon nanotube films. Appl Phys Lett 2000, 77 (5),
666-8.
9. Wang, X. B.; Liu, Y. Q.; Yu, G.; Xu, C. Y.; Zhang, J. B.; Zhu, D. B. Anisotropic
electrical transport properties of aligned carbon nanotube films. J Phys Chem B 2001,105
(39), 9422-5.
10. Heo, K.; Cho, E.; Yang, J.-E.; Kim, M.-H.; Lee, M.; Lee, B. Y.; Kwon, S. G.; Lee,
M.-S.; Jo, M.-H.; Choi, H.-J.; Hyeon, T.; Hong, S. Large-Scale Assembly of Silicon
Nanowire Network-Based Devices Using Conventional Microfabrication Facilities. Nano
Letters 2008,8 (12), 4523-7.
11. Rao, S. G.; Huang, L.; Setyawan, W.; Hong, S. Nanotube electronics: large-scale
assembly of carbon nanotubes. Nature 2003,425 (6953), 36-7.
12. Li, L. S.; Alivisatos, A. P. Semiconductor nanorod liquid crystals and their
assembly on a substrate. Adv Mater 2003,15 (5), 408-11.
13. Javey, A.; Nam; Friedman, R. S.; Yan, H.; Lieber, C. M. Layer-by-Layer Assembly
of Nanowires for Three-Dimensional, Multifunctional Electronics. Nano Letters 2007,7
(3), 773-7.
14. Fan, Z.; Ho, J. C.; Jacobson, Z. A.; Yerushalmi, R.; Alley, R. L.; Razavi, H.; Javey,
A. Wafer-Scale Assembly of Highly Ordered Semiconductor Nanowire Arrays by Contact
15. Takahashi, T.; Takei, K.; Ho, J. C.; Chueh, Y.-L.; Fan, Z.; Javey, A. Monolayer
Resist for Patterned Contact Printing of Aligned Nanowire Arrays. J Am Chem Soc 2009,
131 (6), 2102-3.
16. Harnack, O.; Pacholski, C.; Weller, H.; Yasuda, A.; Wessels, J. M. Rectifying
behavior of electrically aligned ZnO nanorods. Nano Letters 2003,3 (8), 1097-101.
17. Huang, Y. Directed Assembly of One-Dimensional Nanostructures into Functional
Networks. Science 2001,291 (5504), 630-3.
18. Raez, J.; Moralez, J. G.; Fenniri, H. Long-range flow-induced alignment of
self-assembled rosette nanotubes on Si/SiOx and poly(methyl methacrylate)-coated Si/SiOx. J
Am Chem Soc 2004,126 (50), 16298-9.
19. Kim, F.; Kwan, S.; Akana, J.; Yang, P. D. Langmuir-Blodgett nanorod assembly. J
Am Chem Soc 2001,123 (18), 4360-1.
20. Phillips, J. B.; Bunting, S. C. J.; Hall, S. M.; Brown, R. A. Neural tissue
engineering: A self-organizing collagen guidance conduit. Tissue Eng 2005, 11 (9-10),
1611-7.
21. Crabb, R. A. B.; Chau, E. P.; Evans, M. C.; Barocas, V. H.; Hubel, A.
Biomechanical and microstructural characteristics of a collagen film-based corneal stroma
equivalent. Tissue Eng 2006,12 (6), 1565-75.
22. Zhu, Y. B.; Cao, Y.; Pan, J.; Liu, Y. X. Macro-Alignment of Electrospun Fibers
For Vascular Tissue Engineering. J Biomed Mater Res B 2010,92B (2), 508-16.
23. Wigmore, P. M.; Dunglison, G. F. The generation of fiber diversity during
24. Papadaki, M.; Bursac, N.; Langer, R.; Merok, J.; Vunjak-Novakovic, G.; Freed, L.
E. Tissue engineering of functional cardiac muscle: molecular, structural, and
electrophysiological studies. Am J Physiol-Heart C 2001,280 (1), H168-H178.
25. Grefte, S.; Kuijpers-Jagtman, A. M.; Torensma, R.; Von den Hoff, J. W. Skeletal
muscle development and regeneration. Stem Cells Dev 2007,16 (5), 857-68.
26. Daley, W. P.; Peters, S. B.; Larsen, M. Extracellular matrix dynamics in
development and regenerative medicine. J Cell Sci 2008,121 (3), 255-64.
27. Lanfer, B.; Seib, F. P.; Freudenberg, U.; Stamov, D.; Bley, T.; Bornhauser, M.;
Werner, C. The growth and differentiation of mesenchymal stem and progenitor cells
cultured on aligned collagen matrices. Biomaterials 2009,30 (30), 5950-8.
28. Lin, Y.; Balizan, E.; Lee, L. A.; Niu, Z. W.; Wang, Q. Self-Assembly of Rodlike
Bio-nanoparticles in Capillary Tubes. Angew Chem Int Edit 2010,49 (5), 868-72.
29. Shirokikh, N. E.; Agalarov, S. C.; Spirin, A. S. Chemical and enzymatic probing of
spatial structure of the omega leader of tobacco mosaic virus RNA. Biochemistry-Moscow
2010,75 (4), 405-11.
30. Lee, L. A.; Nguyen, Q. L.; Wu, L. Y.; Horyath, G.; Nelson, R. S.; Wang, Q. Mutant
Plant Viruses with Cell Binding Motifs Provide Differential Adhesion Strengths and
Morphologies. Biomacromolecules 2012,13 (2), 422-31.
31. Wu, L. Y.; Zang, J. F.; Lee, L. A.; Niu, Z. W.; Horvatha, G. C.; Braxtona, V.;
Wibowo, A. C.; Bruckman, M. A.; Ghoshroy, S.; zur Loye, H. C.; Li, X. D.; Wang, Q.
Electrospinning fabrication, structural and mechanical characterization of rod-like
32. Kobayashi, M.; Seki, M.; Tabata, H.; Watanabe, Y.; Yamashita, I. Fabrication of
Aligned Magnetic Nanoparticles Using Tobamoviruses. Nano Letters 2010,10 (3), 773-6.
33. Xu, H.; Cao, B. R.; George, A.; Mao, C. B. Self-Assembly and Mineralization of
Genetically Modifiable Biological Nanofibers Driven by beta-Structure Formation.
Biomacromolecules 2011,12 (6), 2193-9.
34. Gilliland, A.; Singh, D. P.; Hayward, J. M.; Moore, C. A.; Murphy, A. M.; York,
C. J.; Slator, J.; Carr, J. P. Genetic modification of alternative respiration has differential
effects on antimycin A-induced versus salicylic acid-induced resistance to Tobacco mosaic
virus. Plant Physiol 2003,132 (3), 1518-28.
35. Wu, L. Y.; Lee, L. A.; Niu, Z. W.; Ghoshroy, S.; Wang, Q. Visualizing Cell
Extracellular Matrix (ECM) Deposited by Cells Cultured on Aligned Bacteriophage M13
Thin Films. Langmuir 2011,27 (15), 9490-6.
36. Kaur, G.; Valarmathi, M. T.; Potts, J. D.; Jabbari, E.; Sabo-Attwood, T.; Wang, Q.
Regulation of osteogenic differentiation of rat bone marrow stromal cells on 2D nanorod
substrates. Biomaterials 2010,31 (7), 1732-41.
37. Zhu, H. B.; Cao, B. R.; Zhen, Z. P.; Laxmi, A. A.; Li, D.; Liu, S. R.; Mao, C. B.
Controlled growth and differentiation of MSCs on grooved films assembled from
monodisperse biological nanofibers with genetically tunable surface chemistries.
Biomaterials 2011,32 (21), 4744-52.
38. Wu, L.; Lee, L. A.; Niu, Z.; Ghoshroy, S.; Wang, Q. Visualizing Cell Extracellular
Matrix (ECM) Deposited by Cells Cultured on Aligned Bacteriophage M13 Thin Films.
39. Rong, J.; Lee, L. A.; Li, K.; Harp, B.; Mello, C. M.; Niu, Z.; Wang, Q. Oriented
cell growth on self-assembled bacteriophage M13 thin films. Chemical Communications
2008, (41), 5185-7.
40. Sitasuwan, P.; Andrew Lee, L.; Bo, P.; Davis, E. N.; Lin, Y.; Wang, Q. A plant
virus substrate induces early upregulation of BMP2 for rapid bone formation. Integrative
Biology 2012,4 (6), 651-60.
41. Niu, Z.; Bruckman, M. A.; Li, S.; Lee, L. A.; Lee, B.; Pingali, S. V.; Thiyagarajan,
P.; Wang, Q. Assembly of Tobacco Mosaic Virus into Fibrous and Macroscopic Bundled
Arrays Mediated by Surface Aniline Polymerization. Langmuir 2007,23 (12), 6719-24.
42. Lanfer, B.; Freudenberg, U.; Zimmermann, R.; Stamov, D.; Körber, V.; Werner, C.
Aligned fibrillar collagen matrices obtained by shear flow deposition. Biomaterials 2008,
29 (28), 3888-95.
43. Steinmetz, N. F.; Mertens, M. E.; Taurog, R. E.; Johnson, J. E.; Commandeur, U.;
Fischer, R.; Manchester, M. Potato Virus X as a Novel Platform for Potential Biomedical
Applications. Nano Letters 2009,10 (1), 305-12.
44. Niu, Z.; Bruckman, M.; Harp, B.; Mello, C.; Wang, Q. Bacteriophage M13 as a
scaffold for preparing conductive polymeric composite fibers. Nano Research 2008,1 (3),
235-41.
45. Murphy, C. J.; Sau, T. K.; Gole, A. M.; Orendorff, C. J.; Gao, J.; Gou, L.; Hunyadi,
S. E.; Li, T. Anisotropic Metal Nanoparticles: Synthesis, Assembly, and Optical
46. Menagen, G.; Macdonald, J. E.; Shemesh, Y.; Popov, I.; Banin, U. Au Growth on
Semiconductor Nanorods: Photoinduced versus Thermal Growth Mechanisms. J Am Chem
Soc 2009,131 (47), 17406-11.
47. Chaney, S. B.; Shanmukh, S.; Dluhy, R. A.; Zhao, Y. P. Aligned silver nanorod
arrays produce high sensitivity surface-enhanced Raman spectroscopy substrates. Appl
Phys Lett 2005,87 (3).
48. Perez-Juste, J.; Rodriguez-Gonzalez, B.; Mulvaney, P.; Liz-Marzan, L. M. Optical
control and patterning of gold-nanorod-poly(vinyl alcohol) nanocomposite films. Adv
Funct Mater 2005,15 (7), 1065-71.
49. Aubin, H.; Nichol, J. W.; Hutson, C. B.; Bae, H.; Sieminski, A. L.; Cropek, D. M.;
Akhyari, P.; Khademhosseini, A. Directed 3D cell alignment and elongation in
microengineered hydrogels. Biomaterials 2010,31 (27), 6941-51.
50. Faureau, C.; Delbarre, E.; Courvalin, J. C.; Buendia, B. Differentiation of C2C12
myoblasts expressing lamin A mutated at a site responsible for Emery-Dreifuss muscular
dystrophy is improved by inhibition of the MEK-ERK pathway and stimulation of the
PI3-kinase pathway. Exp Cell Res 2008,314 (6), 1392-405.
51. Li, B.; Lin, M.; Tang, Y.; Wang, B.; Wang, J. H. C. A novel functional assessment
of the differentiation of micropatterned muscle cells. J Biomech 2008,41 (16), 3349-53.
52. Fanzani, A.; Stoppani, E.; Gualandi, L.; Giuliani, R.; Galbiati, F.; Rossi, S.; Fra,
A.; Preti, A.; Marchesini, S. Phenotypic behavior of C2C12 myoblasts upon expression of
the dystrophy-related caveolin-3 P104L and TFT mutants. Febs Lett 2007,581 (26),