THE
INTERGRADATION, GENETIC INTERCHANGEABILITY AND INTERPRETATION OF GENE CONVERSIONSPECTRUM TYPES
BERNARD C. LAMB AND AGLAIA GHIKAS
Botany Department, Imperial College, London SW7 ZBB, England
Manuscript received August 14,1978
Revised copy received November 21,1978
ABSTRACT
In the Pasadena strains of Ascobolus immersus, the gene conversion prop-
perties of 29 induced (nine UV, nine NG, and 11 ICR-170) and nine spon-
taneous white-ascospore mutations have been studied. Each mutant was cyossed
to three types of derived wild-type strains; single mutants often gave very
different conversion results in the three types of crosses, with any or all of
the following changes in: percentage with post-meiotic segregation among
aberrant-ratio asci; percentage with conversion to wild type among aber-
rant-ratio asci; and in total conversion frequency.
-
These results arecompared with those of LEBLON (1972 a, b) from Ascobolus immersus and
Yu-SUN, WICRRAMARATNE and WHITEHOUSE (1977) from Sordaria breui- collis. It is shown that conversion spectrum types are not necessarily distinct, but can completely intergrade, on the criteria of both post-meiotic segregation
frequency and direction of correction. Genetic differences between strains in
the present work resulted in much interchangeability of spectrum types
for the same mutation in different crosses; e.g., from type C in one cross to
type B/D type in another cross, although the mutation is presumably of the same molecular type (addition or deletion frame shift, or base substitution) in each cross. These changes of conversion properties for a given mutation i n different crosses mean that previous interpretations of spectrum types in terms of specific conversion properties for various molecular types of muta- tion are inapplicable, or inadequate on their own, to explain the present data. Other factors, such as heterozygous cryptic mutations or conversion control genes, are probably involved. Because of asymmetric hybrid DNA formation, correction properties may differ from observed conversion properties.
ENE conversion spectrum types were defined by LEBLON (1972a) as: (1)
G T y p e
A, post-meiotic segregation (PMS) asci rare, excess of conversion to wild type (+) ; (2) type B, PMS asci rare, excess of conversion to mutant ( m ) ;(3) type C, many PMS asci, excess of conversion to
f;
and(4)
type D, many PMS asci, excess of conversion to m. PMS asci “rare” or “many” was in relation to other aberrant segregation ratios, not to the total number of asci. We have investigated the following questions. Are conversion spectrum types distinct, or do they intergrade? Is there a consistent relation between a mutation’s molecular nature (addition or deletion frame shift, or base substitution), or the mutagen used, and its spectrum type? Can a given mutation give different spectrum types in crosses to different strains, and if so, how?50 B . C. LAMB A N D A. GHIKAS
In stock 28 of Ascobolus immersm,
LEBLON
(1 972a) found a correlation be- tween the mutagen used and conversion spectrum types of the mutation (see Figure 3 (a) and (b), present paper). He concluded (1972b) that frame-shift additions gave spectrum typeB,
frame-shift deletions gave type A and that base substitutions gave C orD
types. An indication that spectrum types were not fixed for a given mutation came fromLAMB
andWICKRAMARATNE
(1975) using Ascobolus. Spontaneous mutations w-78 and w-10 both gave spectrum types C orD,
depending on temperature and on the genetic control factors present.Yu-SUN,
WICKRAMARATNE andWHITEHOUSE
(1977) found some correlation in Sordaria breuicollis between the mutagen used and spectrum type (Figure 3 (c),
present paper). They concluded that types A andB
really were distinct, but that C andD
intergraded, and they suggested treatingC
and D as one category, which they called class C.In the present work with Pasadena strains of Ascobolus immersus, we studied the conversion properties of nine UV (ultra-violet induced)
,
nine NG (N-methyl-N’-nitro-N-nitrosoguanidine induced)
,
11 ICR (ICR-170 induced) and nine spontaneous white-ascospore mutations. Each mutant was crossed to three dif- ferent derived wild-type stocks to study possible effects of genetic factors on spectrum types. We examined our data and those of LEBLON (1972a,b) andYu-SUN,
WICKRAMARATNE andWHITEHOUSE
(1 977) to see if conversion spec- trum results fell into distinct categories onLEBLON’S
two criteria: “PMS asci rare or many” (here measured as the percentage of aberrant ratio asci withPMS)
and “excess of conversion to wild-type or to mutant” (here measured on the scale of percentage conversion to wild type in aberrant ratio asci).MATERIALS A N D METHODS
Strains, media and general methods: All Pasadena strains of the fungus Ascobolus immer- sus are ultimately derived from two wild-type isolates of opposite mating-type, P5- and K5+
(EMIERSON and Yu-SUN 1967). A pedigree chart of the strains used was given by GAIKAS (1978), and LAMB and HELMI (1978) gave an account of genetic control factors P , K and 91
(affecting conversion of most locus I mutants) by which the derived wild types used here are
known to differ, though they probably differ in many other ways, too. Derived wild types 9r+,
25-5Rf, 3r-, 92-, BBRI-, BHR2- and 61- carry P ; KIV+ and KIII- carry K ; 352+
and 42- carry 91. General media, methods and tests for reversion, phenocopies and false octads
were as described by GHIKAS and LAMB 1977. All crosses were made a t 17.5”, using replicates
and repeats, with a total of about five or six plates per cross.
Muiation induction: For UV, two wild-type strains of opposite mating type were inoculated
at opposite edges of a 9cm diameter Petri dish containing crossing medium. After three or four
days, when the resulting colonies had nearly met, dishes were exposed to 60 seconds UV from
a CAMAG Universal UV lamp, a t 300 ergs per sec per cm2. Plates were then incubated in the
dark for 24 hr, thqn in continuous light. For NG, 4 c m diameter Petri dishes with crossing
medium were covered with a single layer of cellophane (British Sidac Ltd) and were inocu- lated with one mating type of wild type. 9 cm diameter Petri dishes containing crossing medium,
without cellophane, were inoculated at the same time with the opposite mating type o f wild
type. After three days at 17.5“, the cellophane disks plus mycelium were peeled off and treated
with 50 cg per ml NG in p H 7.0 phosphate buffer for ten min. The cellophane plus mycelium was
rinsed three times in liquid minimal medium and then transferred, mycelium downwards,
G E N E CONVERSION S P E C T R U M T Y P E S
51
six hr, the cellophane was removed, leaving the mycelia to cross. For ICR-170, a similar pro-
cedure was used, but with 10 gg per m l in p H 7.0 buffer, treating for 120 min i n the dark.
In all cases, spore color mutants were detected by examining dehisced octads for 4
red(+) :4 white (w) segregations, followed by isolation and germination of the white spores.
For the UV, NG and ICR experiments, unexposed controls gave 0.21,0.20 and 0.18% of 4+:4w
octads out of totals of 20,868’27,556 and 29,153 octads, respectively, as the spontaneous mutation
levels. The exposed samples for UV, NG and ICR gave corresponding 4+:4w frequencies of
0.56, 1.23 and 4.86% in samples of 3,761, 13,786 and 15,984 octads, respectively, so that the
chances of supposedly induced mutations being spontaneous were one in 2.7 for UV, one in
6.2 for NG, and one in 27 for ICR. The ICR-170 was kindly supplied by H. J. CREECH.
Mapping the mutations: All mutations were crossed to w-78 (locus I) and inter se, but many
crosses were sterile. The origin and recombination data of mutants were given by GHIKAS
(1978). As cis/trans tests of functional allelism are not usually practicable for spre-color mutants in haploid ascospores, a rather arbitrary mapping criterion was used: mutants at the
same ‘‘locus’’ were taken as those showing at least 99% 0 red:8 white octads (parental “ditypes”) i n repulsion crosses.
RESULTS A N D DISCUSSION
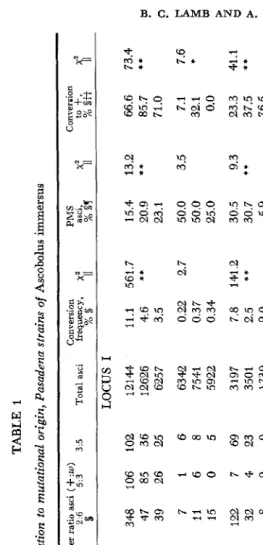
Table 1 shows the gene conversion results for our mutants crossed to the P, K and 91 carrying derived wild-type strains. Data are shown for narrower ratio aberrant segregation classes, 6+:2w (all ratios shown as
+:
w),
2:6 , 5 :
3 and 3:5 ,
but for brevity the much rarer wider ratio classes 8:0, 0: 8, 7: 1 and 1: 7 are omitted. Complete data were given by GHIKAS (1978). There was generally good agreement between repeats and replicates of each cross. Thex2
tests in Table 1 show that differences between crosses of a given mutation to different strains were often, though not always, significant at the 5 % or 1’% levels for%
conver- sion,%
post-meiotic segregation or%
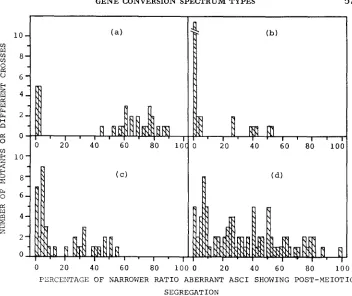
conversion to wild type.Are conversion spectrum types distinct? Figure 1 shows the data of
LEBLON
(1972a) for Ascobdus, of
YU-SUN, WICKRAMARATNE
andWHITEHOUSE
(1977) for Sordaria brevicollis, and of the present Ascobolus work, plotting a frequency distribution for the first of LEBLON’S (1972a) criteria for conversion spectrum types, namely the relative frequency of PMS asci, here given as the percentage of narrower ratio aberrant asci showingPMS;
5:3
+
3:5
6 : 2 + 2 : 6 + 5 : 3 + 3 : 5
x
100.For LEBLON’S (1972a,b) lolcus b, and perhaps for b, [Figure 1 (a) and (b),
respectively], a distinction can be made between PMS “rare” (0 to 5.4%) and
PMS
“many” (26.1 to 88.4%). Such a distinction is far less clear in the data ofYU-SUN, WICKRAMARATNE
andWHITEHOUSE
(1977) [Figure 1 ( c ) ] although there is a slight break in the distribution between 13.8% and 20.7%. Our own data [Figure 1 (d)] show a virtually continuous distribution, and one can not make any qualitative distinction between “PMS rare” and “PMS many.” Con- version spectrum types are therefore not distinct on the PMS criterion; they completely intergrade.TABLE 1 Conversion data in relation to mutational origin, Pasadena strains of Ascobolus immersus
Mutant W-78 UVKw8 NGw5 3C1 Sw26 NGwl8
Origin
t S U N I S N
Crossed
to:
t
61-(P) KIII-
(K)
42-
(91)
61-(P) KIII-(K) 42-(91) 61-(P) KIII-
(K)
42-(91) 61-(P) KIII-
(K)
42-(91) 92-(P) 42
(-9 1 ) 92- (P) KIII- (K) 42-(91) Narrower ratio asci (4- :w) 0 4:4 6:Z 2 6 5:3 10773 792 348 106 12043 411 47 85 6031 131 39 26 6328 0 7 1 7513 3 11 6 5902 0 15 0 2947 51 122 7 3412 29 32 4 1696 24 8 2 3087 141 221 0 1180 17 19 0 1707 20 19 1 5976 12 4 7 8028 1 3 16 5508 136 41 M 10242 12 0 4 8257 180 30 50 Conversion 3:5 Total asci frequency, xz XI It LOCUS I 102 12144 11.1 561.7 36 12626 4.6 ** 25 625 7 3.5 6 6342 0.22 2.7 8 7541 0.37 5 5922 0.34 69 3197 7.8 141.2 23 3501 2.5 ** 0 1730 2.0 1 3452 10.5 23.4 2 1218 3.1 ** 1 1749 2.3 LOCUS I1 1 6000 0.40 0.0 12 8060 0.40 22 5753 4.2 354.6 2 10260 0.18 ** 22 8541 3.3
PMS asci, %
§'I
15.4 20.9 23.1 50.0 50.0 25.0 30.5 30.7 5.9 0.3 5.3 4.9 33.3 87.5 27.2 33.3 25.5
X' il
Conversion
13.2 ** 3.5 9.3 ** 13.3 ** 17.5 ** 0.6
66.6 73.4 85.7 ** W 71.0 0 7.1 7.6
5
0.0E
32.1 * 2- 23.3 41.1 37.5 ** ? 76.5 0 38.8 2.7 eE. 7 51.2 cn 79.2 4.1 53.1 * 74.1 5.0TABLE 1-Continued Narrower ratio asci (
+
:w) Mutant Origin Crossed to: 4:4 6:2 2:6 5:3 3:5 t x 9 Conversion Total asci frequency, xa ?As It NGwl1 N92-(P) KIII-(K) 42-(91)
NGw12
N
92-(P) 42-(91)
BB9w9
U
92-(P) BBRl-
(P) 42-(91) 10916 8 2 6 2 4227 6 3 6 1 4392 25 4 32 0 7500 4 6 14 0 12176 8 16 4 2 4828 2 0 9 0 6817 10 24 11 0 5460 7 28 3 0 4312 8 20 10 0 5062 4 8 4 14 54?38 2 7 6 9 5925 6 10 2 9 9981 6 15 3 5 8325 3 3 6 4 7659 81 46 8 2 700 54 4 42 6 7069 67 25 7 1 LOCUS 111 10934 0.16 4247 0.38 4458 1.4 7524 0.32 lE206 0.25 4841 0.23 6862 0.66 5490 0.69 4352 0.87 LOCUS IV 5092 0.59 5522 0.43 5952 0.45 10010 0.29 8347 0.19 OTHER LOCI 7796 1.8 808 13.1 7169 1.4
104.5 ** 0.9 5.1 1.5 0.1 499.8 **
PMS Conversion asc1, xz % B’I II 44.4 0.6 77.8 6.6 52.5 93.4 58.3 15.3 75.0 13.1
2
20.0 ** 4Q.o **M La
81.8 100.0 24.4 5.0 46.7 4.6 0 43.8 75.0 *
M
3
2
7.9
26.3
2,
26.3
47.4
$ M D 4
26.7 0.3
E
60.0 3.0 4 62.5 33.3 40.7 29.6 27.6 5.2 31.0 2.7 cn 62.5 * 56.3 7.3 67.0 65.0 21.4 8.0 74.0 45.3 ** 90.6 **G E N E CONVERSION S P E C T R U M TYPES 55
M cnn$ M M m w 0 0 0 M 0 0 0
-
- o m56 B. C . LAMB A N D A . GHIKAS
a
3
3T r?
0.1
G E N E CONVERSION S P E C T R U M T Y P E S 57
0 2 0 40 6 0 80 1 0 0 0 20 40 6 0 80 1 0 0
PERCEIdTAGE O F NARROWER R A T I O ABERRANT A S C I SHOWING P O S T - M E I O T I C
SEGREGATION
FIGURE 1 .-Frequency distributions f o r percentage of narrower ratio aberrant asci showing
post-meiotic segregation. (a) and (b), data of LEBLON 1972a, for Ascobolus immersus; (a), b ,
locus, 31 mutants; (b), b, locus, 31 mutants. (c), data of Yu-SUN, WICKRAMARATNE and WHITE-
HOUSE (1977) for Sordaria brevicollis, loci grey-3, grey-4, grey-5; 39 mutants altogether. (d),
present work, Ascobolus immersus, many loci; 38 mutants, with each mutant crossed to three
types of wild type, giving a total of 87 fertile crosses.
. . .
0 2 0 4 0 6 0 80 101 0 2 0 4 0 6 0 80 1 0 0 0 2 0 4 0 6 0 80 1 0
P E R C E N T A G E OF NARROWER RATIO A B E R R A N T A S C I S H O W I N G CONVERSION TO WILD-TYPE
FIGURE 2.-Frequency distributions for percentage of narrower ratio aberrant asci showing
conversion to wild type. (a), Ascobolus data of LEBLON (197%) loci b, and b, results pooled;
(b), Sordaria data of Yu-SUN, WICKRAMARATNE and WHITEHOUSE (1977) ; (c), present work,
58 B. C. LAMB A N D A. GHIKAS
excess of con-tersion to wild type or to mutant, here given E S the percentage of
conversion to wild type in narrower ratio aberrant asci;
x
100. 6:2 -I- 5:36:2
+
2:6 5 : 3+
3 : sThe validity and determination of such conversion parameters on different recombination models were discussed by
WICKRAMARATNE
and LAMB (1978).In
LEBLON’S
data (Figure 2a), there is a possible small break in the distribu- tion between mutants with excess conversion to wild type (52.9 to 97.4% con- version to +) and those with excess conversion to mutant (0 to 45.8% conversion to +).
No
such break is apparent in the data of YU-SUN, WICKRAMARATNE andWHITEHOUSE
(1977) (Figure 2b), and our data (Figure 2c) show a virtually continuous distribution over the central range. Various studies with yeast (e.g.,FOGEL,
HURST
andMORTIMER
1971; FINK 1974; and LAWRENCE et al. 1975) showed approximately equal frequencies of conversion to+
and to m for dele- tions, frame shifts and base substitutions, with only a few marked exceptions to equality.It is thus clear from a number of fungi that conversion spectrum types are not distinct on the “excess of conversion to wild type or to mutant” criterion: they can completely intergrade, as they do on the percent PMS criterion. Spectrum types A,
B,
C andD
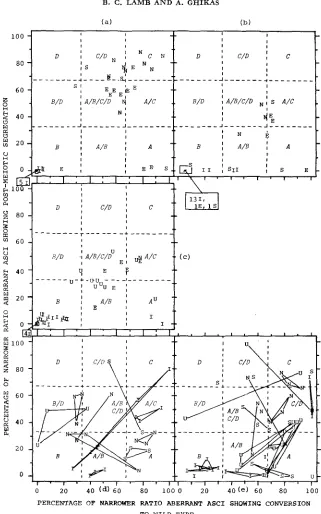
are therefore not truly distinct entities, but are parts of continuous distributions. This applies whether the two criteria are considered separately, as in Figures 1 and 2, or jointly as in Figure 3 .Is there a consistent relation between a mutation’s molecular nature, or the
mutagen used, and its spectrum type? Relevant data from Ascobolus and Sordaria
are shown in Figure 3 (a,b,c,d,e) where
E,
I,N, U
and S are points for individual mutations induced byEMS
(ethyl methanesulphonate),
ICR-170, nitrosoguani- dine, ultra-violet light and spontaneously occurring, respectively. The two axes, corresponding toLEBLON’S
(1972a) two criteria for conversion spectrum types, have each been divided into three equal parts, making nine squares delimiting single spectrum types, A,B,
C orD,
or intermediate types, e.g.,B/D.
In Figure 3 (a,b,c), each point represents a single mutation. I n Figure 3 (d,e), the three separate results for a single mutant crossed to three different derived wild types are shown connected. Thus the “I”s at each corner of a triangle represent three values for a single ICR-170-induced mutation crossed to three wild types. If only two or one crosses were fertile, there are two points joined by a line, or there is an isolated point, respectively.Spontaneous mutations, shown in Figure 3 (a,b,d,e), could be of any molecular type and gave a wide range of spectrum types: A, A/B, B, B/D, AJC,
A/B/C/D,
C, C/D and D. They contribute little information on the above question unless
their molecular types are identified by reversion studies.
The ICR mutants in LEBLON’S (1972a,b) data (Figure 3a,b) showed a clear
correlation between mutagen and spectrum type, giving type B or occasionally
A/B. His EMS mutations gave a less clear correlation, most giving A/B/C/D,
GENE CONVERSION SPECTRUM TYPES 59
plete correlation for EMS between mutagen used and spectrum types does not necessarily conflict with there being a correlation between molecular type of mutation and conversion spectrum, as EMS can cause frame shifts and base substitutions (the properties of the various mutagens are extensively discussed by AUERBACH (1976)
,
LEBLON (1972b) and YU-SUN, WICKRAMARATNE and WHITEHOUSE (1977). LEBLON’S NG mutants for locus b, gave C, C/D and A/B/C/D types, while for locus b, they gave A/BJC/D and A/B types. There is thus a vague correlation between NG and spectrum type, with the correlation being better for each locus considered separately, as%
PMS values were gen- erally lower for b, than b,.In Yu-SUN, WICKRAMARATNE and WHITEHOUSE’S data, Figure 3c, there is a convincing clustering of ICR results
in
theB
type, but with two A types as well. This is consistent with ICR-170 producing mainly addition frame shifts, but also some deletion frame shifts (see LEBLON 1972b, YU-SUN, WICKRAMARATNE and WHITEHOUSE 1977). There is a big scatter for UV mutants, with oneB
type, one A type, and the remainder over a wide range for%
conversion to+
and in the region 27.8 to 54% PMS. This remainder was classified into types C and D by YU-SUN, WICKRAMARATNE and WHITEHOUSE (1977), because PMS asci were common compared to their “PMS rare” categories, though in om diagrams based on percentages the values come in classesB/D,
A/B/CJD, A/C and A/B, not into C, CJD or D. The difference between YU-SUN, WICKRAMARATNE and WHITEHOUSE’S (1977) and our designations of spectrum types for most Sordaria UV mutants reflects the vagueness of the original spectrum type definitions, although they were satisfactory for LEBLON’S (1972a) data. None of the Sordaria%
PMS values, for any type of mutant, were as high as the clear class C, C/D or D values in the Ascobolus data (see Figure 3a,b,c,d,e) but more extensive results are required before concluding that this is a general difference between the organisms. The Sordaria EMS mutants gave a very loose clustering in the A/B/C/D, A/C and A/l3 regions.Summing up LEBLON’S ( 1972a,b) Ascobolus and YU-SUN, WICKRAMARATNE
and WHITEHOUSE’S (1977) Sordaria data, there is a fairly good correlation of spectrum type with mutagen for ICR, but wider spreads for EMS, NG, UV and spontaneons mutations, where the wider spreads for EMS and UV could be at least partly due to both being able to give frame shifts and base substitutions. Yeast data, however, do not fit this pattern. The studies of FOGEL,
HURST
and MORTIMER (1971)’ FINK (1974) and LAWRENCE et al. (1975) showed approxi- mately equal conversion to+
and to m for all molecular types of mutation: frame shifts, base substitutions and even a large deletion, with few exceptions to this equality.60 B. C . LAMB A N D A. GHIKAS
0 2 0 40 ( d ) 60 8 0 100 0 2 0 4 0 ( e ) 60 8 0 1 0 0 PERCENTAGE OF NARROWER RATIO ABERRANT ASCI SHOWING CONVERSION
TO WILD-TYPE
FIGURE 3.-Data points for % PMS and % conversion to wild type (in both cases as a %
of narrower ratio aberrant asci) in relation to conversion spectrum types, A , A / B , B , B / D , etc.
(areas separated by dashed lines), and origin of the mutant: E, I, N, U-induced by EMS, ICR
GENE CONVERSION SPECTRUM TYPES 61
agent, causing base substitutions, as MALLING (1967) found in Neurospora. If
ICR
gave base substitutions and hence type C spectra in our data, it is strange that it did not do so in LEBLON’S (1972a,b) Ascobolus work or in that of Yu-SUN, WICKRAMARATNE and WHITEHOUSE (1977) with Sordaria. It would clearly be- of interest to find out by reversion studies if our C and A/C type ICR mutations are base substitutions, and the B types frame shifts. These studies are i n progress, but are very slow because visual screening of millions of octads is required for these spore color mutants in the absence of suitable selective methods for detect- ing revertants. The points for NG and UV mutants are also very scattered in our data in Figure 3d,e, with at least one NG point in eight of the nine squares. If one looks in Figure 3d.e at the scatter of points for single mutants in crosses to the three wild types, some mutants give similar results in all three crosses, but others give very different spectrum types in crosses to different wild types, e.g., A in a cross to one wild type, B in a cross to another wild type; or C in one cross, A/B in another; or B/D in one cross, C in another.The correlation between mutagen and spectrum type is poor or nonexistent in these data. One could explain a single mutagen giving rise to different spect- rum types for different mutants if the mutagen could act in different ways or if some of the supposedly induced mutations were actually spontaneous, but here a single mutation can give rise to different spectrum types in crosses to different wild types. A given mutation is obviously unlikely to change from being a frame shift in one cross to being a base substitution in another, yet the spectrum type can change radically. This proves conclusively that a mutation’s conversion spectrum type does not depend solely on the molecular type of mutation involved, nor solely o n the mutagen used. The different spectrum types produced in crosses to different wild types can not be explained by some environmental differences between the crosses, because replicates and repeats for the same cross gave con- sistent results, and because the differences betweer? crosses to different wild types occurred when these crosses were made with same batch of medium, at the same time, and in the same incubator.
How can a single mutation give different spectrum types i n crosses to different wild types? The answer clearly lies in genetic differences between the derived wild types. Ascobolus immersus is a heterothallic, outbreeding fungus; thus, the two original isolates, P5- and K5+, are likely to have differed at many loci. Although some of the original differences may have been lost in the various
where individual points would have been too crowded to show clearly; e.g., in (a), “51” in a
box (to left of base of abscissa) with an arrow pointing to the small square at the 0/0 position
of the two axes indicates five ICR-induced mutants all giving values at the 0/0 position. In
(c), the 131, 1E and IS points were scattered through the area of the box the arrow points to.
(a) and (b), data of LEBLON (1972a) for Ascobolus immersus, ( a ) , b, locus; (b), b, locus;
(c), data of Yu-SUN, WICKRAMARATNE and WHITEHOUSE (1977) for Sordaria breuicollis; (d)
and ( e ) , present work, Ascobolus immersus: solid lines connect the points for a single mutation in crosses to three different types of wild type; triangles. lines or single points represent three,
two or one, respectively, of these crosses being sufficiently fertile. (d), loci I, 11, 111, IV; (e),
62 B. C. LAMB A N D A. GHIKAS
crosses that produced the derived strains (pedigree details given by GHIKAS 1978)
,
there has been no systematic inbreeding, so that the various strains prob- ably differ at many loci, usually in ways not phenotypically obvious.It can be seen in Figure 3d,e that the dramatic changes for a single mutation in crosses to different strains could be in
%
conversion to f only (horizontal changes in the Figure), in%
PMS only (vertical changes), or more commonly, in both these criteria. Locus I is closely linked to the control factors P, K and 91,by which the derived wild types were known to differ, and which usually con- trol conversion parameters for locus I alleles. Except for this expected case of locus I mutants, there is no consistent pattern of change in conversion parameters for other mutants with the particular derived wild types used. For example, for other mutants, the points of the triangles nearest the left-hand and bottom axes could equally well come from crosses to wild types carrying P, K o r 91, so that different sets of control factors were probably acting at other loci. As shown in Table 1, the large changes in
%
PMS and/or%
conversion to4-
were accom- panied by large (e.g., from 3.5 to 11.1% for w-78, 2.3 to 10.5% for 3C1, 0.2 to 4.2% for NG w-18, 1.6 to 15.3% for BBw-21), small or negligible changes in total narrower ratio conversion frequencies. These changes in total conversion frequency and many other conversion parameters were not restricted to any particular locus and resembled the effects of the P,K
and 91 control factors on locus I mutants (described by LAMB andHELMI
1978). There could be many of these systems of conversion control factors in the genome. For example, one wmutant might carry form a of a local control factor, as might one wild type, while another wild type has form b of the factor.
If
these control factors, like P, K and 91, showed incomplete dominance and/or &/trans position effects, then crosses of the mutant to these two wild types could give quite different con- version results. Control factors involving complete dominance could also give differences if thew
mutant strain and one wild type carried recessive alleles for the controls, with another wild type having the dominant form.Another explanation of conversion parameter changes in different crosses is the predicted presence of cryptic mutation differences between strains. As de- scribed by LAMB (1975), cryptic mutations are undetected base changes and when heterozygous would cause mispaired bases in hybrid
DNA,
just like a het- erozygous known mutation. Any known mutation near a heterozygous cryptic mutation could have its own intrinsic conversion properties altered, even masked, by co-conversion triggered by the cryptic mutation’s mispair. For example, the w strain and one wild type might both carry form a of a nearby cryptic mutation, while the second wild type carries form b. I n the cross of w to the first wild type, the cryptic mutation is then homozygous, forming no mispairs in hybridDNA
GENE CONVERSION SPECTRUM TYPES 63
The interpretation of gene conversion spectrum types: In our system, there was little correlation between spectrum type and mutagen used, so that the interpretation of conversion spectrum types is far less certain than was apparent from the results of LEBLON (1972a,b) and
YU-SUN,
WICKRAMARATNE andWHITEHOUSE
(1977). Because a single mutation in the present work could give different spectrum types in crosses to different strains, a mutation’s spectrum type in one cross can not be interpreted as indicating a particular molecular type of mutation. This does not mean that spectrum types are never a guide to molec- ular type, asLEBLON’S
(1972a,b) evidence is still valid. If in a given system, consistent correlations can be established between spectrum type and mutagen used, or the molecular type of mutation, then conversion spectrum types have good interpretative value for further mutants in that system. The contrast in the predictive value of spectrum types betweenLEBLON’S
(1972a,b) studies and ours could be due either to the particular loci studied in each case, and/or to differences between strain 28 and the Pasadena strains of Ascobolus immersus. Clearly one can not generalize interpretations even within one species.If the production of different spectrum types for a single mutation in crosses to different strains is due to differences between strains for genetic factors con- trolling conversion parameters and/or for cryptic mutations, then a program of repeated inbreeding between strains should reduce heterozygosity for such factors and facilitate the expression of any correlation between a mutation’s molecular type and its intrinsic conversion properties, simplifying the interpre- tation of spectrum types in that system.
Do “nonpairs” and “mispairs” in hybrid DNA affect conversion properties differently? LEBLON (1972b) suggested that his data on conversion criteria in relation to mutation type could
be
explained by a very high efficiency of enzymic recognition of “nonpairs” caused by heterozygous addition or deletion frame- shift mutations in hybrid DNA, and that “mispairs” caused by heterozygous base substitutions were corrected less often, hence having a higher%
PMS.
The frame shifts he identified as deletions gave excess Conversion to+,
and frame shifts identified as additions gave excess conversion to m. He suggested that, in a “nonpair,” the strand that lacks a nucleotide (relative to the other strand) usu- ally undergoes excision during repair; the single-strand loop with the extra base (s) of the nonpair tends not to be excised.Although these hypotheses are consistent with
LEBLON’S
(1972a,b) data and possibly with those of YU-SUN,WICKRAMARATNE
andWHITEHOUSE
(1977) (although addition and deletion frame shifts were not there separately iden- tified),
they seem contradicted by the present data where, for example, one par- ticularICR
mutation (Bw3.10) behaved like one ofLEBLON’S
(1972a,b) addi- tion frame shiits in one cro‘o8s (low%
PMS, excess of conversion to m ) but like one of LEBLON’S (1972a,b) presumed base substitutions in another cross (high%
PMS, excess of conversion to +). From the present work, one could only maintain the hypotheses of differential recognition of “nonpairs” and “ m i s -64 B. C. LAMB A N D A. GHIKAS
tions and/or conversion control factors were very frequent in our strains. affect- ing about half o w mutations. and can completely alter a mutation’s intrinsic properties in relation to
%
PMS (related to correction frequency) and%
con- version to+
(related to correciion direction).Ways in which this could happen were discussed by LAMB (1975), WICK- RAMARATNE and LAMB (1978) and LAMB and
HELMI
(1978). Where hetero- zygous cryptic mutations or control factors affect conversion of known mutations solely through co-conversion. the co-conversion could increase, but not decrease, the correction frequency of the known mutation. Thus, f o r a given known muta- tion crossed to several different wild types, the result with the lowest%
PMS could be the one with least effect of factors extrinsic to the known mutation. I n Figure 3d,e taking the lowest%
PMS values as the “most genuine” of each triangle o r pair of connected points for a single mutant crossed to different wild types. one still finds a wide range of spectrum types f o r mutations produced by each mutagen, e.g., ICR producing nearly as many A/C types, with excess con- version to+
and moderate%
PMS, as B types, with excess conversion to m and low%
PMS.A correlation between a mutant’s molecular type and its correction proper- ties when heterozygous might not always show LIP as a correlation with its detected conversion properties, which will depend on aspects of hybrid DNA formation as well as correction. This could be true of the
“%
conversion to+”
data if there is a significant proportion of asymmetric hybrid DNA (hybrid DNA formed in only one, not two, nonsister homologous chromatids at a site) and if asymmetric hybrid DNA can form with different frequencies in the two types of chromatid, f bearing and m bearing. With symmetric hybrid DNA formation (as on the HOLLIDAY 1964 and WHITEHOUSE 1963 models. and in the symmetric portions of mixed asymmetric/symmetric models, e.g.,MESELSON
and RADDING 1975), the two chromatids involved in hybrid DNA formation can be represented as +/m and +/m after hybrid DNA formation. With asym- metric hybrid DNA, they could be either: (1)
+/+
and +/m or (2) +/m and m/m. If (1) and (2) have different frequencies of formation (for example, due to heterozygous conversion control factors with &/trans effects: see LAMB and HELMI 1978), then the detected conversion direction results can differ from correction direction results. Thus, if +/m in (1) and (2) had equal chances of correcting to+
[detected as conversion in (1). giving 6 f : 2 m but not detected in ( 2 ) , when a normal 4+:4m ratio is produced] and to m [detected as conver- sion in ( 2 ) , giving 2: 6 but not in (1 ),
giving 4: 41, but (1) formed much more often than (2). then there would be much more detected conversion to+
than to m, although the mispair or nonpair corrected equally to+
or m.GENE CONVERSION SPECTRUM TYPES 65
tions and genetic conversion control factors are frequent, with prominent effects on conversion of the known mutations used, and if asymmetric hybrid DNA can form with different frequencies in the chromatids of two homologous chramosomes.
LITERATURE CITED
AUERBACH, C., 1976
EMERSON, S. and C. C. C. Yu-SUN, 1967
FINK, G. R., 1974
Mutaiion Research: Problems, Results and Perspectives. Chapman and Hall, London.
Gene conversion in the Pasadena strain of Ascobolus
immersus. Genetics 55: 39-47.
Properties of gene conversion of deletions in Saccharomyces cereuisiae. pp.
287-293. In: Mechanisms in Recombination. Edited by R. F. GRELL. Plenum Press, New
York and London.
Gene conversion in unselected tetrads from
multipoint crosses. Stadler Symposia 1 / 2 : 89-110.
Recombination mechanisms and the controls of gene conversion in Ascobolus
immersus. Ph.D. Thesis, Imperial College, London University.
The detection, in unordered octads, of 6+:2m and 2'-!-:6m
ratios with postmeiotic segregation, and of aberrant 4:4s, and their use in corresponding-site
interference studies. Genet. Res. 29 : 267-2.78.
FOGEL, S., D. D. HURST and R. K. MORTIMER, 1971
GHIKAS, A., 1978
GHIKAS, A. and B. C. LAMB, 1977
HOLLIDAY, R., 1964
LAMB, B. C., 1975
LAMB, B. C. and S. HELMI, 1978
LAMB, B. C. and M. R. T. WICKRAMARATNE, 1975
LAWRENCE, C. W., F. SHERMAN, F. JACKSON and R. A. GILMORE, 1975
A mechanism fo'r gene conversion in fungi. Genet. Res. 5: 282-304.
Cryptic mutations: their predicted biochemical basis, frequencies and effects
on gene conversion. Mol Gen. Genet. 137: 305-314.
A new type of genetic control of gene conversion, from Ascobolus immersus. Genet. Res. 32: 67-78.
Induced changes in gene conversion spectra.
Nature 258: 66-646.
Mapping and gene
conversion studies with the structural gene for iso-I-cytochrome c in yeast. Genetics 81:
Mechanism of gene conversion in Ascobolus immersus. I. Existence of a
correlation between the origin of mutants induced by different mutagens and their conver-
sion spectrum. Mol. Gen. Genet, 115: 3 6 4 8 . - , 1972b Mechanism of gene con-
version in Ascobolus immersus. 11. The relationships between the genetic alterations i n b,
or b, mutants and their conversion spectrum. Mol. Gen. Genet. 116: 322-335.
Mechanism of g-ne conversion in Ascobolus immersus.
111. The interaction of heteroalleles in the conversion process. Mol. Gen. Genet. 122:
165-182. 6 1 5-6'29,
LELILON, G., 1972a
LEBLON, G. and J-L. ROSSIGNOL, 1973
MALLING, H. V., 1967
turally related compounds in Neurospora. Mutation Res. 4: 265-274.
MESELSON, M. S. and C. M. RADDING, 1975
Natl. Acad. Sci. U.S. 72: 358-361.
WHITEHOUSE, H. L. K., 1963
acid. Nature 199: 1034-1010.
WICKRAMARATNE, M. R. T. and B. C. LAMB, 1978
and the control of conversion in Ascobolus immersus. Mol. Gen. Genet. 159: 63-73.
Yu-SUN, C. C. C., M. R. T. WICKRAMARATNE and H. L. K. WHITEHOUSE, 1977
The mutagenicity of the acridine mustard (ICR 170) and the struc-
A general model for genetic recombination. Proc.
A theory of crossing-over by means of hybrid deoxyribonucleic
The estimation of conversion parameters
Mutagen speci-
Corresponding editor: F. SHERMAN