International Journal of Emerging Technology and Advanced Engineering
Website: www.ijetae.com (ISSN 2250-2459, UGC Approved List of Recommended Journal, Volume 8, Issue 5, May 2018)
1
Integrated Algorithms for Directional Overcurrent Relays
Coordination in Interconnected Systems
Prof. Dr. Ahmed R. Abul' Wafa
1, Bahaa Saad Mahmoud
2 1,2Electric Power and Machines Dept.Ain Shams University, Cairo, Egypt Abstract—Coordination of directional overcurrent relaysin power system networks with numerous interconnected networks in addition to the bidirectional power feed due to the implementation of various distributed generation resource becomes a very Complex task for protection engineers. The procedure of setting the directional relays for coordination manner requires load flow analysis, short circuit analysis, relay pairs list, and a protection coordination algorithm. This paper proposes integrated algorithms for directional overcurrent relays coordination in IEEE 8 bus interconnected system. The algorithms combined GA/GW/MF/SSA optimizers with the LINKNET algorithm for identifying the primary and backup relays and obtaining these relays settings. The most successful intelligent optimization algorithm has been validated in the directional overcurrent relay coordination in this paper.
Keywords— Directional overcurrent relays (DOCRs) coordination, Backup/Primary (B/P) list, LINKNET algorithm and intelligent technique for coordination method.
I. INTRODUCTION
Isolating the faulty section in contemporary power system networks is a great challenge for protection engineers. These networks become heavy interconnected and having complex loops. Moreover, the integration of distributed generations plays a vital role in increasing the system complexity. The difficulty is grown from identifying the backup primary (B/P) relays that decided the sequence of operations of these relays at various faults in the system. If these relays operate at non-suitable manner this will affect the system reliability [1], [2].
Directional overcurrent relays coordination process is necessary to allow the precise detection of faulty sections and trip it without affecting the rest of the system at minimum operation time. However, this process is affected by the common relays in interconnected system loops.
Computational methods for identifying relay pairs for correctly coordinate directional relays are listed below: The idea of breakpoint set (BPS) to reduce the complexity of relay coordination was first introduced by Knable in [3]. The breakpoint relays are initially set in relays coordination process.
Directional relays are placed at both ends of the feeder, so the clockwise directional relays loop are coordinated together and the anti-clockwise directional relays loop are coordinated too. A linear graph theory approach is presented by Dwarakanath and Nowitz for defining the sequence setting of the relays in Multi-loop networks [4].
Damborg et al. presented a methodology based on a relative sequence matrix (RSM) for identifying the sequence for setting the relays [5]. Identifying the relays which needed to be backup by a relay will be set is a crucial step in relay coordination procedure. Damborg et al presented the set of sequential pairs (SSP) which provided a setting sequence of primary and backup relays [5]. However, with the increase in the number of buses and loops in the system, the problem of finding the suitable BPS is practically complicated [6].
In [7], Jenkin et al. applied the concept of functional dependency to the topological analysis of the graph which does not require the computation of all the loops but settled for the suboptimal solutions.
Sastry in [8] has tried a heuristic approach where a bus with the highest degree of relays is chosen and all the relays on that bus are removed. The process is carried till no more loops are left out in the system which does not provide efficient solutions.
In [9], Yue et al. presented a new concept named as protection relay dependency dimension (PRDD) in this concept the minimum breakpoint set (MBPS) can be determined by a comparison of PRDD in a multi-loop network, and process of comparisons will not stop until the MBPS of the multi-loop networks is covered.
A powerful approach based on an expert system by Hossein et al is presented in [10]. The rules of the expert system include network configuration, protection systems, and fault levels.
International Journal of Emerging Technology and Advanced Engineering
Website: www.ijetae.com (ISSN 2250-2459, UGC Approved List of Recommended Journal, Volume 8, Issue 5, May 2018)
2
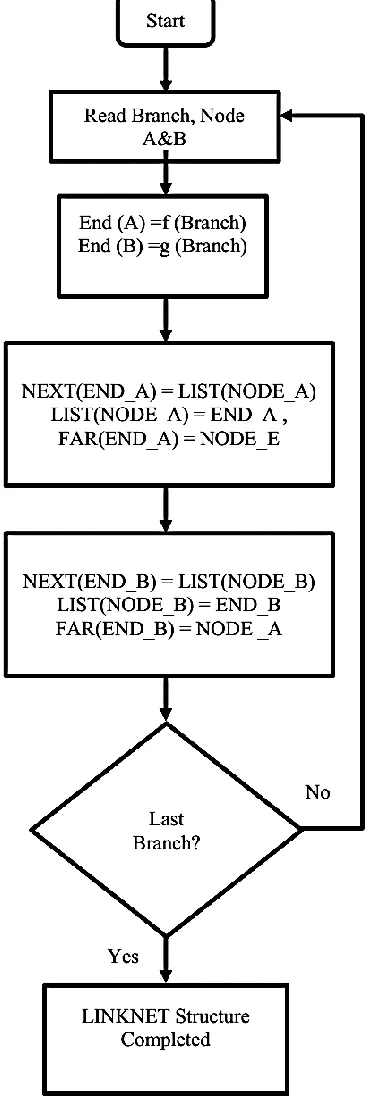
II. LINKNETALGORITHMThe LINKNET structure is an important tool which is generally designed for implementing the Electrical networks in machine language (MATLAB or other computer programing and simulation tools).
LINKNET has three main vectors LIST, IFAR, and NEXT which are required for relay pair identification study where: The LIST vector stores all the bus links and its dimension is equal to the number of system buses.
The NEXT vector stores the links between the directional relays incident at a given bus. However, IFAR is used to link any directional relay with its remote bus. The dimensions of both NEXT and IFAR vectors are equal to the branch ends of the test system [2], [11].
A. Algorithm Procedure for Representing Network Topology
Step (1) Branch ends are manually numbered as (2*n) and (2*n-l) where n is the branch number. That means the sequence of numbering the branch ends will be as follow; the ends of a branch (1) will be (1) and (2), and this applied to all branches.
Step (2) Relays are numbered automatically corresponding to branch ends. The vector NEXT will be constructed
The following scenarios may appear in the vector NEXT.
a)At fault location (i), the vector NEXT equal zero i.e. NEXT (i) =0.
b)At fault location (i) is not presented in the vector NEXT (k) where k varies from 1 to the total number of relays (j).
If scenarios (a) or (b) are existed, in this case, there is no backup relay exists in this direction, and the search will be performed in the other direction (try to find Next (K) that equal fault position (i).
c)The fault location (i) is presented as a value in the vector NEXT (k) where k varies from 1 to the total number of relays (j).
If scenario (c) is existed, in this case, a B/P relay pairs may be in either direction in this vector NEXT from this point and search has to be executed in both directions.
Generally, if the position of vector NEXT have a value at the fault location (i), the position will be stored and a search process will be executed to find an element in vector NEXT equals to the previously stored position, and it will stop if no more elements are found in the vector NEXT having the value equal to the stored position.
d)At fault location (i), the vector NEXT equal zero i.e. NEXT(i) =0, and remaining elements of vector NEXT i.e. NEXT(k) is not equal to this fault location number
If scenario (c) is existed, in this case, no backup relay exists for the close-in fault.
Step (3) All the stored odd numbers during previous steps are incremented by one, and the even numbers are decremented by one. These numbers representing the backup relays.
Step (4) Backup relays for every fault are stored corresponding to the fault.
This will give all backup relays for close-in faults corresponding to the considered fault location.
Step (5) Far-bus relay pairs for considered faults can be determined from the close-in faults groups by swapping consecutive odd and even rows.
International Journal of Emerging Technology and Advanced Engineering
Website: www.ijetae.com (ISSN 2250-2459, UGC Approved List of Recommended Journal, Volume 8, Issue 5, May 2018)
3
[image:3.612.247.549.133.701.2] [image:3.612.69.257.137.688.2]International Journal of Emerging Technology and Advanced Engineering
Website: www.ijetae.com (ISSN 2250-2459, UGC Approved List of Recommended Journal, Volume 8, Issue 5, May 2018)
4
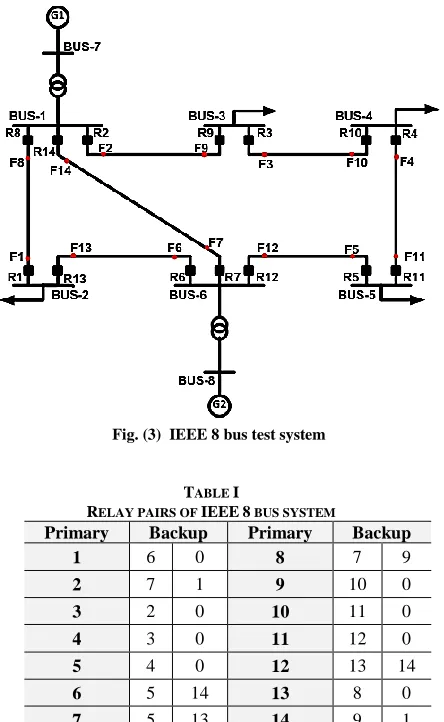
B. Relay pairs Results for IEEE 8 bus systemTable (I) shows the relay pairs of IEEE 8 bus test system shown in Fig.3 based on LINKNET structure technique.
In Fig.3, (R) and (F) are the symbols of directional overcurrent relay and fault location respectively.
Fig. (3) IEEE 8 bus test system
III. OPTIMAL RELAY COORDINATION
Optimal relays coordination is formulated as a non-linear optimization problem that required an optimization technique to determine the optimal relays settings for achieving a total minimum operating time.
A. Objective Function Formulation [12]
The objective of optimal relay coordination is to obtain the appropriate value of relay settings for all the relays that will minimize the total operating time of these primary relays and keep the various coordination constraints.
∑ (1)
Where: indicates the operating time of relay (i) for a fault in its primary protection zone, and (n) is the number of relays.
Relay Characteristic: Generally, a nonlinear characteristic of overcurrent relays is expressed as:
( (
)
) (2)
Where:
TABLE II OCR Characteristic [12]
Inverse Type Characteristic
Standard K L
Short Time AREVA 0.05 0.04 0
Long Time AREVA 120 1 0
Standard IEC 0.14 0.02 0
Very IEC 13.5 1 0
Extremely IEC 80 2 0
Moderately ANSI/ IEEE
0.0515 0.02 0.114
Very ANSI/
IEEE
19.61 2 0.491
Extremely ANSI/ IEEE
28.2 2 0.1217
B.Coordination Time Interval (CTI)
Initially, the Primary relay should trip as quickly as possible, whereas backup relay should operate after a time margin is known as coordination time interval CTI, and expressed as [13]:
(3)
CTI = + + + (4) TABLE I
RELAY PAIRS OF IEEE8 BUS SYSTEM
Primary Backup Primary Backup
1 6 0 8 7 9
2 7 1 9 10 0
3 2 0 10 11 0
4 3 0 11 12 0
5 4 0 12 13 14
6 5 14 13 8 0
7 5 13 14 9 1
Three phase fault current passing through relay.
Relay operational time.
TMS, PS, CT Time multiplier setting, Plug setting, current transformer ratio
[image:4.612.53.275.197.558.2] [image:4.612.326.562.227.556.2]International Journal of Emerging Technology and Advanced Engineering
Website: www.ijetae.com (ISSN 2250-2459, UGC Approved List of Recommended Journal, Volume 8, Issue 5, May 2018)
5
Where:Primary Relay Time Backup Relay Time
is operating time of relay 200ms
0.3
Se
c
is retardation time 50ms
is circuit breaker operating time
30ms
is safety margin 20ms
C.TMS and PS Constraints of Relays [12]
The relay time multiplier setting (TMS) is restricted by available settings range provided by relay manufacturer, which can be expressed as:
(5)
PS is decided by two parameters, the smallest amount of fault current and the utmost load current, to make sure that the relays will not malfunction under average load and a small amount of overload condition. Same way, the relay must be responsive to the smallest fault current.
(6)
Where:
is the overload factor, and are the nominal current and CT ratio of the relay respectively. is the minimum fault current that should be sensed by the relay, and is the pick-up relay current.
IV. OPTIMIZATION ALGORITHMS FOR SOLVING COORDINATION PROBLEM
Different intelligent optimization algorithms are combined with LINKNET algorithm to solve the protection coordination problem. These intelligent optimizers are the Genetic algorithm (GA), Moth-Flame Optimization Algorithm (MFO), Grey Wolf Optimizer (GWO) and Salp Swarm Algorithm (SSA). Generally, all optimization methods initially start with a random population and reach the optimal solution in search space after a number of iterations. The number of population (N) consists of solutions, each consists of a number of variables called dimension (D) [14].
In this paper, the 8 bus test system shown in Fig. 3 is linked to an External Grid (EG) of 400 MVA short circuit apparent power, and the (EG) is connected at bus no. 4.
The test system required data for simulation are presented in [12]. Relay pairs for IEEE 8 bus system are calculated in the table (I).
In this section, a four optimization algorithms are implemented for obtaining the directional overcurrent relays (DOCR) settings for this test system.
The optimization algorithms parameters are:
Maximum number of iteration=2000
Number of Search agents=100
Number of Relays =14
The time margin between the backup and primary relays for evading the mal-operation of relays is (0.3 seconds).
A.Genetic algorithm
Genetic algorithm (GA) is a meta-heuristic optimization technique suitable to solve any optimization problem regardless of the type of objective function. The two basic parameters of GA are the crossover probability factor and mutation probability factor. The crossover factor (CF) is expressed as the probability of pairs of chromosomes to produce (crossover), whereas mutation factor (MF) represents the probability of changing the status of a randomly selected binary bit of a chromosome from 0 to 1 and vice versa (mutation).
GA algorithm has been applied to obtain the optimal settings for directional relays in the IEEE 8 bus system to minimize the objective function shown in Eq. (1) under the predefined constraints in Eq. (5, 6).
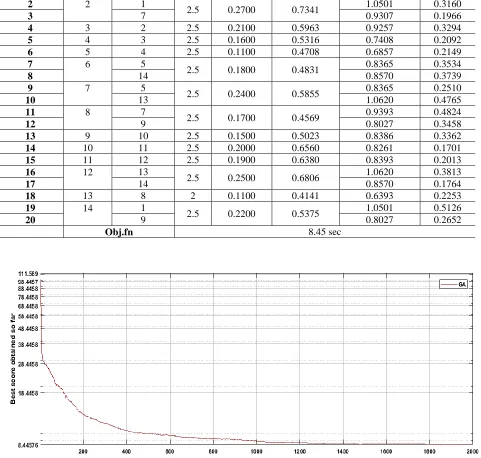
Table (III) shows the relays coordination results based on GA. Fig. 4 shows the Convergence curve for this optimization algorithm and Fig. 5 shows the standard inverse definite minimum time (IDMT) characteristics for the coordinated relays.
B.Moth-Flame Optimization Algorithm
The main inspiration of this optimizer is the navigation method of moths in nature called transverse orientation. Moths fly in the night at a fixed angle with respect to the moon, this mechanism is precise and effective for long distances traveling. However, these fancy insects are trapped in a useless/deadly spiral path around artificial lights. Mathematical formulation of this algorithm is detailed in [15].
[image:5.612.46.275.378.463.2]International Journal of Emerging Technology and Advanced Engineering
Website: www.ijetae.com (ISSN 2250-2459, UGC Approved List of Recommended Journal, Volume 8, Issue 5, May 2018)
6
Fig. (4) Convergence Curve of GA Algorithm
Fig. 6 shows the Convergence curve for this optimization algorithm and Fig. 7 shows the standard
inverse definite minimum time (IDMT) characteristics for the coordinated relays.
Table III Relay Coordination Based GA Serial
Number
Relay Pairs Relay Setting Relay Operating time
Main Backup PS TMS T_Main T_backup
1 1 6 2 0.1100 0.3962 0.6487 0.2525
2 2 1
2.5 0.2700 0.7341 1.0501 0.3160
3 7 0.9307 0.1966
4 3 2 2.5 0.2100 0.5963 0.9257 0.3294
5 4 3 2.5 0.1600 0.5316 0.7408 0.2092
6 5 4 2.5 0.1100 0.4708 0.6857 0.2149
7 6 5
2.5 0.1800 0.4831 0.8365 0.3534
8 14 0.8570 0.3739
9 7 5
2.5 0.2400 0.5855 0.8365 0.2510
10 13 1.0620 0.4765
11 8 7
2.5 0.1700 0.4569 0.9393 0.4824
12 9 0.8027 0.3458
13 9 10 2.5 0.1500 0.5023 0.8386 0.3362
14 10 11 2.5 0.2000 0.6560 0.8261 0.1701
15 11 12 2.5 0.1900 0.6380 0.8393 0.2013
16 12 13
2.5 0.2500 0.6806 1.0620 0.3813
17 14 0.8570 0.1764
18 13 8 2 0.1100 0.4141 0.6393 0.2253
19 14 1
2.5 0.2200 0.5375 1.0501 0.5126
20 9 0.8027 0.2652
[image:6.612.70.551.193.651.2] [image:6.612.79.551.462.662.2]International Journal of Emerging Technology and Advanced Engineering
Website: www.ijetae.com (ISSN 2250-2459, UGC Approved List of Recommended Journal, Volume 8, Issue 5, May 2018)
7
[image:7.612.67.569.140.334.2]Fig. (5) IDMT Characteristics of Coordinated DOC Relays
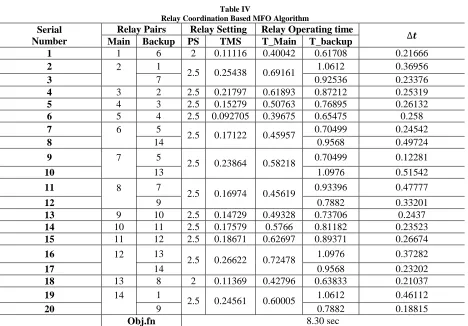
Table IV
Relay Coordination Based MFO Algorithm Serial
Number
Relay Pairs Relay Setting Relay Operating time
Main Backup PS TMS T_Main T_backup
1 1 6 2 0.11116 0.40042 0.61708 0.21666
2 2 1
2.5 0.25438 0.69161 1.0612 0.36956
3 7 0.92536 0.23376
4 3 2 2.5 0.21797 0.61893 0.87212 0.25319
5 4 3 2.5 0.15279 0.50763 0.76895 0.26132
6 5 4 2.5 0.092705 0.39675 0.65475 0.258
7 6 5
2.5 0.17122 0.45957 0.70499 0.24542
8 14 0.9568 0.49724
9 7 5
2.5 0.23864 0.58218 0.70499 0.12281
10 13 1.0976 0.51542
11 8 7
2.5 0.16974 0.45619 0.93396 0.47777
12 9 0.7882 0.33201
13 9 10 2.5 0.14729 0.49328 0.73706 0.2437
14 10 11 2.5 0.17579 0.5766 0.81182 0.23523
15 11 12 2.5 0.18671 0.62697 0.89371 0.26674
16 12 13
2.5 0.26622 0.72478 1.0976 0.37282
17 14 0.9568 0.23202
18 13 8 2 0.11369 0.42796 0.63833 0.21037
19 14 1
2.5 0.24561 0.60005 1.0612 0.46112
20 9 0.7882 0.18815
[image:7.612.75.543.359.685.2]International Journal of Emerging Technology and Advanced Engineering
Website: www.ijetae.com (ISSN 2250-2459, UGC Approved List of Recommended Journal, Volume 8, Issue 5, May 2018)
8
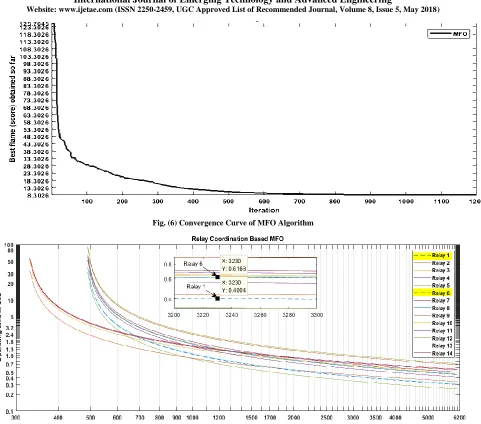
Fig. (6) Convergence Curve of MFO Algorithm
Fig. (7) IDMT Characteristics of Coordinated DOC Relays
A. Grey Wolf Optimizer
The GWO algorithm mimics the leadership hierarchy and hunting mechanism of grey wolves in nature. Alpha, beta, delta, and omega are the four types of grey wolves which employed for leadership hierarchy simulation. Furthermore, the three main steps of hunting, searching for prey, encircling prey, and attacking prey, are implemented. Mathematical formulation of this algorithm is detailed in [16].
[image:8.612.73.554.112.536.2]International Journal of Emerging Technology and Advanced Engineering
Website: www.ijetae.com (ISSN 2250-2459, UGC Approved List of Recommended Journal, Volume 8, Issue 5, May 2018)
9
[image:9.612.74.541.137.667.2]Fig. (8) Convergence Curve of GWO Algorithm Table V
Relay Coordination Based GWO Serial
Number
Relay Pairs Relay Setting Relay Operating time
Main Backup PS TMS T_Main T_backup
1 1 6 2 0.11326 0.408 0.63655 0.22856
2 2 1
2.5 0.25693 0.69853 1.0812 0.3827
3 7 0.93367 0.23513
4 3 2 2.5 0.21952 0.62334 0.88086 0.25752
5 4 3 2.5 0.15333 0.50942 0.77442 0.265
6 5 4 2.5 0.093236 0.39902 0.65706 0.25803
7 6 5
2.5 0.17663 0.47407 0.70903 0.23496
8 14 0.96385 0.48978
9 7 5
2.5 0.24078 0.5874 0.70903 0.12163
10 13 1.1121 0.52466
11 8 7
2.5 0.18334 0.49275 0.94234 0.44959
12 9 0.7964 0.30365
13 9 10 2.5 0.14883 0.49841 0.74452 0.24611
14 10 11 2.5 0.17757 0.58244 0.81771 0.23527
15 11 12 2.5 0.18806 0.63151 0.90078 0.26927
16 12 13
2.5 0.26832 0.73052 1.1121 0.38155
17 14 0.96385 0.23334
18 13 8 2 0.11519 0.4336 0.68948 0.25589
19 14 1
2.5 0.24742 0.60447 1.0812 0.47676
20 9 0.7964 0.19193
International Journal of Emerging Technology and Advanced Engineering
Website: www.ijetae.com (ISSN 2250-2459, UGC Approved List of Recommended Journal, Volume 8, Issue 5, May 2018)
10
A. Salp Swarm AlgorithmThe main inspiration of SSA is the swarming behavior of salps when navigating and foraging in oceans. This algorithm is tested on several mathematical optimization functions to observe and confirm their effective behaviors in finding the optimal solutions for optimization problems.
The results on the mathematical functions show that the SSA algorithm is able to improve the initial random solutions effectively and converge towards the optimum. Mathematical formulation of this algorithm is detailed in [17].
SSA algorithm has been applied to obtain the optimal settings for directional relays in the IEEE 8 bus system. Table (VI) shows the coordination results based SSA algorithm. Fig. 10 shows the Convergence curve for this optimization algorithm and Fig. 11 shows the standard inverse definite minimum time (IDMT) characteristics for the coordinated relays.
V. SIMULATION RESULTS AND DISCUSSION
The previous section proposed a brief information about (GA, MFO, GWO, and SSA) techniques. These techniques are applied for obtaining the optimal setting for 14 directional overcurrent relay in an IEEE 8 bus test system. Tables (III to VI) shows the coordination results between the backup and primary relays based (GA, MFO, GWO, and SSA) techniques.
The results have to avoid the mal-operation of these relays.
Fig. 7 shows the IDMT characteristics for all coordinated relays in the IEEE 8 bus system, the box inside this figure focus on the IDMT curves at the fault currents from 3200 amperes to 3300 amperes. The sequence of operation of primary relay number (1), and its backup relay number (6) at a three-phase fault current of 3230 amperes is shown in this small box, the operating time for relays (1) and (6) nearly will be 0.4 sec and 0.6 seconds respectively, and the coordination time interval (CTI) nearly 0.2 second. This (CTI) is around the predetermined value of 0.3 seconds.
Keeping the (CTI) between all primary and backup relays is necessary for avoiding the miss coordination between coordinated relays.
Fig. 12 shows the relation between the coordination time intervals (CTI) which presented in the last column in tables (III to VI) versus the serial number of primary and backup relay presented in the first column in tables (III to VI). The results show that MFO algorithm obtained the lowest average CTI value.
[image:10.612.69.546.456.727.2]Fig. 13 compares between the convergences curves for all proposed algorithms, and this figure shows that: GA converged faster than MFO, GWO, and SSA.
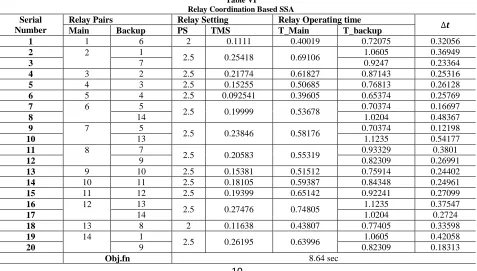
Table VI
Relay Coordination Based SSA
Serial Number
Relay Pairs Relay Setting Relay Operating time
Main Backup PS TMS T_Main T_backup
1 1 6 2 0.1111 0.40019 0.72075 0.32056
2 2 1
2.5 0.25418 0.69106 1.0605 0.36949
3 7 0.9247 0.23364
4 3 2 2.5 0.21774 0.61827 0.87143 0.25316
5 4 3 2.5 0.15255 0.50685 0.76813 0.26128
6 5 4 2.5 0.092541 0.39605 0.65374 0.25769
7 6 5
2.5 0.19999 0.53678 0.70374 0.16697
8 14 1.0204 0.48367
9 7 5
2.5 0.23846 0.58176 0.70374 0.12198
10 13 1.1235 0.54177
11 8 7
2.5 0.20583 0.55319 0.93329 0.3801
12 9 0.82309 0.26991
13 9 10 2.5 0.15381 0.51512 0.75914 0.24402
14 10 11 2.5 0.18105 0.59387 0.84348 0.24961
15 11 12 2.5 0.19399 0.65142 0.92241 0.27099
16 12 13
2.5 0.27476 0.74805 1.1235 0.37547
17 14 1.0204 0.2724
18 13 8 2 0.11638 0.43807 0.77405 0.33598
19 14 1
2.5 0.26195 0.63996 1.0605 0.42058
20 9 0.82309 0.18313
International Journal of Emerging Technology and Advanced Engineering
Website: www.ijetae.com (ISSN 2250-2459, UGC Approved List of Recommended Journal, Volume 8, Issue 5, May 2018)
11
Fig. (10) Convergence Curve of SSA Algorithm
Fig. (11) IDMT Characteristics of Coordinated DOC Relays
[image:11.612.62.540.104.309.2] [image:11.612.66.542.334.705.2]International Journal of Emerging Technology and Advanced Engineering
Website: www.ijetae.com (ISSN 2250-2459, UGC Approved List of Recommended Journal, Volume 8, Issue 5, May 2018)
12
Fig. (13) Convergence curves comparison
Table (VII) shows a comparison between proposed techniques. In this table, the MFO attained the minimum overall relays operating time (8.30 sec). However, it takes 1175 iterations in 81.55 seconds to attain its objective. SSA attained the largest overall relays operating time of (8.64 sec) compared to the proposed algorithms in this paper and it takes 82.90 seconds to attain its objective after 1200 iteration.
The results of GWO and GA are close to each other. However, GA algorithm takes 58.20 seconds to attain its objective function after 1784 iteration. GA is the fastest algorithm based on the results shown in the table (VII). Comparing the results in the table (VII) with the published algorithms (Sekker, BBO-LP, DE) in [18].
MOF algorithm still the best optimizer can be used to achieve the minimum overall directional overcurrent relays operating time.
VI. CONCLUSION
The proposed algorithms successes in obtaining the optimal operating time for all coordinated relays and kept a probable coordination time interval between them.
Not only the obtained results are optimized but also are reliable and maintained a proper time margin.
This paper introduced an influential integrated algorithm based on MFO algorithm and LINKNET algorithm. This algorithm achieved the minimum overall operating time for the coordinated relays compared with the other proposed integrated algorithms.
REFERENCES
[1] K. S. P. Vipul N. Rajput, 2016. ―On 8-Bus Test System for Solving Challenges in Relay Coordination.‖ in Power Systems (ICPS), IEEE 6th International Conference, New Delhi, India.
[2] B. P. A. A. M.Singh, 2013. ―Optimal coordination of directional over-current relays using Teaching Learning-Based Optimization (TLBO) algorithm.‖ Electrical Power and Energy Systems, vol. 50 , p. 33–41.
[3] A. Knable, 1969. ―A standardized approach to setting directional overcurrent relays on industrial network type systems.‖ IEEE Winter Power Meeting, p. 69 CP 58.
[4] H. D. a. L. Nowitz, 1980. ―An application of linear graph theory for coordination of directional overcurrent relays.‖ Electric Power Problems, pp.104-114.
Table VII
Comparison between proposed and published algorithms
Results Algorithm Overall relays operating time (sec)
Execution time (sec)
Iterations to reach best score
Proposed in this paper
MFO 8.300 81.55 1175
GWO 8.420 83.85 1200
GA 8.450 58.20 1784
SSA 8.640 82.90 1200
Published
Sekker [18] 8.425 --- ---
BBO-LP [18] 8.716 --- ---
[image:12.612.85.535.102.362.2]International Journal of Emerging Technology and Advanced Engineering
Website: www.ijetae.com (ISSN 2250-2459, UGC Approved List of Recommended Journal, Volume 8, Issue 5, May 2018)
13
[5] R. R. S. V. a. J. P. M.J. Damborg, 1984. ―Computer aidedtransmission protection system design – Part – I &II.‖ IEEE, vol. PAS – 103, pp.51-59, pp. 60-65.
[6] R. Ramaswami, 1986. ―Transmission Protective Relay Coordination- A Computer-Aided Engineering Approach for Subsystems and Full Systems.‖ Ph.D Dissertation, University of Washington Seattle. [7] H. P. K. L. Jenkins, 1992. ―An Application of Functional
Dependencies of the Topology Analysis of Protection Schemes.‖ IEEE Transaction on Power Delivery, vol.3, pp.77-83.
[8] S. MKS, 2005. ―Simplified algorithm to determine break point relays & relay coordination based on network topology.‖ IEEE International Symposium, vol.1, pp.772 - 775.
[9] Y. e. al, 2006. ―Minimum Break Point Set for Optimum Cooperation of Directional Protection Relays in Multiloop Networks.‖ IEEE Transactions on Power Delivery, vol. 21, pp.1114-1119.
[10] F. R. M. A.-. D. a. H. K. K. Hossein Askarian Abyaneh, 2007. ―A comprehensive method for break point finding based on expert system for protection coordination in power systems.‖ Electric Power System Research Elsevier, vol 77, pp. 660-672.
[11] R. P. M. a. H. O. G. D. Birla, 2004. ―Novel Technique for Relay Pair Identification:A Relay Coordination Requirement.‖ national power systems conference, pp. 284-289.
[12] K. S. P. V.N. Rajput, 2016. ―On 8-Bus Test System for Solving Challenges in Relay Coordination.‖ IEEE, Vols. no. 978-1-5090-0128-6/16/$31.00,
[13] ―Distribution Automation Handbook ABB, section 8.2 Relay Coordination.‖ (online). Available: www.abb.co.in/product. [14] B. D. V. M.N.Alam, 2015. ―A comparative study of metaheuristic
optimization approaches for directional overcurrent relays coordination.‖ Electric Power Systems Research , p. 39–52, 128 . [15] S.Mirjalili, 2015. ―Moth-flame optimization algorithm: A novel
nature-inspired heuristic paradigm.‖ Knowledge-Based Systems, Elsevier, p. 228–249, 89 .
[16] A. S.Mirjalili, 2014. ―Grey Wolf Optimizer.‖ Advances in Engineering Software,Elsevier, p. 46–61, 69.
[17] A. H. G. S. S. S.Mirjalili, 2017. ―Salp Swarm Algorithm: A bio-inspired optimizer for engineering design problems.‖ Advances in Engineering Software ,Elsevier, 1–29.