International Journal of Emerging Technology and Advanced Engineering
Website: www.ijetae.com (ISSN 2250-2459, ISO 9001:2008 Certified Journal, Volume 3, Issue 10, October 2013)
32
Andreassen and Artificial Neural Network Models
Development for Fatality Prediction with Accessibility Aspect
on Regency Area Cluster in West Java Province, Indonesia
Supratman Agus
1, Bambang Riyanto
2, Pinardi Koestalam
31Civil Engineering Departement, Indonesia University of Education, Indonesia. 2Civil Engineering Departement, Diponegoro University, Indonesia. 3Engineering Departement, Bhayangkara Surabaya University, Indonesia.
Abstract— In order to predict fatality victim in most
countries including Indonesia, two variables are used and these cover population and motor vehicles numbers. Those variables are not actually fit with Indonesian condition because of its population density, longest road infrastructures, highest number of motor vehicles, and vastest areas compared to those ASEAN countries. Republic of Indonesia Traffic Ordinance number 22 Year 2009 stated that fatality data must be supplied with hospitals’ data. However, the data reported by Republic of Indonesia Police has not been in accordance to the law indicating under-reporting. Therefore, the main purpose of the study was to design a multivariable fatality prediction model by developing Andreassen and Artificial Neural Network models in order to gain accurate fatality data fit with Indonesian condition, especially in the Province of West Java. Prediction model was designed by using population data year 2007-2010 from ten areas of regency in the province of West Java, Indonesia. Model validation test result with error model test Mean Absolute Percent Errors criteria (MAPE), Mean Absolute Errors (MAE), and Root Mean Square Errors (RMSE) revealed three main results: (1) Three variables Artificial Neural Network with two hidden layers (ANN3-2HL) prediction model was the best model used to predict actual fatality numbers in ten regencies in West Java Province, Indonesia. (2) Actual fatality number occurred in ten regencies in West Java Province, Indonesia, was 1607 people in year 2010. This number was 49.91 % higher than fatality data that was reported by Republic of Indonesia Police, that is, 1072 people. (3) Andreassen Prediction Model (1985) was not fit to be used in Indonesia because of its population density, longest road infrastructure and vastest areas. It was recommended that ANN3-2HL prediction model can be considered as the newest model used in road safety study in Indonesia.
Keywords-- Fatality prediction model, multivariable, model Andreassen, Artificial Neural Network (ANN), Indonesia
I. INTRODUCTION
Accurate number on fatality traffic accident victims has not been fully identified in Indonesia, especially in West Java Province and in fact fatality data reported by Republic of Indonesia (RI) police derived from that of accident scenes but has not yet provided with any data from victims died in hospital (hospital’s data). This fact indicates under-reporting data, implying that many traffic accident victims have not been in record and this is not in line with RI Traffic Ordinance number 22 Year 2009 stating that fatality data must also be supplied with hospital’s data. Road safety study requires accurate number on fatality data for different purposes and sides including researchers, police, road planner, educators, statisticians, communication experts, lawyers and related institutional organization. Inaccurate data reflects road safety unreliability.
International Journal of Emerging Technology and Advanced Engineering
Website: www.ijetae.com (ISSN 2250-2459, ISO 9001:2008 Certified Journal, Volume 3, Issue 10, October 2013)
33
These multi-variables include accessibility aspect and numbers of motor vehicles and population. The study is expected to find out the newest fatality prediction model in line with Indonesian condition as well as to be widely applied in areas that have the same characteristics as those in Indonesia.A.Traffic Accident Fatality Record in Indonesia
Police of Republic of Indonesia is entrusted by RI Traffic Ordinance number 2 Year 2009 section 233 stating that every traffic accident must be recorded in traffic accident form that constitutes a forensic data.
Traffic accident data is managed by RI Police and must be supplied with data from hospitals.
The intended data refers to data of traffic accident fatality, serious injury and slight injury victims.
International Road Traffic and Accident Database (IRTAD, 1998) defines fatality as traffic accident victims fell dead or died within 30 days since the accident occurred. Therefore, section 233 of RI Traffic Ordinance number 22 implies that RI police and hospitals staffs are accountable for recording highly accurate traffic accident data and assisting those interested parties.
TABLE I
TRAFFIC ACCIDENT VICTIMS DATA IN INDONESIA IN 2007-2010
Year Numbers of
Accident
Victims Number
Number of motor vehicles (million unit)
Number of Population (million)
Fatality Serious injury
Slight
injury Total
2006 87.020 15.726 33.282 52.310 101.318 50,4 222,2
2007 48.508 16.458 20.180 45.860 82.498 57,8 225,6
2008 59.164 20.188 23.440 55.722 99.350 65,3 228,5
2009 59.991 18.471 22.789 59.960 101.220 71,5 231,4
2010 63.787 18.371 24.225 60.310 102.906 78,95 234,2
Total 314.024 129.389 174.932 346.257 647.578 Percentage (%) 19,980 27,013 53,469 100
Source: RI Police, Statistics Department and RI Communications Ministry (2010)
The results of study and analysis of transportation experts in Indonesia and international institutions showed that Indonesia faces serious problem with recording numbers of traffic accident victims bearing the assumption of unrecorded and unreported victims. RI Communications Department (2004) stated that RI Police records victims’ number died in the scene, however, RI Health Ministry and hospitals do not report fatality number within 30 days after the accident to the RI Police. On the other hand, RI Jasa Raharja Insurance (AJR) company only records cases based on claims filed by victim’s family. Recording process grouped by each institution results in different data information filed for the same accident.
Relevant to this, the Law defines institutions that are directly responsible for Indonesia road safety namely: (1) Public Works Ministry; (2) RI Police; (3) Health Ministry; (4) Communications Ministry; (5) National Education Ministry; and (6) Jasa Raharja Insurance Company (AJR). In 2007, Indonesian Transportation Society reported that appointed institutions in the country to record traffic accident victims are not well cooperated. Each institution works in solitude and ignores partnership, results in poor road safety management system and high rate of traffic accident.
Traffic accident victims data reported by RI police is unreliable viewed from its low number of accident victims and therefore is not factual.
In countries where road safety is prioritized, information collection of traffic accident as data base is significant and highly reliable. In Indonesia, traffic accident victims in year 2007-2010 can be seen from the Table I.
II.CONTEXT AND REVIEW OF LITERATURE
A.Road Fatality Data in ASEAN countries
International Journal of Emerging Technology and Advanced Engineering
Website: www.ijetae.com (ISSN 2250-2459, ISO 9001:2008 Certified Journal, Volume 3, Issue 10, October 2013)
34
TABLE IIDATA FATALITY IN ASIA
Country Population Number of
Vehicle
Fatality Reported China 1.336.317.116 145.228.994 96.661
India 1.169.015.509 72.718.00 105.725
Indonesia 231.626.978 63.318.522 16.548
Japan 127.966.709 91.378.636 6.639
Cambodia 14.443.679 154.389 1.668
Malaysia 26.571.879 16.825.150 6.282
Singapore 4.436.281 851.336 214
Thailand Vietnam 63.883.662 87.375.196 25.618.447 22.926.238 12.492 12.800
Source : WHO (2009)
B.Role of Fatality Data in Road Fatality Study
In road safety study, traffic accident fatality data is primary data. Fatality data accuracy is needed to obtain relevant study results with factual data in the field. The study result is useful for the settlement of strategic policy, among others are law enforcement, road safety management system to reduce traffic accident risks, black spot maintenance, road safety action planning program and program evaluation setting before the implementation, ongoing and in the future.
According to the study conducted by RI Land Transportation Safety Directorate (2008), inaccurate data on traffic accidents victims both qualitatively and quantitatively cannot be regarded as sound source when analysing and planning general policy for road safety maintenance system in the country. If the road safety is conducted using data input resulted in low accuracy, the output of the study will not show factual condition and it will not attain target to maintain an expected condition, that is, road safety maintenance system preventing the increase on road fatality victims.
C.Andreassen Prediction Model
Andreassen model (1985) is a model derived from Smeed (1949, 1955) model that reflects some weak points including non universal and particular use only (Broughton, 1988; Oppe, 1991; and Ameen & Naji, 2001). These Smeed shortcomings are seen from equation parameter of α and β that keeps changing on different location and time. From Smeed equation, Andreassen model adjusts intercept and gradient parameters. Anderassen model requires Constanta C, coefficient M1 and M2 by searching the value of α, βand γ usingdouble linier regression analysis. Thus, general form of Andreassen equation is as follows.
1 2
M M
F C V P (1)
FeVP (2)
In which:
F = fatality prediction number C = Constanta
V = Number of Motor vehicles P = Number of population
M1 = coefficient degree of number of motor vehicles M2 = coefficient degree of number of population
D. Artificial Neural Network Model
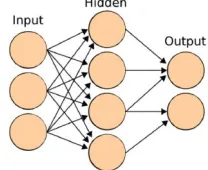
ANN model has been oftentimes implemented in many field of science to predict (William dan L.Yan, 2008). It is a model instrument of non-linier statistical data that can be used to model a complex relationship between input and output to seek patterns. There are three types of ANN model namely Multi Layer Perceptron (MLP), Radial Basis Function (RBF), and Kohoren Network (KN). In terms of prediction problems, MLP model is the most used model to map out a set of input data to become a set of output data by applying non-liner activation function. In MLP, both independent and dependent variables have three levels of metric and non-metric measures. MLP can also be called as forward network or back-propagation because the information moves in one direction that is from input layer towards hidden layer and then towards output layer (see Figure 1).
Figure 1 Multi Layer Perception (MLP) ANN prediction Model
Activation function in hidden layer is:
Hyperbolic tangent : ( ) tanh( )
c c
c c
e e
Y c c
e e
(3)
Sigmoid :
( )
1
1
cY c
e
(4)Activation function in output layer is:
Identity :
Y c
( )
c
(5) Softmax :
(
)
kj c k c j
e
Y c
e
[image:3.612.391.495.454.539.2]International Journal of Emerging Technology and Advanced Engineering
Website: www.ijetae.com (ISSN 2250-2459, ISO 9001:2008 Certified Journal, Volume 3, Issue 10, October 2013)
35
Hyperbolic tangent : ( ) tanh( )
c c
c c
e e
Y c c
e e
(7)
Sigmoid : ( ) 1
1 c
Y c
e
(8)
E. Model Validation Test
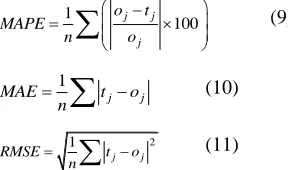
Model validation test is conducted in order to find the best model and several developed prediction models. This study uses three types of error model test criteria, namely Mean Absolute Percent Errors (MAPE), Mean Absolute Errors (MAE), and Root Mean Square Errors (RMSE) with the following formulas:
1
100
j j
j
o t MAPE
n o
(9)1
j j
MAE t o
n
(10)2 1
j j
RMSE t o
n
(11)The best prediction model is the one having the smallest difference from actual fatality data. This is taken by fatality number data by RI police is added with survey results on victims data of traffic accident died in the hospital.
III. METHODOLOGY
A. Study Area Location
The location of the study was on the cluster of regency administrative areas in West Java Province, Indonesia, consisting of ten regencies, namely: (1) Bandung and West
Bandung Regencies; (2) Indramayu Regency; (3) Cianjur Regency; (4) Ciamis Regency; (5) Majalengka Regency; (6) Subang and Purwakarta Regency; (7) Sumedang
[image:4.612.86.230.292.377.2]Regency; (8) Garut Regency; (9) Kuningan Regency; and (10) Karawang Regency. The width of study area location is 59. 43% of 38.783,13 km2 of West Java Province and 42.88% of the total of population number which is 43.806.653 in year 2010. Figure 2 shows the study area location in Java Island, Indonesia.
Figure 2 Study Area Location in Java Island, Indonesia TABLE III
RESEARCH VARIABLE AND INPUT DATA
Research Variable Total input data of all study areas (per-year) Input variable
2007 2008 2009 2010 Andreassen ANN
Population (Million) 19,964 20,319 20,623 20,859 √ √
Vehicle (million/unit) 2,246 2,387 2,732 3,217 √ √
Accessibility (road length
ratio to that of area width) 0,558 0,559 0,560 0,565 × √
Factual fatality *) 1781 916 855 1072 √ √
*) RI Police Data + Survey results from Hospitals
B. Research Variables and Input Data
The analysis of variables relation on fatality numbers concluded that independent input variables on each model were used in this study (see Table III). In Andreassen model, two variables were used including population and motor vehicles numbers. Whereas, in ANN model, four variables were used covering population and motor vehicles numbers as well as accessibility (road length ratio to that of area width).
C. Population and Sample of Study Area
[image:4.612.327.558.314.462.2]International Journal of Emerging Technology and Advanced Engineering
Website: www.ijetae.com (ISSN 2250-2459, ISO 9001:2008 Certified Journal, Volume 3, Issue 10, October 2013)
36
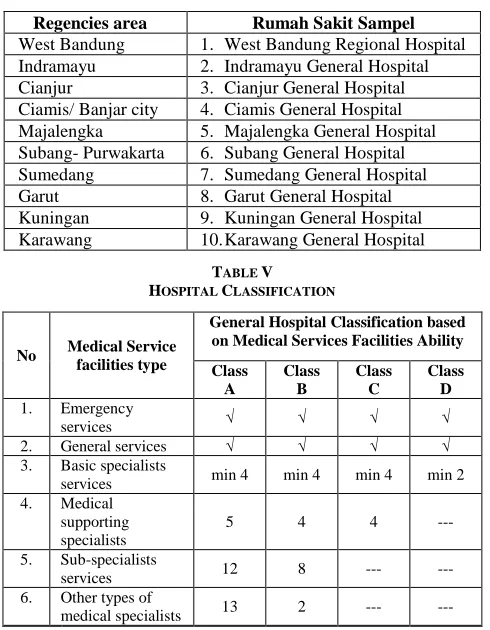
Table IV demonstrates samples of class A and B hospitals classification on each study area, while Table V illustrates criteria specifications of the hospitals.D. Survey Technique of Fatality Data in the Hospitals
Traffic accident victims’ data died in the hospital was done by using document analysis of medical record each patient has. This was referred to RI laws Number 14 Year 1993 regarding Road Traffic and International Road Traffic and Accident Database (IRTAD 1998) stating that the length of nursing care is 30 days maximally after the accident occurred. Figure 3 illustrates stages of patient medical record document analysis in the hospital.
TABLE IV
CITIES AND HOSPITALS POPULATIONS/SAMPLE
Regencies area Rumah Sakit Sampel
West Bandung 1. West Bandung Regional Hospital Indramayu 2. Indramayu General Hospital Cianjur 3. Cianjur General Hospital Ciamis/ Banjar city 4. Ciamis General Hospital Majalengka 5. Majalengka General Hospital Subang- Purwakarta 6. Subang General Hospital Sumedang 7. Sumedang General Hospital
Garut 8. Garut General Hospital
Kuningan 9. Kuningan General Hospital Karawang 10.Karawang General Hospital
TABLE V HOSPITAL CLASSIFICATION
Source: RI Laws Number 44 Year 2009 Regarding hospital
Figure 3 Stages of Fatality Data Survey in the Hospital
E. Prediction Model Development Strategy
Model development was conducted by using two approaches including the application of Andreassen (1985) and Artificial Neural Network (ANN) from Haykin (1994) fatality prediction models in which each model is used by adjustment to areas characteristics and road transportation infrastructure condition in West Java Province, Indonesia. In developing Andreassen model prediction, two stages were conducted by firstly using equation form of Andreassen (1985) model using two variables, that is, population and motor vehicles numbers and secondly by using multi-variables Andreassen model, by basing it on Andreassen general equation model multiplied by accessibility factor as a correlation model to fatality numbers so that fatality prediction was equal to
( .
[image:5.612.327.567.141.272.2]On the other hand, ANN model was developed by using one and two hidden layer shown in Figure 4 below.
Figure 4 ANN Model with One and Two Layers No Medical Service
facilities type
General Hospital Classification based on Medical Services Facilities Ability Class
A
Class B
Class C
Class D 1. Emergency
services √ √ √ √
2. General services √ √ √ √
3. Basic specialists
services min 4 min 4 min 4 min 2 4. Medical
supporting specialists
5 4 4 ---
5. Sub-specialists
services 12 8 --- ---
6. Other types of
[image:5.612.47.292.307.622.2] [image:5.612.327.563.522.642.2]International Journal of Emerging Technology and Advanced Engineering
Website: www.ijetae.com (ISSN 2250-2459, ISO 9001:2008 Certified Journal, Volume 3, Issue 10, October 2013)
37
In order to get the best prediction model, calibration/ validation test was conducted. Each prediction model was mathematically tested by using the criteria of Mean Absolute Percent Errors (MAPE), Mean Absolute Errors(MAE), and Root Mean Square Errors (RMSE). The best prediction model is the one that has the smallest error difference.
Fatality Prediction Model Development Procedure
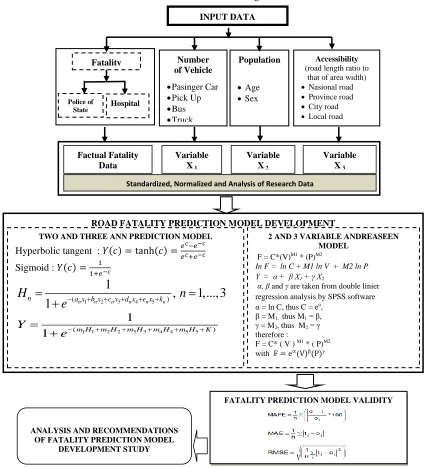
Fatality Prediction Model Development Procedure was designed based on different types of input data from all variables. Afterwards, model development was conducted by using general Equation from Andreassen (1985) and Artificial Neural Network (ANN) model developments from Multy Layer Perception (MLP) form. Fatality prediction model development procedure is shown in Figure 5.
[image:6.612.78.507.240.708.2]Figure 5 Fatality Prediction Model Development Process
FATALITY PREDICTION MODEL VALIDITY
ANALYSIS AND RECOMMENDATIONS OF FATALITY PREDICTION MODEL
DEVELOPMENT STUDY
ROAD FATALITY PREDICTION MODEL DEVELOPMENT
TWO AND THREE ANN PREDICTION MODEL
Hyperbolic tangent : ( (
Sigmoid : (
1 2 3 4 5 )
(
1
,
1,...,3
1
n n n n n nn a x b x c x d x e x k
H
n
e
1 1 2 2 3 3 4 4 5 5
( )
1
1
m H m H m H m H m H KY
e
2 AND 3 VARIABLE ANDREASEEN MODEL
F = C*(V)M1 * (P)M2
In F = ln C + M1 ln V + M2 ln P Y = α + β X1 + γ X2
α, βand γ are taken from double linier regression analysis by SPSS software
α = ln C, thus C = eα
, β = M1, thus M1 = β,
γ = M2, thus M2 = γ
therefore :
F = C* ( V ) M1 * ( P)M2
with ( β( γ Standardized, Normalized and Analysis of Research Data
Variable X 2
Variable X 3
Factual Fatality Data
Variable X 1
INPUT DATA
Number of Vehicle
Pasinger Car
Pick Up
Bus
Truck
Population
Age
Sex
Accessibility (road length ratio to
that of area width)
Nasional road
Province road
City road
Local road
Police of
State Hospital
International Journal of Emerging Technology and Advanced Engineering
Website: www.ijetae.com (ISSN 2250-2459, ISO 9001:2008 Certified Journal, Volume 3, Issue 10, October 2013)
38
IV. RESEARCH RESULTS AND DISCUSSIONA. Fatality Prediction Model Development Result
Table VI and Table VII illustrates the summary of research on Andreassen 1985 and ANN MLP type model developments with one and two hidden layer and multi-variable year 2007-2010 in line with areas characteristics and road transportation infrastructure condition in West Java Province, Indonesia. Andreassen model application (FA) was done based on Andreassen general equation form with two variables input data namely population and motor vehicles numbers. Meanwhile, Multivariable Andreassen model prediction was conducted by input data referring to inter-variables relation analysis. Those inter-variables relation were relation between driver behavior and fatality number by using two step cluster, between accessibility variable relation (road length ratio to area width) and fatality number, between mobility relation (road length ratio to 1000 population number) and fatality number, relation between population and motor vehicles number and fatality number. Relation inter-variable analysis was also conducted to ANN model development.
From error model test validation result using three types of criteria namely Mean Absolute Percent Errors (MAPE), Mean Absolute Errors (MAE), and Root Mean Square Errors (RMSE), it was found that three variables Artificial Neural Network (ANN) prediction model with two hidden layers (ANN3-2HL) was the best model occupying the smallest error value compared to other model predictions that was MAPE = 13.17; MAE=16.94 and RMSE = 34.39. From the best ANN 3-2HL prediction model, it was found out that fatality number prediction occurred in all administrative areas in West Java Province is 1607 in year 2010.
Table VII illustrates fatality data under-reporting comparison from each prediction model development on data fatality from Police of RI. In Table VII it was found that 60.26 % of factual fatality data and 46.91 % of ANN3-2HL model fatality prediction number was not recorded in RI police report.
Figure 6 illustrates Artificial Neural Network 3 variable model equation formula and form with two hidden layers (ANN3-2HL) taken from fatality prediction model development result in the study.
TABLE VI
PREDICTION MODEL VALIDATION TEST RESULT IN REGENCY AREAS IN WEST JAVA PROVINCE
No Regencies Name Factual Fatality
(Police+ Hospital)
Prediction Model Development and Actual Fatality Prediction Number (FA)
Andreassen 1985
(FAM) Andreassen
3 variabel
ANN3- 1HL
ANN3- 2HL
1 Bandung and West Bandung Regencies 332 281 298 245 275
2 Indramayu Regency 276 141 196 197 164
3 Cianjur Regency 180 143 233 181 172
4 Ciamis Regency 151 140 157 178 155
5 Majalengka Regency 52 108 114 137 121
6 Subang and Purwakarta Regencies 192 170 204 203 179
7 Sumedang Regency 129 101 104 116 119
8 Garut Regency 168 148 143 170 160
9 Kuningan Regency 119 97 120 99 127
10 Karawang Regency 119 170 157 170 135
Total 1718 1499 1726 1696 1607
MAPE 17,01 14,73 17,41 13,17
MAE 24,06 18,67 20,89 16,94
International Journal of Emerging Technology and Advanced Engineering
Website: www.ijetae.com (ISSN 2250-2459, ISO 9001:2008 Certified Journal, Volume 3, Issue 10, October 2013)
39
TABLE VIICOMPARISON BETWEEN PREDICTION MODEL FATALITY DATA NUMBER OF REGENCIES IN WEST JAVA PROVINCE AND RIPOLICE REPORT
Fatality Data in 2010 Fatality Number that was not recorded in RI Police
Police Hospital Factual Fatality
(Police+Hospital
(PA) Andreassen
1985
(PAM) Andreassen
3 variabel
ANN3- 1HL
ANN3- 2HL
1072 646 1718 427 654 624 535
Percentage (%) 60,26% 39,83% 61,01% 58,21% 49,91%
Form and Formula of ANN3-2HL Fatality Prediction Model for Regencies Cluster in West Java Province Indonesia
Input Variable:
1.
1. Population Number (P)2.
2. Motor Vehicles Numbers (V)3.
3. Accessibility Aspect (A)Neural Network Artificial Model with 3 variables and 2 Hidden Layers
International Journal of Emerging Technology and Advanced Engineering
Website: www.ijetae.com (ISSN 2250-2459, ISO 9001:2008 Certified Journal, Volume 3, Issue 10, October 2013)
[image:9.612.85.504.98.566.2]40
Figure 6 ANN3-2HL Fatality Prediction Model
V. DISCUSSION
From the Table VI and Table VII, it was found out that ANN3-2HL model calibration test result has the smallest MAPE, MAE and RMSE error valued and is the lowest compared to two variables Andreassen Prediction Models (PA) and multivariable Andreassen prediction Model Development (PAM). MAPE value is = 27,39; while MAE is = 47,17 and RMSE is = 64,09, explaining that ANN3-2HL prediction model has the lowest error value compared to other model validation test result.
ANN3-2HL model validation test result showed that actual fatality prediction number in 2010 in ten regency areas in West Java Province is 1607. This number is higher as many as 535 or 49.91 % of fatality data indicated not reported by RI police (under-reporting). This number is higher condition and is in accordance with Asian Development Bank, stating that in Indonesia there are still many under-reporting cases viewed from the report of RI police.
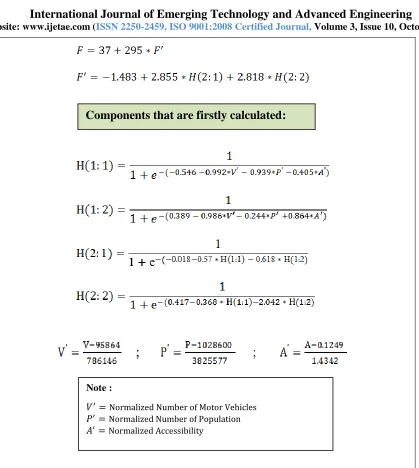
Components that are firstly calculated:
International Journal of Emerging Technology and Advanced Engineering
Website: www.ijetae.com (ISSN 2250-2459, ISO 9001:2008 Certified Journal, Volume 3, Issue 10, October 2013)
41
ANN3-2HL fatality prediction model was developed by using three variables namely motor vehicles nimber, population number and accesibility. In order to see the third variable influence, independent variabel importance table and normalized importance figure were used to illustrate it. Normalized importance figure showed that motor vehicles number variable contributes the biggest influence that is 0.523 or 52.3%. The second biggest variable was attributed to accessibility, that is, 0.28 or 28% and the third variable is population number as many as 0.197 or 19.7%. Therefore, in ANN3-2HL prediction model, the most influential variables sequence is motor vehicles number, accessibility and population number.Model validation test result phenomena above implies that variables used in this study comprisingmotor vehicles number and accessibility (road length ratio to area width) is precise.
VI. CONCLUSION
Based on fatality prediction model development and discussion above, it can be concluded that:
1. Three variable Artificial Neural Network model prediction with two hidden layers is the best prediction model to predict died victims resulted from traffic accident in the cluster of regency administrative areas in West Java Province Indonesia.
2. General equation formula of ANN3-2HL model for fatality prediction resulted from traffic accident in the cluster of regency administrative areas in West Java Province, Indonesia is illustrated below.
37 295 '
' 1.483 2.855 (2 :1) 2.818 (2 : 2)
F F
F H H
With:
0.546 0.992 ' 0.939 ' 0.405 '
1 (1:1)
1 V P A
H
e
0.389 0.986 ' 0.244 ' 0.864 '
1 (1: 2)
1 V P A
H
e
0.018 0.57 (1:1) 0.618 (1:2)
1 (2 :1)
1 H H
H
e
0.417 0.368 (1:1) 2.042 (1:2)
1 (2 : 2)
1 H H
H
e
95864 1028600 0.1249
' ; ' ; '
786146 3825577 1.4342
V P A
V P A
3. Fatality number in 2010 resulted from traffic accident in the cluster of regency administrative areas in West Java Province, Indonesia is 1606. Fatality prediction number is 49.91 % higher that that fatality data reported by RI police that is 1072.
4. Andreassen (1985) prediction model with two variables is not fit with Indonesian condition because of its population density, highest number of motor vehicles, longest road infrastructure and vastest area in ASEAN countries.
REFERENCES
[1] Agus, Supratman., Riyanto, Bambang., Koestalam, Pinardi. 2013. Multi Variable Road Fatality Prediction Study In City Area by Using Andreassen and Artificial Neural Networks Model Developments in West Java, Indonesia. Academic Research International Vol.4 No.5 September 2013.
[2] Andreassen D. 1985. Linking deaths with vehicles and population. Traffic Engineering and Control 26(11): 547-549.
[3] Asian Development Bank (ADB). 2005. Asean Regional Road Safety Strategy and Action Plan 2005-2010. Publication No, 071105, Manila.
[4] Badan Pusat Statistik Provinsi Jawa Barat. 2008. 2009. 2010. 2011. Jawa Barat Dalam Angka
[5] Berita Negara RI Nomor 587. 2010. Peraturan Menteri Pekerjaan Umum Nomor 14/Tentang Standar Pelayanan Minimal Bidang Pekerjaan Umum dan Penataan Ruang.
[6] Departemen Perhubungan RI. 2004. Masterplan Transportasi Darat, laporan antara. PT Arsiona Bangun Prima, Jakarta
[7] Dinas Kementerian Pekerjaan Umum, Direktorat Bina Marga Provinsi Jawa Barat. 2010. Peta Jaringan Jalan Nasional dan Provinsi di Jawa Barat.
[8] Direktorat Keselamatan Transportasi Darat. 2008. Profil Kinerja Keselamatan Transportasi Darat. Direktorat Jenderal Perhubungan Darat, Departemen Perhubungan, Jakarta
[9] Haykin, S. 1999. Neural Networks: A Comprehensive Foundation. 2nd Edition. New Jersey: Prentice Hall Incorporation.
[10] Hobbs FD. 1995. Prencanaan dan Teknik Lalu lintas. Edisi kedua. Gajah Mada University Press
[11] IRTAD.1998. Definitions and Data Availabbility. Special Report. OECD-RTR, BASt, Gladbach, Germany.
[12] Kemeterian Perhubungan RI. 2008. 2009. 2010. 2011. Perhubungan Darat dalam Angka.
[13] Keputusan Menteri Kesehatan RI Nomor 828/Menkes/SK/IX /2008, tentang Petunjuk Teknis Standar Pelayanan minimal Bidang Kesehatan di Kabupaten/Kota
[14] Kepolisian Negara RI. 2010. Standar Operasional dan Prosedur (SOP) Penanganan Kecelakaan Lalu lintas Jalan. Badan Pembinaan Keamanan POLRI, Direktorat Lalu lintas.
[15] Kurner Nachtsheim Neter. 2004. Applied Linear Regression Models. Fourth edition. Mc Graw-Hill. New York, USA
International Journal of Emerging Technology and Advanced Engineering
Website: www.ijetae.com (ISSN 2250-2459, ISO 9001:2008 Certified Journal, Volume 3, Issue 10, October 2013)
42
[17] Lembanran Negara RI Nomor 153 tahun 2009. Undang-undangNomor 44 tahun 2009 tentang Rumah Sakit. Sekretariat Negara RI . Biro Peraturan Perundang-undangan Bidang Politik dan Kesejahteraan Rakyat.
[18] Masyarakat Transportasi Indonesia (MTI), 2007. 1-2 -3 langkah, Referensi ringkas bagi proses Advokasi Pembangunan Transportasi. Volume 2, Jakarta.
[19] Williams and L,Yan. 2008. “A Case Study Using Neural Network Algorithms: Horse Racing Prediction in Jamaica“. In International Conf. on Artificial intelellgence (ICAI”08), Las Vegas.