5Department of Physics and the Quantum Theory Project, University of Florida, Gainesville, Florida 32611, USA 6Collaborative Innovation Center of Quantum Matter, Beijing 100871, China
(Received 17 January 2018; revised manuscript received 28 February 2018; published 20 March 2018)
Shot noise reveals spin dependent transport properties in a magnetic tunnel junction. We report measurement of shot noise in CoFeB/MgO/CoFeB/MgO/CoFeB double barrier magnetic tunnel junctions, which shows a strong temperature dependence. The Fano factor used to characterize shot noise increases with decreasing temperature. A sequential tunneling model can be used to account for these results, in which a larger Fano factor results from larger spin relaxation length at lower temperatures.
DOI:10.1103/PhysRevB.97.104412
I. INTRODUCTION
Magnetic tunnel junctions (MTJs) [1,2] have broad applica-tion prospects due to their giant tunneling magnetoresistance (TMR) [3–9]. MTJs based on symmetry-preserved tunneling have been used for read heads of hard disk drives and data storage such as STT-MRAM [10]. Double barrier magnetic tunnel junctions (DBMTJs) have potential advantages over single barrier magnetic tunnel junctions (SBMTJs) due to their better signal to noise ratio [11–15]. DBMTJ can generate a larger output voltage at the relevant operating voltage, which can improve the signal to noise ratio [16,17].
Shot noise is a powerful tool for studying spin dependent tunneling processes in MTJs [18–23] It reveals the discrete na-ture of electrons and can be characterized by Fano factor (F). In the zero temperature limit, the Fano factor is definedF = SI
2eI,
whereSI is the experimental current noise power. If electrons
tunnel through the barrier independently (Poissonian process),
F =1, which means full shot noise [24]. Full shot noise has been measured in SBMTJs with large TMR [18,22,25]. It is usually suppressed (F <1) in DBMTJs due to two step tunneling [19]. Magnetic control of shot noise was reported recently in weakly asymmetric epitaxial Fe/MgO/Fe/MgO/Fe DBMTJs [20,26]. However, in previous reports shot noise in DBMTJs was measured below 10 K to avoid the influence of 1/f noise [20,22]. Measurement of shot noise at higher temperatures and further study of the variation of shot noise at different temperatures are helpful for potential applications at room temperature as well as for understanding spin relaxations in DBMTJs.
In this work, we develop a high-frequency noise mea-surement setup and successfully measure shot noise in a large temperature range from 296 K to 20 K. We find that shot noise can be tuned not only by magnetic states but
also by temperature in sputtered DBMTJs. The Fano factor increases significantly as temperature decreases from 296 K to 20 K. A sequential tunneling model with consideration of spin relaxation [20] is used to explain our results.
II. METHOD: HIGH FREQUENCY MEASUREMENT SETUP
It is difficult to measure shot noise at high temperature due to large 1/f noise in DBMTJs and low frequency bandwidth normally used. Although we can try to measure shot noise with a large bias current, 1/f noise increases much more quickly than shot noise with increasing bias especially at high temperatures [27,28]. So it is necessary to measure shot noise at high frequency in order to minimize the influence of 1/fnoise. To reach high frequency, we use a high frequency amplifier (MITEQ AU-1447) and high frequency SMA connector. The AU-1447 has an input impedance of 50and is used to mea-sure current noise from device. Figure1shows the schematic diagram of our noise measurement setup. At the left side, we use a digital voltage source Agilent B2901A decoupled by a homemade battery-powered optical decoupler circuit and a RC filter as a low noise current source. At the right side, the noise from the device is amplified with the AU-1447 and then digitized by a data acquisition card.
Current noise of the sample is measured in the range of 2.1–2.5 MHz, within which 1/fnoise is ten times smaller than shot noise even at room temperature. A typical noise spectrum is shown in AppendixA.
III. RESULTS AND DISCUSSION
A. Device and shot noise fitting
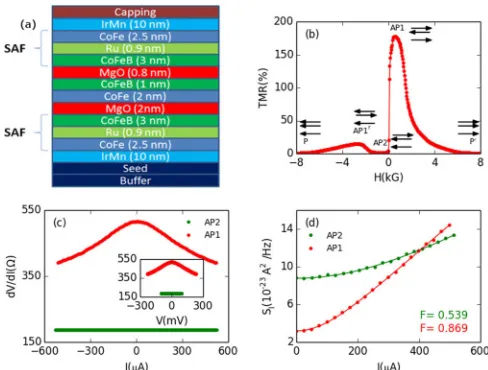
FIG. 1. Schematic of measurement setup and device structure. The left side shows the dc bias circuit and the right side shows the noise signal acquisition circuit.
TMR curve at room temperature. There are two different high-resistance states: AP1 (↓↑ ↓) and AP1r (↑↓ ↑) and three low-resistance states: AP2 (↓↑ ↑), P (↑↑ ↑), and P (↓↓ ↓) [28].
At finite temperature, white noise power (Swhite) is given by [24]
SI =
4kT Rd
+2F
eI coth eV
2kT −
2kT Rd
, (1)
whereIis the average current,Vis the junction voltage,eis the electron charge,kis the Boltzmann constant,T is temperature,
Rd is the differential resistance of the junction, andF is the
Fano factor which is generally independent of temperature. Figure2(c)and inset show differential resistance of the AP1 and AP2 states at room temperature, which are used for fitting the shot noise in Fig.2(d)by using Eq. (1). Figure2(d)shows the current dependence of current noise powerSIfor AP1 and
FIG. 2. (a) Schematic diagram of the stack of asymmetric DBMTJ. (b) TMR for our sample at room temperature. (c) Differential resistance of AP1 (red) and AP2 (green) states at room temperature, which is needed to calculate the current noise power fitting line. The inset shows the voltage dependence of resistance. (d) Bias dependence of current noise powerSIat room temperature of AP1 and AP2 states.
The red and green dots are experimental data and solid lines are noise fitting lines from which we estimate theF by using Eq. (1). The intercept is thermal noise. TheFis smaller than 1 for both states.
FIG. 3. Field dependence ofFat 296 K (a) and 78 K (b). Red solid lines are MR curves and black dots areF. For both temperatures,
F shows magnetic state dependence. The Fano factor for the AP1 state is much larger than for the others. Panels (c) and (d) show the magnetization orientation of AP1 and P state. At AP1 state,R2 is much larger thanR1, which leads to a largerF than in the P state, whereR2is comparable toR1.
AP2 states at room temperature. The dots are experimental data and solid lines are fits to Eq. (1). We take into account the thermal noise and use Eq. (1) to obtainF. It’s obvious thatF
is less than 1.
B. Magnetic state dependence
It is observed that in sputtered, strongly asymmetric DBMTJs the Fano factor can be tuned by magnetic states, as shown in Figs.3(a)and3(b), whereF of the different states and the MR curves are summarized at two typical temperatures (296 K and 78 K). Black dots and red solid curves in Fig.3 showFand MR curves. In AP1,Fis much larger than in other states at each temperature. The Fano factors of AP2, P, and P are similar and slightly smaller than AP1r.
In previous work, shot noise in epitaxial DBMTJs was shown to depend strongly on the magnetic configuration, and the symmetry of the two barriers, and a sequential tunneling model was used to explain the magnetic state dependence [19,20,26]. Following their work, we haveF =1− 2R1R2
(R1+R2)2, where R1(R2) is the resistance of the first(second) barrier. Figures3(c)and3(d)show the magnetization orientations in the AP1 and P states. For AP1,R2is much larger thanR1due to the sample’s asymmetry, andF will approach 1, which is similar to the case of a single barrier. While in the P state,R1 is comparable toR2, which leads to a lowerF than than in the AP1 state.
C. Temperature dependence
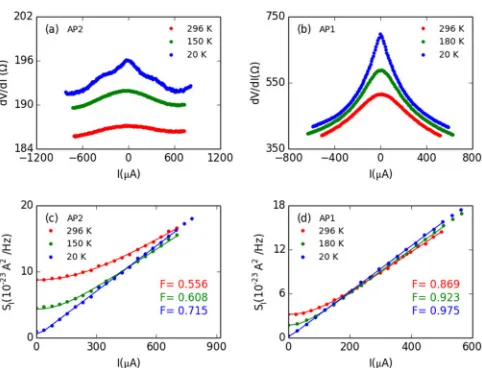
[image:2.608.52.296.68.178.2] [image:2.608.49.293.459.644.2]FIG. 4. Differential resistance and noise power are measured at different temperatures for two states. Differential resistance at different temperatures of AP2 and AP1 states are shown in (a) and (b). In (a),dV /dI changes little with temperature decreasing. In (b),
dV /dI increases at low temperatures. Bias dependence of current noise power SI at different temperatures is measured in (c) AP2
state and (d) AP1 state. From room temperature to low temperature, thermal noise decreases andFincreases. As a result, for large bias the noise power at low temperatures is larger than noise power at room temperature.
AP1. For both statesF increases and thermal noise decreases from 296 K to 20 K. Figures 4(a) and4(b) show the bias dependence of the differential resistance in AP2 and AP1 states. For AP2 states, Rd changes little with temperature
especially below 78 K, while F changes appreciably. It is obvious that the change ofF is not simply related toRd.
Figure5(a)summarizes the temperature dependence ofF
for the same two states. In the AP2 state, the Fano factor increases from 0.55 at 296 K to 0.73 at 20 K, while for AP1,
F also increases with decreasing temperature and approaches 1 below 78 K.
The temperature dependence in DBMTJs can be explained by sequential tunneling if we take spin into account. Following recent work [20], in the absence of spin relaxation electrons with up spin (spin-up channel) and electrons with down spin (spin-down channel) tunnel separately. Then, for each channel, the noise power is exactly like it is in the case of spinless particles. Therefore, shot noise can be calculated asS=S↑+ S↓, whereS↑andS↓are the contributions from the spin-up and spin-down channels as depicted in Fig.5(b). In this caseF can be expressed as
Fcoherent=
R1↑2 +R2↑2 R↓3+R1↓2 +R2↓2 R↑3 R2
↑R↓2(R↑+R↓)
, (2)
whereRiσ is the spin dependent resistance of theith (i=1,2)
barrier andRσ =R1σ+R2σ. If spin relaxation in the middle
layer is strong enough, only charge fluctuations need to be taken into account. In this case, the DBMTJ can be considered as two single barriers in series as shown in Fig.5(c). Then the
FIG. 5. (a) Temperature dependence ofFfor two states (AP1 and AP2). For both states it is much smaller than 1 at room temperature and close to 1 at low temperature for the AP1 state. But for the AP2 state,F continually increases with decreasing temperature. (b),(c) Schematic diagram of two sequential tunneling models (coherent and incoherent limit). Green layers are ferromagnetic and red layers are insulating. (b) At low temperatures, we can ignore spin relaxation in the middle ferromagnetic layer and the tunneling process can be separated as spin up and spin down channels (coherent limit). These two channels contribute to the total noise powerS. (c) When at high temperature, spin relaxation is strong, the tunneling process reaches incoherent limit. It is just like two SBMTJs in series with an island in between them.
F will be
Fincoherent=
R22↑R2↓2 (R1↑+R1↓)2+R21↑R21↓(R2↑+R2↓)2 [R1↑R1↓(R2↑+R2↓)+R2↑R2↓(R1↑+R1↓)]2.
(3)
For simplicity we can directly consider a DBMTJ as two SBMTJs in series and Eq. (3) can becomeFincoherent=1−
2R1R2
(R1+R2)2, where Ri =(Ri↑Ri↓)/(Ri↑+Ri↓) is the resistance
of theith barrier.
The spin relaxation length is limited by spin-orbital or spin-spin scattering from defects or impurities and scattering by phonons and magnons [30,31]. Scattering by phonons and magnons decreases with decreasing temperature. In this case, the tunneling process could change from incoherent limit to coherent limit as temperature decreases from high temperature to low. Therefore,F will change as the spin relaxation length changes at different temperature.
As in previous work [20], the following parameters are introduced:α=R0
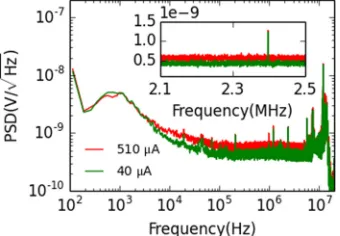
[image:3.608.315.557.66.246.2]FIG. 6. Typical spectrum measured of AP1r state at room
tem-perature for 40 uA (green) and 510 uA (red) bias current. The inset shows the frequency used to measure shot noise.
reaches a coherent limit at 20 K in our sample. For AP1,F also increases at low temperature and approaches 1 below 78 K. This is caused by the strongly asymmetric structure of our device. The Fano factor will approach 1 when β2 β1 no matter if it is coherent or incoherent tunneling.
Shot noise was also measured in single barrier MTJs, where
F was close to 1 and no temperature dependence was found. Results are shown in AppendixC.
IV. CONCLUSION
In conclusion, we measured shot noise at room temperature in a high-frequency bandwidth (2.1–2.5 MHz) and find that shot noise in the asymmetric DBMTJ shows temperature and magnetic state dependence. At a given temperature, the Fano factor is much larger in the high resistance AP1 state than in the other four states. It increases as temperature decreases from room temperature to low temperature for all magnetic states. We interpret our findings with larger spin relaxation length in the middle ferromagnetic layer at lower temperatures by using a sequential tunneling model.
ACKNOWLEDGMENTS
We thank Wei Han for very valuable discussion. J.S.N. thanks He Wang for helpful discussion on paper writing. Work at Peking University was supported by National Natural Science Foundation of China (NSFC, Grant No. 11474008), and The National Key Research and Development Program of China No. 2016YFA0300904, as well as National Basic Research Program of China (973 Program) through Grants No. 2011CBA00106 and No. 2012CB927400. Work at IOP, CAS was supported by the NSFC, Grant No. 11434014. Work at Trinity College Dublin was supported by SFI Contract No. 10/IN1.13006. X.G.Z. acknowledges support in part by NSF Grant No. ECCS-1508898. J.F.F. acknowledges Youth Innovation Promotion Association of Chinese Academy of Sciences (Grant No. 2017010)
APPENDIX A: TYPICAL SPECTRUM
[image:4.608.89.259.71.189.2]Figure6shows typical noise spectra of AP1rstate at room temperature for bias current of 40 uA (green) and 510 uA (red). We can select a suitable frequency range with flat noise power to get accurate white noise power. There is extra noise from
FIG. 7. Similar temperature and resistance dependence of Fano factor in another DBMTJ sample (DB2). Panels (a) and (b) show differential resistance of AP2 and AP1 states. Bias dependence of noise powerSIis shown for (a) AP2 state and (b) AP1 state. For both
states, Fano factor at AP1 state is larger than AP2 state.
amplifier AU1447 in the range of 0.1 kHz–4 kHz, which is the same for both current values. Below 100 kHz, the fast increase of the noise could be due to 1/f noise. The peak between 5 MHz and 15 MHz is extra noise from the ground loop. The damping at high frequency (>15 MHz) is caused by a low pass filter to avoid frequency aliasing [34]. 2.1–2.5 MHz is used to measure shot noise and is shown in the inset. Obviously, 1/f
noise is much smaller than shot noise at this frequency range. And shot noise increases with increasing bias current.
APPENDIX B: ANOTHER DBMTJ SAMPLE
Similar results are shown in Fig. 7 for another DBMTJ sample (DB2) with lower TMR (150%). Noise is again mea-sured at 2.1–2.5 MHz and differential resistance is used to calculate current noise. Fano factor in this sample also shows temperature and magnetic state dependence. Fano factor of the AP1 state is larger than the AP2 state, and it increases with temperature decreasing.
APPENDIX C: SINGLE BARRIER MTJ
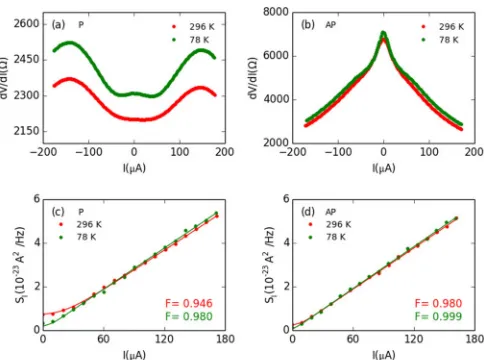
Noise was measured in a single-barrier MTJ sample with nearly 300% TMR. Results are shown in Fig.8. The differential resistance for P and AP states are shown in Figs.8(a)and8(b). Figures8(c)and8(d)show the bias dependence of noise power at two temperatures. The Fano factor does not show an obvious temperature or magnetic state dependence in the single-barrier MTJ case.
APPENDIX D: VOLTAGE DEPENDENCE
FIG. 8. Differential resistance and noise in a single barrier MTJ. Panels (a) and (b) show differential resistance for P and AP state at two temperatures. Bias dependence of noise powerSI at different
temperatures is measured for (c) P state and (d) AP state. Fano factor does not show obvious temperatures and field dependence in single barrier MTJ.
APPENDIX E: CALIBRATION OF AMPLIFIER
The current noise power measured by AU1447 isSmeasured=
Rsample2
(Rsample+50)2SI, where Rsample is the resistance of the sample
and SI is the current noise of the sample. When Rsample
resistance for AP2 and AP1 states at three typical temperatures.
is much larger than the 50 impedance, the current noise measured will approach the current noise of the sample. In this work, the current noise of the sample is calculated bySI =
(Rsample+50)2
Rsample2 Smeasured to get accurate Fano factor even though
Rsampleis much larger than 50.
The effective gain of amplifier is calibrated by a signal generator (Agilent 33521A) at three temperatures (296 K, 78 K, 20 K) below 3 MHz. A standard sine wave current excitation (I =10μA) is applied to the junction. The voltage measured should beV = Rsample
Rsample+50 ×I×50×G, whereGis
the effective gain of the amplifier. Effective gain is calibrated in this way. Not only DBMTJs but also different resistors (200, 500, 1 k, and 10 k) and SBMTJs are used as samples to complete this calibration. The effective gain does not change with temperature andRsamplebelow 3 MHz for all samples.
[1] J. S. Moodera, L. R. Kinder, T. M. Wong, and R. Meservey,
Phys. Rev. Lett.74,3273(1995).
[2] T. Miyazaki and N. Tezuka,J. Magn. Magn. Mater.139,L231
(1995).
[3] W. H. Butler, X.-G. Zhang, T. C. Schulthess, and J. M. MacLaren,
Phys. Rev. B63,054416(2001).
[4] J. Mathon and A. Umerski,Phys. Rev. B63,220403(2001). [5] S. S. P. Parkin, C. Kaiser, A. Panchula, A. Panchula, P. M.
Rice, B. Hughes, M. Samant, and S.-H. Yang,Nat. Mater. 3,
862(2004).
[6] S. Yuasa, T. Nagahama, A. Fukushima, Y. Suzuki, and K. Ando,
Nat. Mater.3,868(2004).
[7] J. Faure-Vincent, C. Tiusan, E. Jouguelet, F. Canet, M. Sajieddine, C. Bellouard, E. Popova, M. Hehn, F. Montaigne, and A. Schuhl,Appl. Phys. Lett.82,4507(2003).
[8] M. Bowen, V. Cros, F. Petroff, A. Fert, C. M. Boubeta, J. L. Costa-Kramer, J. V. Anguita, A. Cebollada, F. Briones, J. M. de Teresa, L. Morellon, M. R. Ibarra, F. Guell, F. Peiro, and A. Cornet,Appl. Phys. Lett.79,1655(2001).
[9] C. Tiusan, M. Sicot, M. Hehn, C. Belouard, S. Andrieu, F. Montaigne, and A. Schuhl,Appl. Phys. Lett.88,062512(2006). [10] S. Yuasa and D. D. Djayaprawira,J. Phys. D: Appl. Phys.40,
R337(2007).
[11] T. Nozaki, N. Tezuka, and K. Inomata,Phys. Rev. Lett. 96,
027208(2006).
[12] Y. Wang, Z.-Y. Lu, X.-G. Zhang, and X. F. Han,Phys. Rev. Lett.
97,087210(2006).
[13] C. Tiusan, F. Greullet, M. Hehn, F. Montaigne, S. Andrieu, and A. Schuhl,J. Phys.: Condens. Matter19,165201(2007). [14] D. L. Li, J. F. Feng, G. Q. Yu, P. Guo, J. Y. Chen, H. X. Wei,
X. F. Han, and J. M. D. Coey, J. Appl. Phys. 114, 213909
(2013).
[15] B. S. Tao, H. X. Yang, Y. L. Zuo, X. Devaux, G. Lengaigne, M. Hehn, D. Lacour, S. Andrieu, M. Chshiev, T. Hauet, F. Montaigne, S. Mangin, X. F. Han, and Y. Lu,Phys. Rev. Lett.
115,157204(2015).
[16] G. Q. Yu, Z. Diao, J. F. Feng, H. Kurt, X. F. Han, and J. M. D. Coey,Appl. Phys. Lett.98,112504(2011).
[17] G. Feng, S. van Dijken, J. F. Feng, J. M. D. Coey, T. Leo, and D. J. Smith,J. Appl. Phys.105,033916(2009).
[18] R. Guerrero, D. Herranz, F. G. Aliev, F. Greullet, C. Tiusan, M. Hehn, and F. Montaigne,Appl. Phys. Lett.91,132504(2007). [19] R. Guerrero, F. G. Aliev, Y. Tserkovnyak, T. S. Santos, and J. S.
Moodera,Phys. Rev. Lett.97,266602(2006).
[20] J. P. Cascales, D. Herranz, F. G. Aliev, T. Szczepański, V. K. Dugaev, J. Barnaś, A. Duluard, M. Hehn, and C. Tiusan,Phys. Rev. Lett.109,066601(2012).
[21] Y. P. Li, A. Zaslavsky, D. C. Tsui, M. Santos, and M. Shayegan,
Phys. Rev. B41,8388(1990).
[22] A. Gokce, R. Stearrett, E. R. Nowak, and C. Nordman,Fluct. Noise Lett.10,381(2011).
[23] B. R. Bułka, J. Martinek, G. Michałek, and J. Barnaś,Phys. Rev. B60,12246(1999).
[image:5.608.52.294.68.248.2][28] G. Hui-Qiang, T. Wei-Yue, L. Liang, W. Jian, L. Da-Lai, F. Jia-Feng, and H. Xiu-Jia-Feng,Chin. Phys. B24,078504(2015). [29] P. Zhou, W. J. Hardy, K. Watanabe, T. Taniguchi, and D.
Natelson,Appl. Phys. Lett.110,133106(2017).
J. Appl. Phys.108,023908(2010).
[34] L. DiCarlo, Y. Zhang, D. T. McClure, C. M. Marcus, L. N. Pfeiffer, and K. W. West, Rev. Sci. Instrum. 77, 073906