https://doi.org/10.5194/hess-23-4933-2019 © Author(s) 2019. This work is distributed under the Creative Commons Attribution 4.0 License.
Are the effects of vegetation and soil changes as important as
climate change impacts on hydrological processes?
Kabir Rasouli1,2, John W. Pomeroy2, and Paul H. Whitfield2,3
1Department of Geoscience, University of Calgary, Calgary, AB, T2N 1N4, Canada
2Centre for Hydrology, University of Saskatchewan, Saskatoon, SK & Canmore, AB, T1W 3G1, Canada 3Environment and Climate Change Canada, Vancouver, BC, V6C 3S5, Canada
Correspondence:Kabir Rasouli ([email protected]) Received: 1 May 2019 – Discussion started: 20 May 2019
Revised: 17 October 2019 – Accepted: 5 November 2019 – Published: 3 December 2019
Abstract. Hydrological processes are widely understood to be sensitive to changes in climate, but the effects of con-comitant changes in vegetation and soils have seldom been considered in snow-dominated mountain basins. The re-sponse of mountain hydrology to vegetation/soil changes in the present and a future climate was modeled in three snowmelt-dominated mountain basins in the North Amer-ican Cordillera. The models developed for each basin us-ing the Cold Regions Hydrological Modelus-ing platform em-ployed current and expected changes to vegetation and soil parameters and were driven with recent and perturbed high-altitude meteorological observations. Monthly perturbations were calculated using the differences in outputs between the present- and a future-climate scenario from 11 regional cli-mate models. In the three basins, future clicli-mate change alone decreased the modeled peak snow water equivalent (SWE) by 11 %–47 % and increased the modeled evapotranspiration by 14 %–20 %. However, including future changes in vege-tation and soil for each basin changed or reversed these cli-mate change outcomes. In Wolf Creek in the Yukon Territory, Canada, a statistically insignificant increase in SWE due to vegetation increase in the alpine zone was found to offset the statistically significant decrease in SWE due to climate change. In Marmot Creek in the Canadian Rockies, the in-crease in annual runoff due to the combined effect of soil and climate change was statistically significant, whereas their in-dividual effects were not. In the relatively warmer Reynolds Mountain in Idaho, USA, vegetation change alone decreased the annual runoff volume by 8 %, but changes in soil, cli-mate, or both did not affect runoff. At high elevations in Wolf and Marmot creeks, the model results indicated that
vegeta-tion/soil changes moderated the impact of climate change on peak SWE, the timing of peak SWE, evapotranspiration, and the annual runoff volume. However, at medium elevations, these changes intensified the impact of climate change, fur-ther decreasing peak SWE and sublimation. The hydrological impacts of changes in climate, vegetation, and soil in moun-tain environments were similar in magnitude but not consis-tent in direction for all biomes; in some combinations, this resulted in enhanced impacts at lower elevations and latitudes and moderated impacts at higher elevations and latitudes.
1 Introduction
4934 K. Rasouli et al.: Are vegetation and soil changes as important as climate changes?
major drivers of vegetation change in western North Amer-ica are climate, mountain pine beetle, logging, and wildfires (Macias-Fauria and Johnson, 2009; Halofsky et al., 2018).
At northern latitudes, where the air temperature is low, the growing season is short, cloud cover is persistent, and the solar angle is small, the vegetation composition responds quickly to changes in climate and nutrient availability; with warming, rapid changes in thawing and freezing processes (Zhang et al., 2008; Walvoord and Kurylyk, 2016), snowmelt rates, and soil moisture (Bales et al., 2011) are expected. One example of how the interaction between climate and veg-etation can change ecosystems is the expansion of shrubs in northern latitudes (Martin et al., 2017; Myers-Smith and Hik, 2018). Warming degrades permafrost in northern moun-tains and leads to shrub tundra expansion (Tape et al., 2006; Hallinger et al., 2010). Increased shrub coverage traps more windblown snow, increases snowmelt volumes, lowers spring albedo, and alters melt rates (Pomeroy et al., 2006; Krogh and Pomeroy, 2018). Warming has also resulted in increases in the height of the tundra community (Bjorkman et al., 2018). Many mountain plants begin growth at near-freezing temperatures when snowpacks start to melt (Billings and Bliss, 1959), and snow depth and snowmelt rates affect veg-etation composition (Billings and Bliss, 1959; Stanton et al., 1994). In a warmer climate, the abundance of cold-adapted species decreases and warmth-demanding vegetation expands into higher elevations (Lamprecht et al., 2018); thus, plant communities shift to more northern latitudes (Alberta Natural Regions Committee, 2006; Schneider et al., 2009; Mann et al., 2012; Schneider, 2013; Myers-Smith and Hik, 2018).
Changes in vegetation can lead to changes in soil prop-erties and important local and global feedbacks in ecohy-drological processes and energy budgets (Osterkamp et al., 2009; Rawlins et al., 2009). Soil development, however, may not occur as quickly as vegetation change (Innes, 1991), and soil properties may vary from the initial phase of the colo-nization of the bare surface to the establishment of a forest (Crocker and Major, 1955). In cold regions in general, and mountains in particular, the amount and timing of snowmelt affects vegetation type, soil moisture, nutrient transport, soil and leaf temperature, surface microclimate, and growing sea-son (Billings and Bliss, 1959; Walker et al., 1993; Stanton et al., 1994; Callaghan et al., 2011). Potential changes in soil, especially changes in the organic matter content, can have just as important effects on soil moisture, permafrost, infiltra-tion, groundwater recharge, and runoff processes as climate, hydrology, and vegetation change (DeBano, 1991; DeFries and Eshleman, 2004; Osterkamp et al., 2009). Deforestation increases soil bulk density and decreases soil porosity, both of which alter infiltration, percolation, aeration, and erodi-bility (Reiners et al., 1994). Increased active layer thickness over permafrost, as a result of the warming climate, allows more subsurface water storage, higher nutrient transport, and a deeper root zone, which is favorable for shrub expansion
(Sturm et al., 2005). Because they are interrelated but have an uncertain timing, it is important to consider – both sepa-rately and in combination – the climate, vegetation, and soil changes that may occur in future.
Simulations of future hydrological conditions in moun-tains are challenging due to the large biases between climate model outputs and locally observed hydroclimatic conditions as well as the seasonal nature of snow accumulation and de-pletion (Fowler et al., 2007; Bennett et al., 2012). In the cli-mate perturbation method, also known as the delta change factor method, (e.g., Rasouli et al., 2014, 2015), observations are perturbed using the difference (delta) between modeled present and future climates. This method avoids the compu-tational cost of dynamical downscaling and maintains consis-tency in relationships of the atmospheric fields, which may be distorted in statistical methods if the interaction of the variables is not considered (Hijmans et al., 2005; Gutmann et al., 2016). Unlike the direct use of regional climate model (RCM) outputs, the perturbation approach produces spatial and seasonal precipitation patterns based on observations, with the changes due to differences between present and fu-ture simulated climate (Hay et al., 2000; Kay et al., 2009; Sunyer et al., 2012). This represents weather with reason-able accuracy and also represents observed extremes such as dry periods and storms. Of particular importance for moun-tain hydrology is the realistic representation of the dynam-ics of precipitation, its phase, and its increase with eleva-tion. Limitations of applying monthly climatological change factors to perturb the climate are that any future changes in large-scale weather patterns and their impact on extremes, and sequences of wet or dry spans are not adequately rep-resented. This is similar to the assumption of stationarity in the relationships between large-scale circulations and lo-cally observed data that are made in statistical downscaling. Changes in synoptic dynamics of the atmosphere cannot be captured by the climate perturbation method, nor can RCMs capture local-scale processes in mountainous regions (Ra-souli, 2017).
changes impacts hydrological processes and basin-level dis-charge (Brown et al., 2005).
Interactions between climate, vegetation, and soils are complex (Rodriguez-Iturbe, 2000) and the time lag between vegetation response to climate changes and soil response to climate and vegetation changes is unclear (Innes, 1991). In a warmer climate, with a longer snow-free season, and in-creased precipitation in northern latitudes, vegetation is ex-pected to increase where adequate soil moisture and nutri-ents permit. Therefore, assuming there will be no change in vegetation in future climates introduces uncertainty and possible errors in hydrological impact studies of climate change. Modeling climate change effects on hydrology with and without vegetation and soil changes can help to under-stand the separate and combined effects of climate, vege-tation, and soil changes in mountainous headwater basins. Rasouli et al. (2019a) show that future climates are warmer and wetter, especially in the northern latitudes, and that tem-perature and precipitation changes have complex effects in snow-dominated watersheds. Warmer and wetter future con-ditions are expected to drive vegetation, soil, and hydrologi-cal changes, but such changes have not been thoroughly stud-ied. The objective of this study is to investigate the hydrolog-ical changes due to climate perturbations, building on Ra-souli et al. (2019a), and plausible concomitant soil and vege-tation changes, adapted from Alberta Natural Regions Com-mittee (2006), Schneider et al. (2009), and Myers-Smith and Hik (2018) for three instrumented headwater basins rang-ing from middle to high latitudes in the North American Cordillera.
2 Methods
2.1 Study sites and data sources
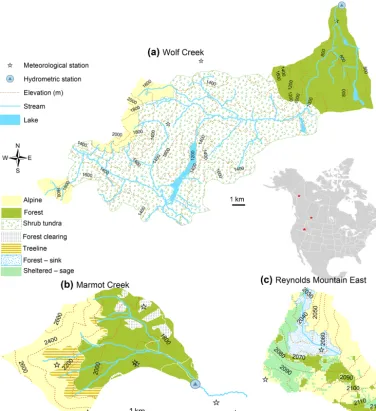
Three mountain basins ranging from middle to high lati-tudes in the North American Cordillera are examined: a sub-arctic basin (Wolf Creek Research Basin ∼61◦N, Yukon Territory, Canada), a headwater catchment in the Canadian Rockies (Marmot Creek Research Basin,∼51◦N, Alberta, Canada), and a small catchment with a cool montane cli-mate (Reynolds Mountain East catchment, hereafter called Reynolds Mountain, ∼43◦,N, Idaho, USA) (Fig. 2). All three basins are located in transition climate zones based on the Köppen climate classification (Köppen 1936). Wolf Creek has the shortest distance to the Pacific Ocean (Fig. 1), the lowest average elevation, the coldest climate, and the lowest annual precipitation amongst the three basins. Mar-mot Creek has the highest elevation, the largest elevation range, and the highest annual precipitation and wind speed. Reynolds Mountain has the smallest drainage area, the high-est average elevation, and the lowhigh-est wind speed (Table 1).
Jack pine, spruce, and aspen forests are the dominant veg-etation types at low elevations in Wolf Creek (Francis et al.,
1998), and 65 % of the basin area above the forest biome is covered with birch and willow shrub tundra with heights ranging between 30 cm and 2 m. Alpine tundra with short moss, grass, and bare rock covers high elevations in Wolf Creek. Engelmann spruce and subalpine fir cover high el-evations and lodgepole pine stands cover low elel-evations in Marmot Creek (Kirby and Ogilvie, 1969). Areas adjacent to the treeline in Marmot Creek are covered with shrubs and alpine larch. The alpine zone is composed of grass, moss, and large areas of bare rock. The spatial variability of vege-tation is large within the Reynolds Mountain area (Seyfried et al., 2009; Winstral and Marks, 2014), and grass, mountain sagebrush, riparian willow, aspen, and coniferous trees are the dominant vegetation types in this basin. Almost 43 % of Wolf Creek is covered by continuous and discontinuous per-mafrost (Lewkowicz and Ednie, 2004). Soils do not freeze in Reynolds Mountain and freeze seasonally in Marmot Creek. Precipitation was measured using a tipping-bucket rain gauge, an unshielded “BC-style standpipe”, and Nipher-shielded storage gauges in Wolf Creek, using an Alter-shielded Geonor storage gauge in Marmot Creek, and using shielded and unshielded storage gauges in Reynolds Motain. Snowfall observations were adjusted using wind un-dercatch correction equations (Goodison et al., 1998; Smith, 2009) based on wind-shield and wind speeds measured at gauge height. Air temperature, humidity, wind speed, short-wave radiation, and streamflow were measured and stored at hourly time steps for each basin. Suitable driving meteo-rological time series from these observations were available for 1993–2011 in Wolf Creek, 2005–2014 in Marmot Creek, and 1983–2008 in Reynolds Mountain. Long-term datasets and descriptions of the variables for each basin were pub-lished by Reba et al. (2011), Fang et al. (2019), and Rasouli et al. (2019b).
2.2 Modeling strategy
variabil-4936 K. Rasouli et al.: Are vegetation and soil changes as important as climate changes?
Figure 1.Vegetation, hydrography, topography, and meteorological stations of the three headwater study basins:(a)Wolf Creek Research Basin, Yukon Territory, Canada;(b)Marmot Creek Research Basin, Alberta, Canada; and(c)Reynolds Mountain within the Reynolds Creek Experimental Watershed, Idaho, USA.
ity of basin attributes. The CRHM models were run at hourly time steps (Table 1). Details on model parametrization and performance are available in Rasouli et al. (2014, 2015) and Rasouli (2017).
Eight change cases were used to differentiate the individ-ual and combined effects of changes in climate (1C), veg-etation (1V), and soils (1S) from the present conditions (base case). The vegetation and soil changes applied are con-ceptualized in Fig. 2 and summarized in Table 2. The ef-fects of vegetation and soil changes on snow regimes and hydrological variables were evaluated under conditions in which: (1) climate does not change, but vegetation and/or soil changes occur (1V S), (2) climatic conditions change but no changes in future vegetation and/or soil occur (1C), and (3) changes in future climate will be accompanied by
Table 1.Comparison of physiography and climatology amongst the three basins. UC denotes the “Upper Clearing” meteorological station in the Marmot Creek Research Basin.
Characteristics Wolf Creek Marmot Creek Reynolds Mountain
Latitude 60◦360N 50◦570N 43◦110N
Longitude 134◦570W 115◦090W 116◦470W
Drainage area (km2) 179 9.4 0.38
Elevation range (m) 660–2080 1600–2825 2028–2137
Record period 1993–2011 2005–2014 1983–2008
Dominant vegetation cover
High elevation Tundra moss Rock and grass Grass and sage Middle elevation Shrub tundra Spruce and fir Fir
Low elevation Spruce Lodgepole pine Aspen and willow
Climate zone Cordillera and Cordillera, prairie, Cordillera, continental subarctic and boreal and Mediterranean
Elevation bands 3 3 1
Temperature (◦C)
High elevation −3.4 −1.8 5.0
Middle elevation −2.0 1.0 (UC) –
Low elevation −1.5 2.9 –
Number of freezing days
High elevation 224 217 120
Middle elevation 203 166 (UC)
Low elevation 179 128
Precipitation (mm) 380 1011 858
Wind speed (m s−1) 3.7 5.8 1.9
Relative humidity (%) 74 69 61
Number of subbasins & HRUs 5 & 29 4 & 36 1 & 12 HRU area range (km2) 0.92–25.4 0.01–1.37 0.01–0.07
Table 2.Description of the eight cases of change in climate, vegetation, and soils.
Climate Vegetation and soil case Notation used Actual change in text
Present Present vegetation and present soil Base No change Present Future vegetation and present soil 1V Only vegetation Present Present vegetation and future soil 1S Only soil
Present Future vegetation and future soil 1V S Both vegetation and soil Future Present vegetation and present soil 1C Only climate
Future Future vegetation and present soil 1CV Both vegetation and climate Future Present vegetation and future soil 1CS Both soil and climate Future Future vegetation and future soil 1CV S Climate, vegetation, and soil
climate with persistent water deficits. Other combinations of these vegetation changes in the three basins were explored to examine hydrological uncertainty due to various terrestrial ecosystem trajectories; they produced similar results and are not presented here. Changes in the organic layer of soils fol-lowing vegetation changes can alter the soil characteristics, including soil macropores and, hence, alter snowmelt and rainfall infiltration, thawing and freezing processes, recharge into groundwater, and runoff mechanisms. The soil porosity in different soil layers and soil depth were two soil model parameters that were altered to bring the changed soil
char-acteristics in line with those currently associated with vege-tation and land cover types (Fig. 2).
[image:5.612.121.474.432.554.2]dif-4938 K. Rasouli et al.: Are vegetation and soil changes as important as climate changes?
Figure 2.Schematic illustration of the vegetation cover under the base case and future climate, vegetation, and soil (1CV S) in the Wolf Creek Research Basin, the Marmot Creek Research Basin, and Reynolds Mountain. Dark shading indicates areas where changes to the soil are expected in future. The numbers show the areal percentage of the alpine, forest, shrub tundra, grassland, and forest clearing biomes.1T, 1P, and1SWE are from Rasouli et al. (2019a).
ferent changes (i) vegetation change only, (ii) soil change only, and (iii) both vegetation and soil change.
2.3 Perturbed observations
Monthly perturbed climates were constructed from a down-scaling method applying delta changes in monthly climatol-ogy to base case hourly meteorological observations from various elevations in the research basins; see Rasouli et al. (2019a) for details. The monthly perturbation was de-termined from the results of 11 regional climate models from the North American Regional Climate Change As-sessment Program (NARCCAP), which are driven by out-puts from multiple global climate models (GCMs) for the SRES A2 emission scenario (Mearns et al., 2007). Using observed data modified by the monthly delta gives an esti-mate of the potential cliesti-mate change impacts on these driv-ing forces consistent with large-scale atmospheric circula-tions. The deltas used were the difference between the simu-lated current monthly 30-year climatology (1971–2000) and the future (2041–2070) monthly 30-year climatology (2041– 2070) for 11 RCMs (Rasouli et al., 2019a).
2.4 Significance testing
Significant changes and differences in water balance compo-nents, snow characteristics, and their timing (initiation date, peak SWE date, snow-free date, and duration of snow cover season) between simulations under the present period (base case) and simulations under different cases of changes in cli-mate (1C), vegetation (1V), and soil (1S) were assessed using a nonparametric Mann–Whitney U test (Wilcoxon, 1945; Mann and Whitney, 1947). The differences between simulated distributions in the modeled present period forn
the 11 RCMs and the years of observations in each water-shed.
2.5 The Tukey honestly significant difference test An analysis of variance (ANOVA) was used to determine if there was a case that was different from the others. This test, however, does not provide information on the pattern of differences between the means of the eight cases (Table 2). The Tukey honestly significant difference (HSD) test (Tukey, 1991) is a widely used test to analyze the pattern of differ-ence between means using pairwise comparisons. In the pair-wise comparisons, the significant difference between a pair of means is determined using a statistical distribution that gives the exact sampling distribution of the largest difference between a set of means originating from the same population (Abdi and Williams, 2010). In this test, groups that are sta-tistically different based upon paired comparison are labeled “a”, “b”, and so on, and are ordered by mean from lowest to highest. Using an analysis of variance on the annual differ-ences between the modeled future and the modeled base case and the Tukey HSD test for each basin, differences in snow and runoff under the four groups of the eight cases were de-termined (Table 2).
3 Results
3.1 Synergic effects of climate, vegetation, and soil changes on snow and runoff regimes
Changes in simulated peak SWE and annual runoff volume due to vegetation, soil, and their interaction in the present climate (1V,1S, and1V S) were compared with the mod-eled present (base case; no changes in climate, vegetation, and soil) to determine the effect of individual or combined changes. Similarly, changes in simulated peak SWE and runoff due to changes in vegetation, soil, and their interac-tion in the future climate were compared with future-climate change as well as the present climate. In total, four cases under the present climate and four cases under the future climate were studied and statistical differences, based on the Tukey HSD test, were distinguished from the modeled present; all cases were then classified into multiple groups for each variable (Figs. 3, 4, 5).
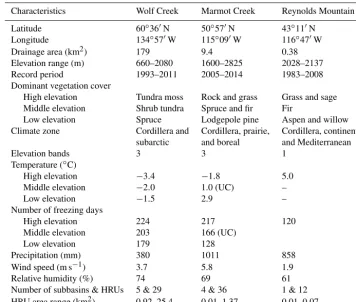
In Wolf Creek (Fig. 3), the peak SWE declined signifi-cantly with1C(group “a”) in the alpine biome (Fig. 3a), and increased insignificantly with 1V and1V S in the present climate. Peak SWE decreased significantly with1C,1CV,
1CS, and1CV S (groups “a” and “b”) in the shrub tundra biome (Fig. 3b), and did not change significantly with any combination of vegetation change and climate change in the forest biome (all eight cases are in group “a”) (Fig. 3c). In the alpine biome within Wolf Creek, the effect of increasing alpine vegetation on increasing peak SWE (Fig. 3a) is not sta-tistically significant by itself, but it was sufficient to offset the
significant decrease in SWE from climate change. In contrast to the forest biome SWE in Wolf Creek, which is not affected by any changes (Fig. 3c), and to the alpine biome, where combined changes counteracted each other, the decrease in peak SWE in the shrub tundra biome due to climate change is intensified with concomitant vegetation change (Fig. 3b). Soil changes do not affect peak SWE in Wolf Creek. The annual runoff volume in Wolf Creek decreases significantly with1V,1S, and1V Schange cases in the present climate and increases significantly for the future climate 1C, and
1CScases (Fig. 3d). The decrease in annual runoff with soil and vegetation changes (1V,1S, and1V S) in the present climate (groups “a” and “b”) is offset by the increases in runoff with climate change (group “d”), such that the com-bined effects of climate, vegetation, and soil change (1CV
and1CV S) on runoff in Wolf Creek are not different from the base case of current conditions.
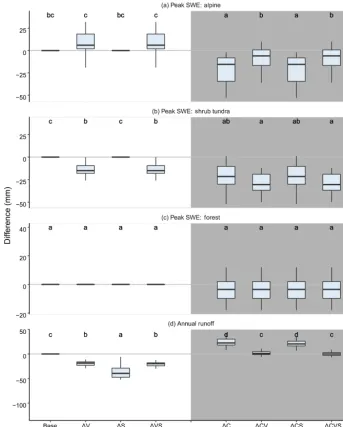
In Marmot Creek (Fig. 4), the high-elevation alpine biome peak SWE showed no significant response to vegetation and/or climate changes (all eight cases are in group “a”, Fig. 4a). In the forest biome, peak SWE declines with climate change (1C; group “a” vs. base case group “b”, Fig. 4b). In the forest clearing and treeline biomes (Fig. 4d, e), there are significant decreases in peak SWE under1V and1V S; in the forest clearing, these significant decreases are also seen with climate changes and all case combinations (groups “a” and b”, Fig. 4c and d). Soil changes alone (1S) do not affect peak SWE in Marmot Creek. The annual runoff volume in Marmot Creek decreases with1V and1V S and increases with1CS (Fig. 4e). This counteracting behavior is evident in the response of annual runoff to1C and1CV S, which is not significantly different from the base case (all are in group “b”). In contrast, the combined effect of climate and soil change (1CS – “c” in Fig. 4e) is magnified from that of climate alone. Therefore, soil–climate interactions (1CS) are more important in changing annual runoff in Marmot Creek than the individual effects of soil and climate and are counteracted by concomitantly changing vegetation.
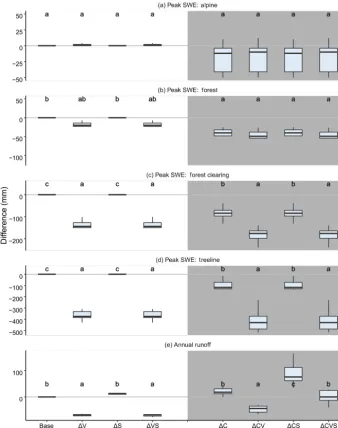
In Reynolds Mountain (Fig. 5), the alpine biome peak SWE decreases significantly under climate change (1C; group “a”, Fig. 5a). Significant decreases in peak SWE occur with both vegetation and climate change (groups “a” and “b”) in the respective forest biome (Fig. 5b), the blowing wind sheltered zone (Fig. 5c), and the blowing snow sink zone (Fig. 5d). The peak SWE in all of the biomes in Reynolds Mountain shows significant decreases under climate, veg-etation, and under a combination of the two (Fig. 5), ex-cept for the alpine biome, which shows a significant de-crease only due to climate change (Fig. 5a). Similar to the other two basins, soil changes do not affect peak SWE in Reynolds Mountain. Climate change (1C) and soil change (1CS) do not affect the annual runoff volume, whereas vege-tation change and combined vegevege-tation and soil change (1V
4940 K. Rasouli et al.: Are vegetation and soil changes as important as climate changes?
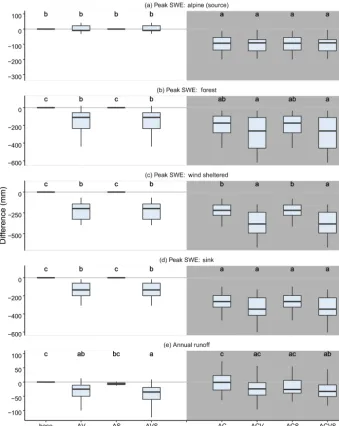
Figure 3. Differences in peak snow water equivalent (SWE) and annual runoff volume under seven combinations of changes in climate, vegetation, and soil in the Wolf Creek Research Basin relative to present climate, present vegetation, and present soil with no change (base). Lower case letters from the Tukey HSD test indicate groups that are significantly different from each other. The unshaded cases on the left-hand side of the plot demonstrate changes under modeled present climate, and the shaded cases on the right-left-hand side of the plot demonstrate vegetation and soil changes under modeled future-climate cases.
runoff is not statistically significant, its combined effect can enhance the effect of the vegetation change in diminishing annual runoff from this basin (Fig. 5e).
3.2 Snow characteristics
Basin-scale snow regime characteristics including peak SWE, length of the snow season, snow initiation date, mean annual peak SWE, and timing of snow-free date were sim-ulated for current and future climate, vegetation, and soils in the three basins. Under the current climate, soil changes did not affect snow regime characteristics, and vegetation
Figure 4. Differences in peak snow water equivalent (SWE) and annual runoff volume under seven combinations of changes in climate, vegetation, and soil in the Marmot Creek Research Basin relative to present climate, present vegetation, and present soil with no change (base). Lower case letters from the Tukey HSD test indicate groups that are significantly different from each other. The unshaded cases on the left-hand side of the plot demonstrate changes under modeled present climate, and the shaded cases on the right-hand side of the plot demonstrate vegetation and soil changes under modeled future climate.
statistically significant based on the Mann–Whitney U test (pvalues≤0.05).
The difference between times series and their spread of the present and future peak SWE modeled using driving meteo-rology from 11 regional climate models (11×nvalues) for
n=18 years for Wolf Creek, 9 years for Marmot Creek, and 25 years for Reynolds Mountain are shown in Fig. 6 and Ta-ble 4. Peak SWE decreases from 133 mm under the current climate to 118 mm (11 % decrease) under climate change and to 107 mm (20 %) when vegetation change is considered in combination with climate change in Wolf Creek. In Marmot
4942 K. Rasouli et al.: Are vegetation and soil changes as important as climate changes?
Figure 5. Differences in peak snow water equivalent (SWE) and annual runoff volume under seven combinations of changes in climate, vegetation, and soil in the Reynolds Mountain area relative to present climate, present vegetation, and present soil with no change (base case). Lower case letters from the Tukey HSD test indicate groups that are significantly different from each other. The unshaded cases on the left-hand side of the plot demonstrate changes under modeled present climate, and the shaded cases on the right-hand side of the plot demonstrate vegetation and soil changes under modeled future climate.
vegetation changes under the current climate, the peak SWE decreases more in Marmot Creek (26 %) than in Wolf Creek and Reynolds Mountain (11 %). Therefore, under the com-bined climate and vegetation change studied in this research, the maximum accumulated SWE is the most stable in Wolf Creek and most sensitive in Reynolds Mountain.
The significant responses to vegetation change (1V in Figs. 3–5) shows that vegetation change in all three basins has an important effect on snow and runoff regimes, except for the snow regimes in the alpine and forest biomes in Mar-mot Creek. Figure 6 shows the snowpack regimes in
vari-ous current biomes and at varivari-ous elevations for the three basins under current (base), changed climate (1C), changed vegetation (1V), and both changed climate and vegetation (1CV) cases with shading to reflect interannual variability. The simulated snowpack regimes for1C, 1V, and 1CV
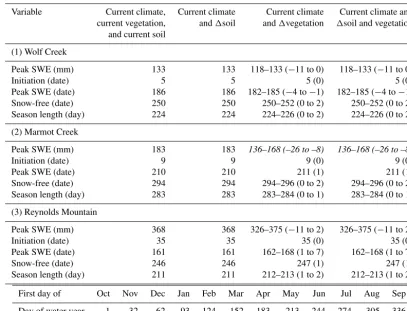
Table 3.Simulated basin-scale snow characteristics under current climate and future vegetation and soil for the three basins. Values in italic font denote significant changes withpvalues of less than 0.1. Changes relative to current climate/vegetation/soil and are given in parentheses.
Variable Current climate, Current climate Current climate Current climate and current vegetation, and1soil and1vegetation 1soil and vegetation
and current soil
(1) Wolf Creek
Peak SWE (mm) 133 133 118–133 (−11 to 0) 118–133 (−11 to 0)
Initiation (date) 5 5 5 (0) 5 (0)
Peak SWE (date) 186 186 182–185 (−4 to−1) 182–185 (−4 to−1)
Snow-free (date) 250 250 250–252 (0 to 2) 250–252 (0 to 2)
Season length (day) 224 224 224–226 (0 to 2) 224–226 (0 to 2)
(2) Marmot Creek
Peak SWE (mm) 183 183 136–168 (–26 to –8) 136–168 (–26 to –8)
Initiation (date) 9 9 9 (0) 9 (0)
Peak SWE (date) 210 210 211 (1) 211 (1)
Snow-free (date) 294 294 294–296 (0 to 2) 294–296 (0 to 2)
Season length (day) 283 283 283–284 (0 to 1) 283–284 (0 to 1)
(3) Reynolds Mountain
Peak SWE (mm) 368 368 326–375 (−11 to 2) 326–375 (−11 to 2)
Initiation (date) 35 35 35 (0) 35 (0)
Peak SWE (date) 161 161 162–168 (1 to 7) 162–168 (1 to 7)
Snow-free (date) 246 246 247 (1) 247 (1)
Season length (day) 211 211 212–213 (1 to 2) 212–213 (1 to 2)
First day of Oct Nov Dec Jan Feb Mar Apr May Jun Jul Aug Sep
Day of water year 1 32 62 93 124 152 183 213 244 274 305 336
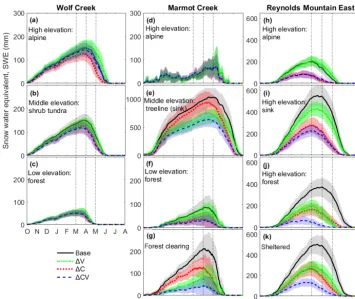
higher elevations under 1V, which reduces blowing snow transport and subsequent sublimation of blowing snow and also slows snowmelt rates (Pomeroy et al., 2006). Changes in the rate of snowmelt can be assessed by comparison of the slope of the curve during the ablation period in Fig. 6. There is no change in the slope between the base case and 1CV
in the alpine and forested biomes of Wolf Creek (Fig. 6a–c) or in the alpine biomes of Marmot Creek (Fig. 6d); however, these slopes decrease under 1CV at the middle elevations in Wolf Creek, the lower elevations in Marmot Creek, and at all elevations in Reynolds Mountain (Fig. 6e–k), indicat-ing a slower melt rate. Under 1CV, the effect of climate change on the alpine snowpack is moderated by the impact of the shrub tundra expansion into high-elevation alpine tundra. However, at middle elevations, shrubs are expected to be re-placed by forest; therefore, under1CV, the peak snowpack decreases from 156 to 127 mm (19 % decrease, Fig. 6b). Veg-etation change is expected to be negligible at low elevations in Wolf Creek; therefore, the snowpack is only disturbed by climate change impacts in these simulations (Fig. 6c).
In Marmot Creek, the anticipated advance of trees into alpine tundra causes a small increase in the simulated peak SWE and slower ablation rates at high elevations under the
1V scenario (Fig. 6d). In contrast to greater snowpacks
with upward movement of the treeline (1V), climate change alone (1C) slightly decreases peak SWE in the alpine biome. The treeline acts as an important sink for blowing snow trans-port and accumulates deep snowdrifts; thus, the effect of treeline movement out of the upper middle elevations (1V) on reducing snowpacks is even greater than that of climate change (1C; Fig. 6e). This is due to the suppression of snow redistribution to the former treeline with afforestation and subsequent sublimation of intercepted snow in newly forested needleleaf canopies, which is enhanced by climate change (1CV). At low elevations, snow accumulation de-creases from 87 to 39 mm (48 mm) under combined climate change and conversion of forest to shrub and grass (Fig. 6f). Forest clearings currently store deep snowpacks; however, with regrowth of harvested forest, the peak snow will de-crease as intercepted snow sublimation inde-creases (Fig. 6g). Climate change has less impact than forest regrowth in these harvested clearings. In Marmot Creek, the impact of vegeta-tion change on peak snowpack timing offsets the impact of climate change. The date of the peak SWE is delayed with only1V and advanced with only1C(Table 3).
disap-4944 K. Rasouli et al.: Are vegetation and soil changes as important as climate changes?
Figure 6.Simulated snowpack accumulation and ablation under current climate and vegetation (base scenario) and changes due to climate and vegetation changes at different elevation levels and in current biomes in the Wolf Creek Research Basin, the Marmot Creek Research Basin, and Reynolds Mountain. Reynolds Mountain only has one elevation band but multiple blowing snow regimes. The 95 % confidence intervals shown by the shaded areas indicate the interannual variability. The three vertical lines denote the first days of March, April, and May, respectively.
pears. Despite the small impact of vegetation change in the alpine biome which is covered with grass and short moun-tain sages, the impact of1Con the snowpack in this biome is large (Fig. 6h). The forest biome in the Reynolds Moun-tain area is most sensitive to1CV, based on a large decrease in the peak snowpack (Fig. 6j). The interannual variability of SWE, which is expressed as 95 % confidence intervals in Fig. 6, becomes smaller in all of the biomes within the three basins under climate perturbation because the snowpack be-comes shallower under1CV and variability of the shallow snowpack becomes smaller. This can occur despite an in-creased variability of precipitation under future climate con-ditions. The interannual variability of SWE does not change in the alpine biome under1V.
Snow regimes are the most resilient to1CV at high eleva-tions in Wolf Creek and Marmot Creek and low elevaeleva-tions in Wolf Creek, with less than a 10 % decrease in peak SWE. In contrast, snow regimes in the forest clearings in Mar-mot Creek and in the forest and sheltered sites in Reynolds Mountain are very sensitive to 1CV, with 80 % and 68 % decreases, respectively, due to the role of canopy changes enhancing climate change impacts with respect to reducing SWE. Under 1V, peak SWE drops from 87 to 46 mm (a
47 % decrease) at low elevations in Marmot Creek with the conversion of forest into grassland. Impacts of1C on snow regimes can be enhanced or dampened by the impact of1V. Shrub tundra expansion into the higher elevations in Wolf Creek can substantially dampen the impact of climate change on the snowpack because it suppresses blowing snow trans-port and sublimation. However, forest expansion above the current treelines or into forest clearings enhances1C im-pacts on the snowpack by introducing the sublimation of in-tercepted snow. Therefore, the impact of shrubification or af-forestation on the snowpack can be as important as the im-pact of climate change.
3.3 Precipitation phase
rain-Table 4. Simulated snow characteristics under current and monthly perturbed climate and future vegetation and soil in the three basins. Bold and italic values denote significant changes with pvalues of less than 0.05 and 0.1, respectively. Changes, relative to current cli-mate/vegetation/soil, are given in parentheses. Dates are given in water year days.
Variable Base 1Climate, 1Climate and 1Climate and 1Climate,
current vegetation, and soil 1soil 1vegetation 1soil, and1vegetation
Mean 5 % Mean 95 % 5 % Mean 95 % 5 % Mean 95 % 5 % Mean 95 %
(1) Wolf Creek
Peak SWE (mm) 133 73 118 (−11) 153 73 118 (−11) 153 64 107 (–20) 142 64 107 (–20) 142
Initiation (date) 5 0 7 (2) 47 0 7 (2) 47 0 7 (2) 45 0 7 (2) 45
Peak SWE (date) 186 143 164 (–22) 178 143 164 (–22) 178 148 164 (–22) 170 148 164 (–22) 170 Snow-free (date) 250 213 235 (–15) 248 213 235 (–15) 248 216 236 (–14) 249 216 236 (–14) 249 Season length (day) 224 160 208 (–16) 242 160 208 (–16) 242 164 215 (–9) 251 164 215 (–9) 251
(2) Marmot Creek
Peak SWE (mm) 183 102 141 (–23) 170 102 141 (–23) 170 74 106 (–42) 130 74 106 (–42) 130
Initiation (date) 9 4 24 (15) 62 4 24 (15) 62 4 24 (15) 63 4 24 (15) 63
Peak SWE (date) 210 175 200 (–10) 216 175 200 (–10) 216 177 205 (−5) 223 177 205 (−5) 223 Snow-free (date) 294 257 281 (–13) 295 257 281 (–13) 295 257 283 (–11) 299 257 283 (–11) 299 Season length (day) 283 204 248 (–35) 277 204 248 (–35) 277 200 246 (–37) 276 200 246 (–37) 276
(3) Reynolds Mountain
Peak SWE (mm) 368 105 196 (–47) 277 105 196 (–47) 277 91 168 (–54) 237 91 168 (–54) 237
Initiation (date) 35 20 50 (15) 85 20 50 (15) 85 19 49 (14) 83 19 49 (14) 83
Peak SWE (date) 161 102 129 (–33) 148 102 129 (–33) 148 96 127 (–34) 149 96 127 (–34) 149 Snow-free (date) 246 184 213 (–33) 232 184 213 (–33) 232 195 220 (–26) 236 195 220 (–26) 236 Season length (day) 211 113 161 (–50) 197 113 161 (–50) 197 129 171 (–40) 200 129 171 (–40) 200
First day of Oct Nov Dec Jan Feb Mar Apr May Jun Jul Aug Sep
Day of water year 1 32 62 93 124 152 183 213 244 274 305 336
fall ratio of 0.58) in Wolf Creek, 550 mm from 1027 mm (a rainfall ratio of 0.54) in Marmot Creek, and 473 mm from 866 mm (a rainfall ratio 0.55) in Reynolds Mountain. For all of the basins, the currently snowfall-dominated elevations, ranging between 650 and 2500 m, are expected to become more rainfall-dominated under climate change.
3.4 Snow transport and redistribution
The modeled snow redistribution due to blowing snow trans-port in and out of the basin and transtrans-port between biomes within a basin is an important component of the water bud-get that has been assessed in this study (Figs. 7, 8). Under
1CV, the annual average blowing snow transport remains unchanged in Wolf Creek, whereas it declines 14 mm (from 131 to 117 mm) in Marmot Creek and 11 mm (from 24 to 13 mm) in Reynolds Mountain (Fig. 7). Snow transport at high elevations in Marmot Creek declines 11 mm under1C
and increases 23 mm due to shorter fetches as the treeline moves upslope with concomitant vegetation change (1CV). Therefore, the impact of climate change in reducing snow redistribution from the alpine biome in Marmot Creek is al-most completely offset by vegetation change. At lower ele-vations where the treeline current exists, snow transport de-creases 56 mm under1C, likely due to higher threshold wind
speeds for transport and a shorter snow season. Snow trans-port in the valley bottom and the blowing snow sink regime in Reynolds Mountain, presently covered with a willow for-est, also decreases substantially from 79 to 37 mm (a 42 mm decrease,p value≤0.05) under climate change and defor-estation (1CV).
3.5 Sublimation
The annual sublimation from all sources, including snow in-tercepted on the canopy, snow surface, and blowing snow was examined under climate and vegetation changes and is shown in Figs. 7 and 8. Sublimation from snow inter-cepted on the canopy in Wolf Creek dominates the annual sublimation, which is expected to increase in this basin as the treeline moves upward to higher elevations. In Marmot Creek, annual sublimation increases 15 mm (Fig. 7, 119 to 134 mm) under1V but decreases 7 mm under1V C(Fig. 7, 119 to 112 mm). The impact of vegetation on sublimation rates in Reynolds Mountain is negligible, whereas climate change decreases sublimation from 31 to 10 mm. Vegetation change enhances sublimation to varying degrees in the dif-ferent biomes of the three basins. Sublimation is suppressed by increasing shrub tundra in higher elevations. However,
[image:13.612.47.553.105.398.2]Mar-4946 K. Rasouli et al.: Are vegetation and soil changes as important as climate changes?
Figure 7.Mean modeled water fluxes, in the (three) liquid, vapor, and snow states, under current climate and current vegetation (base), future climate and current vegetation (1C), current climate and future vegetation (1V), and future climate and future vegetation (1V C) in the Wolf Creek Research Basin, the Marmot Creek Research Basin, and Reynolds Mountain. Statistically significant differences in the climatological mean of the simulated variables withpvalues of less than 0.05 are represented using bold and black values.
mot Creek and Wolf Creek basins due to enhanced sublima-tion of intercepted snow. Vegetasublima-tion change does not affect sublimation in Reynolds Mountain.
3.6 Evapotranspiration (ET)
1V also alters the annual evapotranspiration (ET). The sim-ulations show that, under 1V, annual ET increases 28 mm (from 392 to 420 mm, Fig. 7) as a result of afforestation of the clearings and upward movement of the treeline in Mar-mot Creek. In contrast, ET decreases 14 mm in Wolf Creek (from 130 to 116 mm, Fig. 7) and 18 mm in Reynolds Moun-tain (from 427 to 409 mm, Fig. 7). Increases in ET due to1C
can be partially offset by concomitant vegetation change in Wolf Creek and Reynolds Mountain. ET increases the most
in Marmot Creek, from 392 to 475 mm (83 mm, p value
Figure 8.Mean modeled water fluxes, in the (three) liquid, vapor, and snow states, on an elevation/vegetation basis under current climate and current vegetation (base), current climate and future vegetation (1V), future climate and current vegetation (1C), and future climate and future vegetation (1V C) in the Wolf Creek Research Basin, the Marmot Creek Research Basin, and Reynolds Mountain. Statistically significant differences in the climatological mean of the simulated variables withpvalues of less than 0.05 are represented using bold and black values.
3.7 Runoff characteristics
1V decreases the annual runoff volume in Wolf Creek, which counteracts the increasing effect of climate change on the annual runoff volume (Table 5, Fig. 3d). Changes in soil and vegetation decrease the annual runoff volume in Marmot Creek (Table 5, Fig. 4e). With 1V C, the annual runoff volume decreases in Marmot Creek, while under com-bined climate–soil changes it increases (Table 5, Fig. 4e). This shows that a combination of all factors, vegetation, and soil changes have the largest, intermediate, and lowest ef-fects, respectively, and climate change has no effect on the annual runoff volume in Marmot Creek. In Reynolds Moun-tain, change in annual runoff is evidenced only under current climate and future vegetation (Table 5, Fig. 5e).
4948 K. Rasouli et al.: Are vegetation and soil changes as important as climate changes?
Table 5.Simulated runoff characteristics including annual volume under current and monthly perturbed climates and future vegetation in the three basins. Bold and italic values denote significant changes withpvalues of less than 0.05 and 0.1, respectively, based on a Mann–Whitney Utest. Simulated distributions withn=18 years for Wolf Creek, 9 years for Marmot Creek, and 25 years for Reynolds Mountain over the present (base case) period for each hydrological variable are compared with the simulated future distributions obtained from 11 regional climate models (11×nvalues). The percentage change, relative to the current climate/vegetation, is given in parentheses.
Change case Wolf Creek Marmot Creek Reynolds Mountain
No change Base 246 402 371
Future vegetation 1V 228–262 (−7 to+7) 336–373 (–16 to –7) 340–379 (−8 to+2)
Future soil 1S 210 (−15) 335 (–17) 331 (−11)
Future soil and vegetation 1V S 173 (–30) 411 (2) 365 (−2)
Future climate 1C 286 (16) 426 (6) 375 (1)
Future climate and vegetation 1V C 265 (8) 359 (–11) 351 (−5)
Future climate and soil 1SC 250 (2) 414 (3) 342 (−8)
Future climate, soil, and vegetation 1CV S 282 (15) 492 (22) 368 (−1)
Number of simulation years 18 9 25
Figure 9.Annual average hydrographs under present climate, present vegetation, and present soil (base); present climate, future vegetation, and present soil (1V); present climate, present vegetation, and future soil (1S); present climate, future vegetation, and future soil (1V S); future climate, present vegetation, and present soil (1C); future climate, future vegetation, and present soil (1CV); future climate, present vegetation, and future soil (1CS); and future climate, future vegetation, and future soil (1CV S) in the three basins.
46 d in Reynolds Mountain and decreased the length of the snow cover season by 9, 37, and 40 d in Wolf Creek, Mar-mot Creek, and Reynolds Mountain, respectively (Table 4).
1CV delayed the snow accumulation initiation date by 15 d in Marmot Creek and 14 d in Reynolds Mountain. The be-ginning of the melt season under1CV, measured from the
4 Discussion
The interaction of vegetation, soil, and climate changes can either result in large changes in snow and runoff regimes or they can offset the effect of one another. For instance, an in-significant increase in peak SWE in the alpine biome in Wolf Creek under 1V can become important with concomitant climate change in that it can offset the climate change ef-fect under1CV (Fig. 3a).1V decreases the annual runoff in Wolf Creek, whereas 1C counteracts the effect of veg-etation change and increases the annual runoff with 1CV
(Fig. 3d). The individual effects of soil change (1S) and climate change (1C) on annual runoff in Marmot Creek are statistically insignificant, but when they are combined (1CS), the effect of the combination is enhanced, leading to a statistically significant increase in the annual runoff vol-ume (Fig. 4e). Therefore, the increase in the annual runoff volume by climate change (1C) is offset by the vegetation change effect (1CV) in Wolf Creek, and it is enhanced by the soil change effect (1S) in Marmot Creek, whereas the effect of climate change (1C) on annual runoff in Reynolds Mountain is not significant, and vegetation change (1V) is the main driver of the runoff changes in this basin. A de-creasing effect of vegetation change on annual runoff in Mar-mot Creek is offset by a combined soil and climate change (1CV S and base are in the same group in Fig. 4e). This suggests that not only climate change but also vegetation and soil changes affect hydrological processes in cold re-gions, and small changes can trigger significant hydrologi-cal changes if changes concur. Therefore, consideration of all vegetation, soil, and climate changes in impact studies is necessary (Pielke, 2005), especially in basins with near-freezing winter air temperatures such as Reynolds Mountain, where vegetation–atmosphere interactions are complex and nonlinear and can dampen or amplify climate change (Bo-nan, 2008).
Similar to findings of Musselman et al. (2017) in the mountains of the western USA and southwestern Canada, future snowmelt rates with combined climate and vegetation change were found to be slower than the present-climate rates in Reynolds Mountain and lower elevations in Marmot Creek (Fig. 6f–k). In contrast, snowmelt rates under the combined effect of climate change and anticipated shrub expansion into alpine tundra in Wolf Creek (Fig. 6a) and upslope forest ex-pansion in Marmot Creek (Fig. 6d) remained similar to the present-climate rates. Shrub expansion into higher elevations prolongs the snow season and increases peak SWEs, coun-teracting the climate change impact on snowmelt. Therefore, relative to the base case, no change in the future snowmelt was found under vegetation and climate changes in cold and high-elevation environments. Although these snowmelt rates did not decelerate under climate change as Musselman et al. (2017) found in warmer environments, neither did they accelerate as found by Krogh and Pomeroy (2019) in a colder Arctic basin located 1000 km north of Wolf Creek.
Under combined climate and vegetation changes in Wolf Creek, the precipitation and the rainfall ratio increase (Fig. 8), peak SWE declines (Table 4), ET and sublima-tion increase (Fig. 8), and the snow season period short-ens (Table 4), which result in no change in annual total runoff (Fig. 3d). This implies that the climate change effect that increases annual runoff in Wolf Creek is offset by the vegetation change effect that decreases annual runoff, and the increased precipitation effect is offset by the increased sublimation and ET effects in this same region (Rasouli et al., 2019a). Unlike Wolf Creek, the annual runoff volume declines under combined climate and vegetation changes (1CV case) in Marmot Creek (Fig. 4e), which is due to sig-nificant decreases in sublimation and snow transport and an increase in ET (Figs. 8, 9). The response of simulated annual total runoff to climate and vegetation changes varies. An-nual runoff increases from Reynolds Mountain in the south to Wolf Creek in the north under only climate as well as climate–soil changes, consistent with the findings of Nijssen et al. (2001). Annual runoff increases with climate change in Wolf Creek (Fig. 3d) and Marmot Creek (Fig. 4e), and de-creases with only vegetation or vegetation–soil changes in all three basins, consistent with Bosch and Hewlett (1982), and with only soil changes in Wolf Creek (Fig. 3e). De-spite the snow regime in Reynolds Mountain, which is sen-sitive to both climate and vegetation changes, only vegeta-tion change affects annual total runoff (Fig. 5e). Vegetavegeta-tion change moderates the impact of climate change on ET to some extent by decreasing ET in Wolf Creek and Reynolds Mountain (Figs. 7, 8). Under a combined climate and veg-etation change, ET increases in the three basins across the North American Cordillera (Fig. 7). The response of the peak SWE to climate and vegetation changes leads to a complex response of the annual runoff when the soil and precipitation phase changes are also considered. Changes in runoff char-acteristics become statistically significant when combined climate–vegetation–soil changes (1CV S) occur in Reynolds Mountain (Fig. 5e), climate–soil changes (1CS) occur in Marmot Creek (Fig. 4e), and soil–vegetation changes (1V S) occur in Wolf Creek (Fig. 3e).
un-4950 K. Rasouli et al.: Are vegetation and soil changes as important as climate changes?
der future deforestation and climate change in Marmot Creek (Figs. 4b, 7f). This is because sublimation from blowing snow within the deforested portion of the lower elevations becomes more important than sublimation from intercepted snow on the canopy before deforestation. A higher sublima-tion rate on the slopes with no vegetasublima-tion cover has also been reported by Liston et al. (2002). Furthermore, forest regrowth delays snow ablation because of the lower net radiation un-der the canopy relative to clearings with no canopy (Gelfan et al., 2004; Ellis et al., 2010). The impact of afforestation on the snowpack in the forest clearings is stronger than that of climate change. Therefore, an enhanced snowpack decline is expected in forest clearings under climate and vegetation changes (Figs. 4c, 7g).
Sublimation losses do not only vary from one basin to an-other but vary among the different elevation bands within each basin. For instance, at high elevations in Wolf Creek, shrub tundra expansion enhances the sublimation by increas-ing the snowpack. In contrast, both snowpack and sublima-tion decrease under climate change. This shows that, in the alpine biome of Wolf Creek, the impact of vegetation change on sublimation can be as important as the impact of climate change and a combined climate and vegetation change leads to an unchanged sublimation rate. At middle elevations in Wolf Creek, which are currently covered by shrub tundra, a treeline shift into the shrub tundra biome increases sublima-tion, whereas the opposite is true under climate change when snowpack and sublimation both decrease. No changes are ex-pected in the sublimation at low elevations in Wolf Creek. Similar to Wolf Creek, the impact of a combined climate and vegetation change on sublimation in Marmot Creek varies with elevation. It causes an 8 mm decrease at high elevations as a result of the upward movement of the treeline, a 12 mm increase in the treeline blowing snow sink regime as shrubs turn to forest, and a 21 mm decrease at low elevations as forest becomes uncovered and the snowpack becomes shal-lower with warming. Different mechanisms are responsible for these changes; annual sublimation decreases in the alpine biome with the upward movement of the treeline as sublima-tion from blowing snow drops with upslope forest expansion. At middle elevations, bushes are replaced by trees and sub-limation from intercepted snow on their canopy slightly in-creases. The combination of topographic gradients and types of vegetation plays an important role in snow redistribution and blowing snow sublimation. The highest wind-driven re-distribution of snow and the highest sublimation occurs on leeward slopes, where there is little or no vegetation cover (Liston et al., 2002). At low elevations in Marmot Creek, sublimation from intercepted snow on the canopy decreases as deforestation occurs. This also occurs in the deforested zone in Reynolds Mountain where sublimation significantly decreases from 104 to 8 mm as a result of decreased available snow combined with deforestation under climate change.
Shrub tundra expansion to higher elevations (Myers-Smith and Hik, 2018), a community height increase (Bjorkman et
al., 2018), and an increase in tree growth rates (Innes, 1991) have shifted the windblown snow drifts into higher elevations (Figs. 4a, 6a), which has offset the climate warming effect on decreasing peak SWE in the alpine biome at Wolf Creek (Fig. 3a). A 20 %–60 % increase in tundra height is expected by the end of the century (Bjorkman et al., 2018), which may change snow redistribution and soil moisture availabil-ity in the higher latitudes. Despite a long snow cover period at higher elevations with shrub tundra expansion, which may slow the growth rate, snow insulates and warms the soil and increases the productivity chance, leading to more expansion of warmth-demanding vegetation types such as shrub tun-dra (Lamprecht et al., 2018). The balance of these feedbacks in the future may depend on the changes in air temperature, snow redistribution, and soil moisture, as well as their inter-actions (Lawrence and Swenson, 2011).
In different biomes in each basin, the timing of the basin-scale snow cover season was found to be insensitive to vege-tation and soil changes under present climate (Table 3). This result differs from other studies that have found snow cover to be sensitive to vegetation on the prairies (Pomeroy and Gray, 1994), in the Alps (Keller et al., 2005) and in shrub tundra (Pomeroy et al., 2006). Biomes that are insensitive in our study are located at cold, high elevations, where the snowpack is more resilient (Rasouli et al., 2019a).
The simulation results presented here consider one future-climate scenario (SRES A2) and generalized vegetation and soil changes that can be expected. The simulations compare “snapshots” in time contrasting eight steady-state conditions based upon a monthly climate perturbation that, in turn, is based upon RCM projections which have preserved the past history of observed weather in these three basins. Future weather may not necessarily resemble what has been ob-served in the past. While steady-state conditions are useful for examining the complex interactions between the effects of changes in climate, vegetation, and soil, as presented here, transient models that could capture the sequence of asyn-chronous changes in climate, vegetation, and soil, and po-tential feedback are needed to fully understand the ongoing changes in mountain watersheds.
Shifts in the timing of snow accumulation and snowmelt seasons have important consequences and can change the timing, rate, and amount of runoff in snow-dominated moun-tain basins (Callaghan et al., 2011). The simulation results presented here demonstrate that the interactions of changes in climate, vegetation, and soils are complex. Studies that con-sider the future impacts of climate change should not exclude consideration of the role of future vegetation.
5 Conclusions
semi-distributed hydrological model driven with monthly per-turbed climate based on observations and modeled changes in monthly climatology was used to explore the effects of these changes. Changes in monthly climatology were ob-tained from 11 regional climate models. Climate changes, vegetation changes, and soil changes each affect cold re-gions’ hydrological mechanisms. The effects of vegetation changes can be as large as those of climate change alone and decrease peak SWE at middle elevations, as well as sublima-tion amounts. Shrub tundra expansion to higher elevasublima-tions in Wolf Creek shifted the windblown snow drifts into higher elevations, which offset the climate warming effect on de-creasing peak SWE in the alpine biome. At high elevations, the impact of climate change on peak SWE, snow transport in Reynolds Mountain, ET, and annual total runoff is partially offset by the impact of vegetation change.
Simulations suggest that under both climate change and soil changes, annual total runoff is expected to gradually in-crease from Reynolds Mountain in the south to Wolf Creek in the north of the cordillera. With both vegetation and soil changes, annual runoff will decrease. Simulations suggest that with all three changes (climate, vegetation, and soil) annual runoff will decrease in Reynolds Mountain, and re-main unchanged in the Marmot and Wolf creeks. The annual runoff volume decrease under soil change is larger than the annual runoff volume increase under climate change in Wolf Creek. Furthermore, the soil change has a more important role than the vegetation change in decreasing runoff volume in Wolf Creek. To some extent, the interaction of soil–climate changes moderates the counteracting decreasing effect of soil change and the increasing effect of climate change on annual runoff volume. Interaction of soil–climate changes also has a more important role in increasing the annual runoff volume than the effect of climate change alone, soil change alone, or an interaction of all three soil–vegetation–climate changes in Marmot Creek. Further investigation in other mountain-ous regions, especially in regions with near-freezing winter temperatures is needed to better assess the impact of com-bined climate–vegetation–soil changes. Mountain water re-source systems that are vulnerable to warming and land cover changes can be identified using the modeling strategy pre-sented here. Future vegetation and soil changes need to be considered, in addition to a changing climate, to reduce the uncertainties regarding changing mountain hydrology.
Data availability. Long-term datasets and descriptions of the vari-ables for each basin were published by Reba et al. (2011), Fang et al. (2019), and Rasouli et al. (2018, 2019b).
Author contributions. All three coauthors contributed to the re-search design and writing the paper. KR developed the models for Wolf Creek and Marmot Creek. JWP managed and supervised the research. PHW helped with statistical analysis.
Competing interests. The authors declare that they have no conflict of interest.
Special issue statement. This article is part of the special issue “Understanding and predicting Earth system and hydrological change in cold regions”. It is not associated with a conference.
Acknowledgements. We thank Danny Marks of the United States Department of Agriculture and the late Rick Janowicz of Yukon Environment, who had a long-term commitment to operating and providing the data for Reynolds Mountain and the Wolf Creek Re-search Basin, respectively. The reRe-search funding sources include the Canada Research Chairs program, the Natural Sciences and En-gineering Research Council of Canada through Discovery Grants, the Alexander Graham Bell Canada Graduate Scholarship-Doctoral Program and Postdoctoral Fellowships, and the Changing Cold Re-gions Network. We thank Xing Fang for help with the modeling of Marmot Creek. The discussions and comments of Andrew Ireson and Lawrence Martz on an earlier draft of this paper are also ap-preciated, as are the helpful comments and suggestions of the two anonymous reviewers.
Financial support. This research has been supported by the Natu-ral Sciences and Engineering Research Council of Canada (grant nos. PDF 487795-2016 and CGSD3 – 459225-2014).
Review statement. This paper was edited by Sean Carey and re-viewed by two anonymous referees.
References
Abdi, H., and Williams, L. J.: Tukey’s honestly significant differ-ence (HSD) test, in: Encyclopedia of Research Design, edited by: Salkind, N., Sage, Thousand Oaks, CA, USA, 1–5, 2010. Alberta Natural Regions Committee: Natural Regions and
Subre-gions of Alberta, compiled by: Downing, D. J. and Petapiece, W. W., Government of Alberta Publication Number T/852, Edmon-ton, Alberta, Canada, 254 pp., 2006.
Bales, R. C., Hopmans, J. W., O’Geen, A. T., Meadows, M., Hart-sough, P. C., Kirchner, P., Hunsaker, C. T., and Beaudette, D.: Soil moisture response to snowmelt and rainfall in a Sierra Nevada mixed-conifer forest, Vadose Zone J., 10, 786–799, 2011.
Beniston, M.: Climatic change in mountain regions: a review of pos-sible impacts, in Climate variability and change in high eleva-tion regions: past, present & future, 5–31, Springer, Dordrecht, the Netherlands, https://doi.org/10.1007/978-94-015-1252-7_2, 2003.
4952 K. Rasouli et al.: Are vegetation and soil changes as important as climate changes?
Billings, W. D. and Bliss, L.: An alpine snowbank environment and its effects on vegetation, plant development, and productivity, Ecology, 40, 388–397, 1959.
Bjorkman, A. D., Myers-Smith, I. H., Elmendorf, S. C., Normand, S., Rüger, N., Beck, P. S., Blach-Overgaard, A., Blok, D., Cor-nelissen, J. H. C., Forbes, B. C., Georges, D., Goetz, S. J., Guay, K. C., Henry, G. H. R., HilleRisLambers, J., Hollister, R. D., Karger, D. N., Kattge, J., Manning, P., Prevéy, J. S., Rixen, C., Schaepman-Strub, G., Thomas, H. J. D., Vellend, M., Wilmk-ing, M., Wipf, S., Carbognani, M., Hermanutz, L., Lévesque, E., Molau, U., Petraglia, A., Soudzilovskaia, N. A., Spasojevic, M. J., Tomaselli, M., Vowles, T., Alatalo, J. M., Alexander, H. D., Anadon-Rosell, A., Angers-Blondin,S., Beest, M., Berner, L., Björk,R. G., Buchwal, A., Buras, A., Christie, K., Cooper, E. J., Dullinger, S. Elberling, B., Eskelinen, A., Frei, E. R., Grau, O., Grogan, P., Hallinger, M., Harper, K. A., Heijmans, M. M. P. D., Hudson, J., Hülber, K. Iturrate-Garcia, M., Iversen, C. M., Jaroszynska, F., Johnstone, J. F., Jørgensen, R. H., Kaarlejärvi, E., Klady, R., Kuleza, S., Kulonen, A., Lamarque, L. J., Lantz, T., Little, C. J., Speed, J. D. M., Michelsen, A., Milbau, A., Nabe-Nielsen, J., Nabe-Nielsen, S. S., Ninot, J. M., Oberbauer, S. F., Olofs-son, J., Onipchenko, V. G., Rumpf, S. B., Semenchuk, P., Shetti, R., Collier, L. S., Street, L. E., Suding, K. N., Tape, K. D., Trant, A., Treier, U. A., Tremblay, J., Tremblay, M., Venn, S., Weijers, S., Zamin, T., Boulanger-Lapointe, N., Gould, W. A., Hik, D. S., Hofgaard, A., Jónsdóttir, I. S., Jorgenson, J., Klein, J., Mag-nusson, B., Tweedie, C., Wookey, P. A., Bahn, M., Blonder, B., van Bodegom, P. M., Bond-Lamberty, B., Campetella, G., Cer-abolini, B. E. L., Chapin III, F. S., Cornwell, W. K., Craine, J., Dainese, M., de Vries, F. T., Díaz, S., Enquist, B. J., Green, W., Milla, R., Niinemets, Ü., Onoda, Y., Ordoñez, J. C., Ozinga, W. A., Penuelas, J., Poorter, H., Poschlod, P., Reich, P. B., Sandel, B., Schamp, B., Sheremetev, S., and Weiher, E.: Plant functional trait change across a warming tundra biome, Nature, 562, 57–62, https://doi.org/10.1038/s41586-018-0563-7, 2018.
Bonan, G. B.: Forests and climate change: forcings, feedbacks, and the climate benefits of forests, Science, 320, 1444–1449, 2008. Bosch, J. M. and Hewlett, J.: A review of catchment experiments
to determine the effect of vegetation changes on water yield and evapotranspiration, J. Hydrol., 55, 3–23, 1982.
Brown, A. E., Zhang, L., McMahon, T. A., Western, A. W., and Vertessy, R. A.: A review of paired catchment studies for deter-mining changes in water yield resulting from alterations in vege-tation, J. Hydrol., 310, 28–61, 2005.
Callaghan, T. V., Johansson, M., Brown, R. D., Groisman, P. Y., Labba, N., Radionov, V., Bradley, R. S., Blangy, S., Bulygina, O. N., Christensen, T. R., Coleman, J. E., Essery, R. L. H., Forbes, B. C., Forchhammer, M. C., Golubev, V. N., Honrath, R. E., Ju-day, G. P., Mehcherskaya, A. V., Phoenix, G. K., Pomeroy, J., Rautio, A., Robinson, D. A., Schmidt, N. M., Serreze, M. C., Shevchenko, V. P., Shiklomanov, A. I., Shmakin, A. B., Sköld, P., Sturm, M., Woo, M.-K., and Wood, E. F.: Multiple effects of changes in Arctic snow cover, Ambio, 40, 32–45, 2011. Crocker, R. L. and Major, J.: Soil development in relation to
vege-tation and surface age at Glacier Bay, Alaska, J. Ecol., 43, 427– 448, https://doi.org/10.2307/2257005, 1955.
Dale, V. H. and Franklin, J. F.: Potential effects of climate change on stand development in the Pacific Northwest, Can. J. Forest Res., 19, 1581–1590, 1989.
DeBano, L. F.: The effect of fire on soil properties, 10–12 April 1990, Boise, Idaho Gen. Tech. Rep. INT-280. Ogden, Utah, USA, 151–156, 1991.
DeFries, R. and Eshleman, K. N.: Land-use change and hydrologic processes: A major focus for the future, Hydrol. Process., 18, 2183–2186, 2004.
Ellis, C. R., Pomeroy, J. W., Brown, T., and MacDonald, J.: Simulation of snow accumulation and melt in needleleaf forest environments, Hydrol. Earth Syst. Sci., 14, 925–940, https://doi.org/10.5194/hess-14-925-2010, 2010.
Fang, X., Pomeroy, J. W., Ellis, C. R., MacDonald, M. K., De-Beer, C. M., and Brown, T.: Multi-variable evaluation of hy-drological model predictions for a headwater basin in the Cana-dian Rocky Mountains, Hydrol. Earth Syst. Sci., 17, 1635–1659, https://doi.org/10.5194/hess-17-1635-2013, 2013.
Fang, X., Pomeroy, J. W., DeBeer, C. M., Harder, P., and Siemens, E.: Hydrometeorological data from Marmot Creek Research Basin, Canadian Rockies, Earth Syst. Sci. Data, 11, 455–471, https://doi.org/10.5194/essd-11-455-2019, 2019.
Flerchinger, G. N., Reba, M. L., and Marks, D.: Measurement of surface energy fluxes from two rangeland sites and comparison with a multilayer canopy model, J. Hydrometeorol., 13, 1038– 1051, 2012.
Fowler, H., Blenkinsop, S., and Tebaldi, C.: Linking climate change modelling to impacts studies: recent advances in downscaling techniques for hydrological modelling, Int. J. Climatol., 27, 1547–1578, 2007.
Francis, S., Smith, S., and Janowicz, R.: Data integration and eco-logical zonation of Wolf Creek watershed, in Wolf Creek Re-search Basin–Hydrology, Ecology, Environment–Proceedings of a workshop held in Whitehorse, Yukon, edited by: Pomeroy, J. W. and Granger R. J., 93–100, Citeseer, Saskatoon, Canada, 1998. Gelfan, A. N., Pomeroy, J. W., and Kuchment, L. S.: Modeling
forest cover influences on snow accumulation, sublimation, and melt, J. Hydrometeorol., 5, 785–803, 2004.
Goodison, B., Louie, P., and Yang, D.: The WMO solid precipitation measurement intercomparison, World Meteorological Organiza-tion, Geneva, Switzerland, 65–70, 1998.
Gutmann, E., Barstad, I., Clark, M., Arnold, J., and Rasmussen, R.: The Intermediate Complexity Atmospheric Research Model (ICAR), J. Hydrometeorol., 17, 957–973, 2016.
Hallinger, M., Manthey, M., and Wilmking, M.: Establishing a missing link: warm summers and winter snow cover promote shrub expansion into alpine tundra in Scandinavia, New Phytol., 186, 890–899, 2010.
Halofsky, J. E., Peterson, D. L., and Prendeville, H. R.: Assessing vulnerabilities and adapting to climate change in northwestern US forests, Climatic Change, 146, 89–102, 2018.
Hansell, R., Chant, D., and Weintraub, J.: Changes in the northern limit of spruce at Dubawnt Lake, Northwest Territories, Arctic, 24, 233–234, 1971.
Hay, L. E., Wilby, R. L., and Leavesley, G. H.: A comparison of delta change and downscaled GCM scenarios for three moun-tainous basins in the United States, J. Am. Water Resour. Assoc., 36, 387–397, 2000.