A New Automatic Road Extraction Technique using
Gradient Operation and Skeletal Ray Formation
T Rajani Mangala
Mukesh Patel’s School of Technology,Management and Engineering, NMIMS,
Mumbai, India
S G Bhirud
Professor, Dept. of Computer Veer Jijamata Technological Institute
Mumbai, India
ABSTRACT
The usage of satellite images and extracting road from the imagery becomes very significant in the services related to road transportation such as maintenance, creation and so on. The literature has numerous works for road extraction but very less contribution is found in dealing with rural areas. In the previous work, ANN-based road extraction technique has been proposed. However to improve the performance of the technique, herewith a new road extraction technique is proposed. The proposed technique extracts the road mainly with the contribution of gradient operation and skeletal ray formation over the subjected satellite imagery. As minor operations, filtering and threshold-based processing is performed. At the end, a coloring is performed followed by a morphological operation to extract the final road from the subjected rural areas. The proposed technique is tested with different satellite images and the results are compared against the previous technique. The comparative analysis show that the proposed technique outperforms rather than the previous technique in terms of standard performance measures such as completeness, correctness and quality.
General Terms
Remote sensing, high resolution satellite images, Road network extraction,
Keywords
Satellite image, road extraction, threshold based processing, gradient, skeletal ray, dominant points, morphological operation.
1.
INTRODUCTION
Today satellite and airborne remote sensing systems can provide large volumes of data that are invaluable in monitoring Earth resources and the effects of human activities [11]. The identification of linear features by means of digital image analysis is a generic task in remote sensing [12]. Remote sensing image data typically contain an enormous amount of information [8]. Remote sensing is used to obtain information about a target or an area or a phenomenon through the analysis of certain information obtained by the remote sensor [14].
Images obtained by satellites are useful in many environmental applications such as tracking of earth resources, geographical mapping, prediction of agricultural crops, urban growth, weather, flood and fire control etc [7]. Analysis of high resolution satellite images has been an important research topic for accurate and up-to-date road network information essential for urban planning [5]. One of the major objects that can be
extracted from the images is roads that constitute an important layer of vector maps. Road extraction is so far done for highways or wide roads using high-resolution airborne images or low-resolution satellites images [9].
It is easy to identify roads in satellite images manually. But automatically extracting roads from satellite images is a difficult task [6]. Extraction of roads from digital aerial/satellite imagery is not only scientifically challenging but also of major importance for data acquisition and update of geographic information system (GIS), databases or site models and thus can be a big help in car navigation systems or any emergency (rescue) system that needs instant maps [3]. Increasing volumes of high spatial resolution satellite imagery (e.g., Ikonos, QuickBird, OrbView-3, etc.) much of which have never even been viewed has become available now [2]. Digital road information is required for a variety of applications ranging from provision of basic topographic infrastructure over transportation planning, traffic and fleet management and optimization, car navigation systems, location-based services, tourism, to web-based emergency response applications and virtual environments [1].
Road network information is required for a variety of applications. Such information is a necessary input to many decision processes. Manual extraction of road from remote sensing (RS) imagery is mostly time-consuming and costly [2]. Either no digital data is available or often very imprecise and not up to date data is available, i.e., incomplete, or even wrong, for road network in regions that consists of larger parts of desert or dry mountainous areas, e.g., northern Africa. Because of the large areas to be mapped, it is important to use highly automated means as well as cheap and readily available data [4].
Until now, a large number of road extraction approaches have been proposed and published. Road extraction methods have many different forms according to the imagery’s spatial resolution. In low-resolution imagery (i.e., ground resolution of more than 2m per pixel), roads correspond to lines, whereas at a resolution of 0.2m-0.5m they can be described as elongated homogeneous areas [10]. Tracking of road edge points in the presence of noise, is the most difficult problem in road extraction because edge points along the road are not necessarily connected in the original edge map [13].
previous work, we have proposed an ANN-based road extraction technique, however, the performance of the technique needs to be improved. Hence in this paper, a new automatic road extraction technique is proposed. To understand the prior knowledge about the works that are related with our work, a brief review is made in Section 2. Section 3 details the proposed technique with required mathematical formulations. Section 4 discusses the experimental results and Section 5 concludes the paper.
2.
LITERATURE REVIEW
A plenty of works are available in the literature, however a handful of significant works are reviewed as follows.
Jun Zhou et al. [15] have proposed a typical way to update map road layers by comparing recent aerial images with existing map data, detecting new roads and adding them as cartographic entities to the road layer. Their method could not be fully automated because computer vision algorithms have not been sufficiently robust and reliable at that time. More importantly, maps have required final checking by a human due to the legal implications of errors. They have introduced a road tracking system based on human-computer interactions (HCI) and Bayesian filtering. Bayesian filters, specifically extending Kalman filters and particle filters have been used in conjunction with human inputs to estimate road axis points and update the tracking algorithms. Experimental results have shown that their approach is efficient and reliable and produces substantial savings over the traditional manual map revision approach. The main contribution of their work has been the proposal of a general and practical system that optimizes the performance of road tracking when both human and computer resources are involved.
Xiangyun Hu et al. [16] have presented an automatic road centerline extraction from high-resolution satellite imagery and it has gained considerable interest recently due to the increasing availability of commercial high- resolution satellite images. They have proposed a hierarchical grouping strategy to automatically extract main road centerlines from high-resolution satellite imagery. Hierarchical grouping here has meant that instead of grouping all segments at once, selective segments are grouped gradually, and multiple clues are closely integrated into the procedure. By this means, the computational cost could be reduced significantly. Through the stepwise grouping, the detected fragmented line segments have eventually formed the long main road lines. Their proposed method has been tested and validated using several Ikonos and QuickBird images both in open areas and build-up urban environments. The results have demonstrated its robustness and viability on extracting salient main road centerlines.
Yan Li et al. [17] have discussed that aerial and satellite images are rich in information. They are also complex to analyze. For GIS systems, many features have required fast and reliable extraction of roads and intersections. They have studied efficient and reliable automatic extraction algorithms to address some difficult issues that are commonly seen in high resolution aerial and satellite images, yet not well addressed in existing solutions, such as blurring, broken or missing road boundaries, lack of road profiles, heavy shadows, and interference from surrounding objects. Their new scheme has been based on a new method, called reference circle, to properly identify the pixels that belong
to the same road and has used this information to recover the whole road network. That feature has been invariable to shape and direction of roads and has tolerated heavy noises and disturbances. Road extraction based on reference circles has been much more noise tolerant and flexible than the previous edge-detection based algorithms. Their scheme has been able to extract roads reliably from images with complex contents and heavy obstructions, such as high resolution aerial/satellite images available from Google maps.
Bong et al. [18] have proposed extraction of road regions based on color space elements and edge details of roads. In addition, edge detection method has been applied to further filter out the non-road regions. The extracted road regions have been validated by using a segmentation method. These results have been valuable for building road map and detecting the changes of the existing road database. Their proposed Hybrid Simple Colour Space Segmentation and Edge Detection (Hybrid SCSS-EDGE) algorithm could perform the tasks fully automatically and the user only needs to input a high-resolution satellite image and wait for the result. Moreover, their system could work on complex road network and generate the extraction result in seconds.
Anil et al. [19] have discussed that road Extraction from high resolution imagery is of fundamental importance in the context of spatial data capturing and updating for GIS applications. Their research work has been an attempt to automate the process of extracting roads from high resolution imagery. Their work has used statistical region merging for image segmentation and road network has been extracted based on contour partitioning based skeleton pruning method, where the partitions are obtained by Discrete Curve Evolution.
3.
METHOD FOR ROAD EXTRACTION
FROM SATELLITE IMAGE
Roads are identified from satellite images by performing a sequence of several operations on the extracted image. The processes performed in sequence are briefly explained in the following sections.
Initially we convert the given satellite image SI which may be either a color image or a gray scale image into a binary
image
SI
b. The value of each pixel is restricted to either 0 or 1in binary images. In a satellite image containing many small objects, the performance complexity of the image is increased
due to the presence of such objects in the
SI
b image. So weremove the small objects from the
SI
b image bymorphologically opening the binary image. This morphological process removes all the connected components lesser than a particular area.
3.1. Pre-Filtering
The filtering process is performed after the removal of small
objects from the
SI
b image. The filtering process is used forinner area and outer area objects of the
SI
b image and get the xand y coordinate values of each object. Then, the array for each object is defined as X and Y using this x and y coordinate values. For example consider that O objects, defined as O =
{
o
1,
o
2
o
N} exist in theSI
b image, where N is related tob
SI
image, then the x and y coordinates values of theo
1 objects can be represented as follows,1
X
=M
x
x
x
2 1
Y
1=M
y
y
y
2 1where, M is related to the size of the object.
These X and Y coordinate array values are determined for all the N objects. Therefore each object contains two array formats. The Gaussian convolution filtering method is applied on the x and y coordinates values of each object. After this Gaussian convolution process x and y coordinates values of the objects are given as,
f
X
1 =Mf f f
x
x
x
2 1
Y
1f =Mf f f
y
y
y
2 1Then, we identify the maximum values from the two arrays
f
X
X
1,
1 andY
1,
Y
1f and perform the division process usingthese maximum values. Suppose the maximum value of the
X
1and
X
1f array arex
5andx
1f respectively, then the division process is performed as,5
x
/x
1f =s
1xAfter that, the result of the above division process value
s
1x ismultiplied with the
X
1f array to obtain a new array result. By employing the same process, the new array result forY
1f,namely
D
1y is determinedx
D
1 =x Mf x f x f
s
x
s
x
s
x
1 1 2 1 1
= Ms s sx
x
x
2 1 yD
1 =y Mf y f y f
s
y
s
y
s
y
1 1 2 1 1
= Ms s sy
y
y
2 1The above process is performed for the x and y coordinate array
values of all objects andnew arrays
D
1x andD
1yare obtained.3.2. Applying Gradient Operation
The gradient method is used for performing smoothing process in an image and it reduces the noise in the image. In our work we propose a gradient method to perform the smoothing process.
We apply a gradient method on the
D
1x,D
1yresult of theprevious process and the same process is repeated for all objects in the result. In the smoothing process we perform the gradient operation two times. The smoothing gradient operation can be represented using the following formula,
x
d
xy
d
yx
dd
x 22
y
dd
y 2 2The gradient method is applied on the
D
1x,D
1yarrays, and theresultant arrays are represented as
d
x,d
y and once again thegradient method is applied on
d
x,d
yand the resultant arraysy x
dd
dd
,
are obtained. The result of gradient method values are applied in the following formula,Here we use
d
x,
d
yanddd
x,
dd
y values and the gradientvalues are obtained for each object using the above mentioned
formula. The result
c
1 is an array for any particular object i.e. o1 and the same result is determined for all objects.Again the Gaussian convolution filtering process is applied on
the resultant array
c
1, and the new arrayc
1fis determined.3.3. Threshold-based processing
The threshold process is performed on each object array to reduce the values from the array. Here individual arrays
contained in each object is represented as C = {
c
1f ,f
c
2 ,…c
Nf } and the inner area objects and the outer areaobjects can be clearly identified. First, we compare the outer objects array values with the threshold value (T). We consider only the values that are greater than the threshold value and the remaining values are removed from the array. Next we compare the inner objects array values with the negative threshold value (-T). We obtain the values which are less than the specified negative threshold value and eliminate the remaining values from the array. The threshold process is defined as follows,
Outer area objects
T
v > pixel valuesInner area objects
T
v < pixel valuesBy this threshold process array values of each object are reduced. The resultant array for all objects can be represented as
T= {
T
1,
T
2,
T
N }We take first value from
T
1 and get object array valuescorresponding to its position values D1x and D1y are extracted
from the arrays. Suppose the value is 5, then the 5th position
value is taken from D1x and D1y arrays, the resultant arrays of
this process are represented as T1x and T1y. The same process is
repeated for all values of the object array
T
1 and for all objectarrays present in T.
Next we process the
c
1f array and extract values fromf
c
1 array by performing the following steps(i) If the array
c
1f contain n values, compare the first andsecond value, third and second value up to last and first
value of the array
c
1f .(ii) If the first value is greater than 0, then the second value must be less than 0
(iii) Otherwise, if the first value is less than 0, then the second value must be greater than 0. We extract the
second value from the
c
1f array satisfying the aboveconditions (ii) or (iii).
(iv) The same process is repeated for all values present in the
f
c
1 array and set C, the resultant array is representedas
h
1. Then the above steps are repeated for all objectsand
H
{
h
1,
h
2
h
N} is obtained.3.4. Dominant Points and Coordinates Values
The arrays in the H set are compared with the arrays in T i.e.
h
1array is compared with the
T
1 array, and same values from thearrays are taken out and stored in array
a
1. These values are called as dominant points, and the dominant points for allobjects are represented as
A
{
a
1,
a
2
a
N}
. Next, we find the dominant coordinates values. This is performed by taking the dominant point array values from A and filtering the process result array values i.e.D1x, D1y array values. After obtaining onedominant point value from
a
1, the x and y coordinates values of the corresponding position are obtained from the D1x and D1yarrays. The x and y coordinate values are the dominant coordinate values.
3.5. Skeletal Rays Formation
The dominant coordinate values are used to draw the tangent lines by connecting coordinate values with the neighboring pixel values. The illustrated tangent lines to all coordinates values are called skeletal rays. Next we mark mid point values for two tangent lines. The mid point values are detected for all object values and all the mid point values are connected. After this process the boundary region areas in an image are identified.
3.6. Coloring
The boundary region values of all pixels are changed using 5 modulo operations and the following coloring conditions are performed on the boundary pixel values.
(i) If the modulo operation result is 1, then all red pixels in a boundary region are converted into white pixels.
(ii) If the modulo operation result is 2, then all red and green pixels in a boundary region are converted into white pixels.
(iii) If the modulo operation result is 3, then all blue pixels in a boundary region are converted into white pixels.
(iv) If the modulo operation result is 4, then all red and blue pixels in a boundary region are converted into white pixels.
The maximal color pixel values are extracted from the image and the values are put in a newly created mask. Finally morphological operation is performed on the masked pixels.
3.7. Morphological operation
In binary image each pixel is restricted to a value of either 0 or 1. Basically four types of morphological operations are performed in binary image processing. They are erosion, dilation, opening and closing. In an image each pixel in the object is displayed as black, while each pixel in the background is displayed as white. In the proposed system the closing morphological operation is performed. The closing morphological operation is a dilation followed by erosion, and the same structuring element is used for both operations. Closing method is used to join together the circles present in the image by filling the gaps between them and smoothing their outer edges. Erosion can be defined as
E
S
m SEwhere, SE is the structuring element for morphological closing
S
m is the dilated image of S.These methods are useful for manipulating noisy images where a few pixels have incorrect binary values. For example, an object might be informed to be without any holes or as having a smooth border. The above mentioned operations are performed in satellite images and finally a noise free and precise road image is obtained.
4. RESULT AND DISCUSSION
The proposed classification system was implemented in the working platform of MATLAB (version 7.10). The performance of the proposed system was evaluated using different sample satellite images of rural areas with extracted roads. The below given results are examples of one particular image. The imageries obtained by the proposed system at intermediate stages and also from diverse levels of processing are shown below.
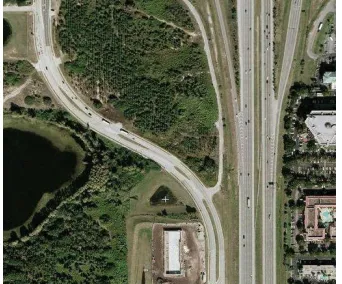
[image:5.612.373.512.154.266.2]Figure 1: Input satellite road image
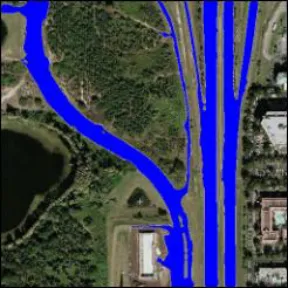
Fig. 1 shows the original satellite image that is given as input to the proposed system, after converting it into a binary image and removing the small objects that are present in it. After that the image is given as input to the filtering process for the removal of certain types of noise, and the filtering process results are shown in Fig. 2.
Figure 2: Graph representation of filtering process result
Gradient and threshold process are performed once the filtering process is over. In our proposed system, the threshold values set
for
T
v andT
v are0.02 and -0.02 respectively. The values of [image:5.612.364.509.384.512.2] [image:5.612.363.509.548.677.2]the verified dominant points and dominant coordinates are plotted in an image and the resultant image is shown in Fig. 3. Fig. 4 shows the result of the formation of the skeletal rays using tangent lines and their mid point values.
[image:5.612.86.257.554.696.2]Figure 3:Dominant points and coordinate values result
Figure 5: Coloring process result
Figure 6: Maximal color image mask result
The coloring process results are shown in Fig. 5. From the coloring process, the maximal color pixels are obtained and the pixels are put in a new mask and the results of this process are shows in Fig. 6. Fig. 7 shows images obtained from the morphological closing operation. Disk element with parameters
d
size1
is utilized for performing the [image:6.612.367.513.315.645.2]morphological closing operation. The final extracted road image results are shown in Fig. 8.
Figure 7: Closing morphological operation result
Figure 8: Final road extracted result
4.1 Performance Analysis
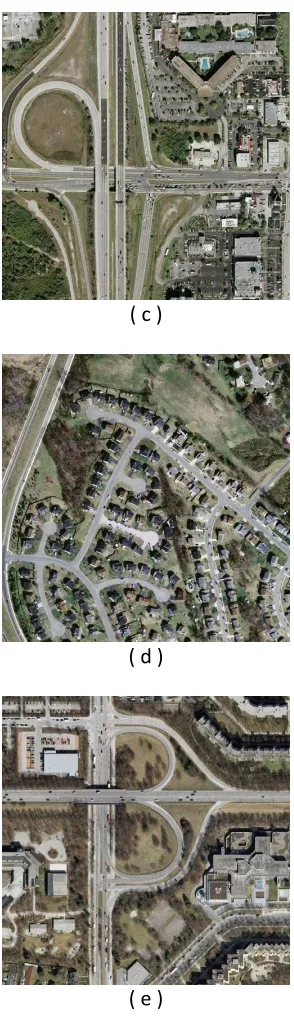
Five test images are used to measure the performance of our proposed system. The test images are shown in Fig. 9.
(a)
[image:6.612.98.242.529.676.2]( c )
( d )
( e )
Figure 9 (a – e): Test images
Table 1 shows the length of the extracted road and matched and unmatched metrics values obtained for all the five images.
Table 1: Performance Metrics of proposed five images a, b, c, d, and e
Images
Performance Metrics
Length of road extracted
Length of road extracted (matched)
Length of reference extracted
Length of road extracted (unmatched)
a 56565 53434 80005 205
b 56436 54979 83158 0
c 71187 55347 85725 2377
D 72070 55519 69581 0
E 78933 49653 60147 1347
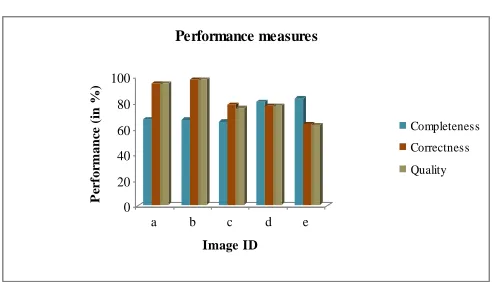
Standard quality measures like completeness, correctness and quality are used for assessing the performance of the proposed system. Table 2 gives the standard quality measures [21] such as completeness, correctness and quality obtained for the five image results. The competence of the proposed system in extracting roads from satellite imageries of rural areas is evident from Table 2 and image results.
Table 2: Performance of the proposed system in terms of standard quality measures
Images
Performance Measures (in %)
Completeness Correctness
Quality
A
66.62
94.46
94.12
B
66.11
97.42
97.42
C
64.56
77.75
75.24
d
79.79
77.03
77.03
e
82.55
62.91
61.85
[image:7.612.98.245.66.581.2] [image:7.612.311.571.99.309.2] [image:7.612.318.564.424.616.2]Figure 10: Comparison result of performance measures over the testing images
0 20 40 60 80 100
P
er
for
m
an
ce
(
in
%)
a b c d e
Image ID
Performance measures
Completeness
Correctness
Quality
Fig. 11 shows the comparative results between the proposed road extraction technique and our previous road extraction technique [20]. The proposed technique has achieved 72%, 82% and 81% completeness, correctness and quality respectively, whereas the previous work has achieved only 69%, 80% and 46% completeness, correctness and quality respectively. This indicates that the proposed technique relatively shows 2%, 2% and 35% increase in performance over the previous technique. Hence, it can be asserted that the proposed technique is effective over the previous technique especially in extracting the rural roads from satellite imagery.
Figure 11: Comparison result of our proposed system with existing method
0 10 20 30 40 50 60 70 80 90
M
ean
P
er
for
m
an
ce
(
in
%)
Completeness Correctness Quality Performance metrics
Overall performance
Proposed Existing
5. CONCLUSION
In this paper, we have proposed a road extraction technique for satellite imagery and implemented. The technique has been composed by a gradient process and the formation of skeletal rays over the roads. As minor procedures, filtering and threshold-based processing has been performed and eventually a coloring with morphological operation has been performed to extract the rural roads exactly. The technique has been implemented and compared against our previous technique, which is an ANN based technique. From the comparative results it can be visualized that the proposed technique has achieved a
remarkable performance improvement over the conventional technique. The technique outperforms in almost all of the satellite images that are subjected for road extraction. This shows that the proposed technique is effective in extracting the rural roads from the satellite image even rather than the previous technique.
6. REFERENCES
[1] Liu, Li and Chapman, "Automated Road Extraction from Satellite Imagery Using Hybrid Genetic Algorithms and Cluster Analysis", Journal of Environmental Informatics, Vol. 1, No. 2, pp. 40-47, 2003
[2] Hesamodin dehghaniana, Mohamad Javad ValadanZouja, Hamid Ebadia and Mehdi Mokhtarzadeha, "Automated Road Extraction Using Both Genetic Algorithms and Clustering Analysis from Pan-Sharpened IKONOS Images", IEEE International Geoscience & Remote Sensing Symposium, Boston, Massachusetts, U.S.A, pp. 2008
[3] Shukla, Chandrakanth, Ramachandran, "Semi-Automatic Road Extraction Algorithm for High Resolution Images Using Path Following Approach", In Proceedings of the Indian Conference on Computer Vision, Graphics and Image Processing, Ahmadabad, 2002, pp.231-236
[4] Uwe Bacher and Helmut Mayer, "Automatic Road Extraction from IRS Satellite Images in Agricultural and Desert Areas", The International Archives of the Photogrammetry, Remote Sensing and Spatial Information Sciences, Vol. 35, pp. 1055-1060, 2004
[5] Rajeswari, Gurumurthy, S.N. Omkar, J. Senthilnath and Pratap Reddy, "Automatic Extraction of Road Networks based on Normalized cuts and Mean Shift method for high resolution Satellite Imagery", International Journal of Advanced Engineering Sciences and Technologies, Vol. 3, No. 2, pp. 115 - 121, 2011
[6] Sowmya and Aashik Hameed, "Automatic Road Extraction from Satellite Image", In Proceedings of the National Conference on Communications, pp. 42-47, 2007
[7] Salem Saleh Al-amri, Kalyankar and Khamitkar, "A Comparative Study of Removal Noise from Remote Sensing Image", International Journal of Computer Science Issues, Vol.7, No.1, pp.32-36, January 2010
[8] Michael Schroder, Hubert Rehrauer, Klaus Seidel and Mihai Datcu, "Spatial Information Retrieval from Remote-Sensing Images—Part II: Gibbs–Markov Random Fields", IEEE Transactions on Geoscience and Remote Sensing, Vol. 36, No. 5, pp. 1446-1455, September 1998
[9] Hae Yeoun Lee, Heung-Kyu Lee, Tak-gon Kim and Wonkyu Park, "Towards Knowledge-Based Extraction of Roads from 1m-Resolution Satellite Images", In Proceedings of the 4th IEEE Southwest Symposium on Image Analysis and Interpretation, 2000
[image:8.612.54.288.441.589.2][11] Mirnalinee Dhinesh, Sukhendu Das and Koshy Varghese, "Automatic Curvilinear Structure detection from Satellite Images using Multiresolution GMM", International Journal of Imaging Science And Engineering, Vol. 2,No.1, pp. 154-157, January 2008
[12] Katartzis, Sahli, Pizurica and Cornelis, "A Model-Based Approach to the Automatic Extraction of Linear Features from Airborne Images", IEEE Transactions on Geoscience and Remote Sensing, Vol. 39, No. 9, pp. 2073-2079, 2001
[13] Ke Qifa, Xiao Jing, Yang Zhiyong and Songde Ma, "Energy-based Method for Road Extraction from Satellite Images", IAPR Workshop on Machine Vision Applications, Tokyo, Japan, 1996
[14] Kalaivani and Thangaraj, "An Efficient Mechanism to Predict the Stage of River using Artificial Neural Network in Satellite Images", European Journal of Scientific Research, Vol.50, No.3, pp.380-394, 2011
[15] Jun Zhou, Bichof Walter and Gaelli Terry, "Road tracking in aerial images based on human-computer interaction and Bayesian filtering", ISPRS Journal of photogrammetry and Remote Sensing, Vol.61, No.2, pp.108-124, 2006
[16] Xiangyun Hu and Vincent Tao, "Automatic Extraction of Main Road Centerlines from High Resolution Satellite
Imagery Using Hierarchical Grouping", Photogrammetric Engineering & Remote Sensing, Vol. 73, No. 9, pp. 1049-1056, 2007
[17] Yan Li and Ronald Briggs, "Automatic Extraction of Roads from High Resolution Aerial and Satellite Images with Heavy Noise", World Academy of Science, Engineering and Technology, Vol. 54, pp.416-422, 2009
[18] Bong, Lai and Joseph, "Automatic Road Network Recognition and Extraction for Urban Planning", World Academy of Science, Engineering and Technology, Vol. 53, pp.209-215, 2009
[19] Anil and NataRajan, "Automatic Road Extraction from High Resolution Imagery Based on Statistical Region Merging and Skeletonization", International Journal of Engineering Science and Technology Vol. 2, No.3, pp.165-171, 2010
[20] T Rajani Mangala and S G Bhirud, ―An Effective ANN-Based Classification System for Rural Road Extraction in Satellite Imagery‖, European Journal of Scientific Research, Vol. 47, No .4, pp.574-585, 2010