BIROn - Birkbeck Institutional Research Online
Deckert, Annika and Waudby, Christopher and Wlodarski, Tomasz and
Wentink, Anne and Wang, Xiaolin and Kirkpatrick, John and Paton, Jack
and Camilloni, C. and Kukic, P. and Dobson, C.M. and Vendruscolo, M.
and Cabrita, Lisa and Christodoulou, John (2016) Structural characterization
of the interaction of -synuclein nascent chains with the ribosomal surface
and trigger factor. Proceedings of the National Academy of Sciences of the
United States of America 113 (18), pp. 5012-5017. ISSN 0027-8424.
Downloaded from:
Usage Guidelines:
Please refer to usage guidelines at
or alternatively
Structural characterization of the interaction of
α
-synuclein nascent chains with the ribosomal
surface and trigger factor
Annika Deckerta,b, Christopher A. Waudbya,b, Tomasz Wlodarskia,b, Anne S. Wentinka,b, Xiaolin Wanga,b,
John P. Kirkpatricka,b, Jack F. S. Patona,b, Carlo Camillonic, Predrag Kukicc, Christopher M. Dobsonc, Michele Vendruscoloc, Lisa D. Cabritaa,b,1, and John Christodouloua,b,1
aInstitute of Structural and Molecular Biology, University College London, London WC1E 6BT, United Kingdom;bInstitute of Structural and Molecular
Biology, Birkbeck College, University of London, London WC1E 7HX, United Kingdom; andcDepartment of Chemistry, University of Cambridge, Cambridge
CB2 1EW, United Kingdom
Edited by Joseph D. Puglisi, Stanford University School of Medicine, Stanford, CA, and approved March 15, 2016 (received for review October 4, 2015)
The ribosome is increasingly becoming recognized as a key hub for integrating quality control processes associated with protein bio-synthesis and cotranslational folding (CTF). The molecular mecha-nisms by which these processes take place, however, remain largely unknown, in particular in the case of intrinsically disordered proteins (IDPs). To address this question, we studied at a residue-specific level the structure and dynamics of ribosome-nascent chain complexes (RNCs) ofα-synuclein (αSyn), an IDP associated with Parkinson’s dis-ease (PD). Using solution-state nuclear magnetic resonance (NMR) spectroscopy and coarse-grained molecular dynamics (MD) simula-tions, we find that, although the nascent chain (NC) has a highly disordered conformation, its N-terminal region shows resonance broadening consistent with interactions involving specific regions of the ribosome surface. We also investigated the effects of the ribosome-associated molecular chaperone trigger factor (TF) onαSyn struc-ture and dynamics using resonance broadening to define a footprint of the TF–RNC interactions. We have used these data to construct structural models that suggest specific ways by which emerging NCs can interact with the biosynthesis and quality control machinery.
NMR spectroscopy
|
ribosome|
nascent chain|
α-synuclein|
cotranslational foldingW
ithin living systems, protein biosynthesis takes place at thepeptidyl transferase center (PTC) of the ribosome, where
peptide bond formation occurs at a rate of∼20 amino acids per s (1)
to generate a nascent chain (NC) that subsequently emerges through
the exit tunnel (2), an∼100-Å passage that can accommodateca. 30
residues (3). On emerging from the tunnel, NCs can begin to explore their conformational landscapes, where about a third of cytosolic
proteins in Escherichia coli are expected to acquire native-like
structure cotranslationally (4, 5). Cotranslational folding (CTF) may, therefore, be a key process to assist NCs in adopting their native folds by minimizing the exposure of hydrophobic regions and re-ducing the risk of misfolding and aggregation (6, 7).
To ensure the production of correctly folded and functionally active proteins, further mechanisms have evolved to regulate folding pathways. Evidence indicates that the ribosome itself can modulate the folding process (8) by reducing the rate of tertiary contact formation and inhibit misfolding by stabilizing unfolded states (9). Fluorescence depolarization measurements have also shown that the dynamics of emerging NCs can be constrained (10), particularly those with a positive charge (11), owing to interactions with the negatively charged ribosome surface, which are said to create a protective environment within the crowded cell (12).
CTF processes within the cell can also be modulated by
chaper-ones (13). InE. coli,the first chaperone encountered by an emerging
NC is trigger factor (TF), which binds transiently to the ribosome via a docking site on protein L23 (14, 15), forming a cradle above the exit tunnel. It has been proposed that TF promotes CTF in several ways, including by shielding exposed hydrophobic stretches (16),
inhibiting premature folding (17), and by unfolding preexisting structures and intermediate states (8). TF binds to nontranslating
ri-bosomes with aKdofca. 1μM (18), but this affinity can be
signifi-cantly stronger in the presence of NCs [depending on their sequences (19) and lengths (20)]. TF comprises three distinct structural regions: an N-terminal ribosome-binding domain, a peptidyl-prolyl isomerase domain (PPD), and a centrally located, C-terminal substrate-binding domain (SBD). An NMR study of the interactions of free TF with the isolated, unfolded protein PhoA (21) identified four binding sites within TF, of which three are located within the SBD and one in the PPD. The regions of PhoA that interacted most strongly with these sites were found to be rich in hydrophobic and aromatic residues, in accord with the known substrate preferences of TF (19).
Although structural studies of CTF are still few, solution-state nuclear magnetic resonance (NMR) of translationally arrested NCs is emerging as a powerful means of reporting high-resolu-tion details (22–25), despite the high molecular weight (2.5 MDa) of ribosome-nascent chain complexes (RNCs) (26), with their low
working concentrations (∼10 μM) and limited lifetimes.
Further-more, computational approaches based on molecular dynamics (MD) simulations have also been developed to investigate the nature and properties of CTF (27, 28) processes, although the large size of the ribosome and relatively slow rates of protein synthesis and folding still pose major challenges for all-atom
Significance
Protein biosynthesis is carried out by ribosomes, the macromolec-ular machines present in all kingdoms of life. Aided by molecmacromolec-ular chaperones, nascent proteins can begin to fold while emerging from the ribosome. Achieving their native fold, and avoiding mis-folding, is thereby crucial for the fate of all newly synthesized proteins. The molecular details of this fundamental process, how-ever, are poorly understood. In this work we develop a combined NMR and molecular simulation approach to characterize the be-havior during biosynthesis ofα-synuclein (αSyn), an intrinsically disordered protein associated with Parkinson’s disease. The de-tailed interactions of αSyn with the ribosome surface and with trigger factor, a ribosome-associated chaperone, reveal the first steps of how a nascent chain emerges from the ribosome.
Author contributions: A.D., C.A.W., T.W., L.D.C., and J.C. designed research; A.D., C.A.W., T.W., A.S.W., X.W., J.P.K., J.F.S.P., C.C., P.K., and L.D.C. performed research; A.D., C.A.W., T.W., A.S.W., X.W., J.P.K., J.F.S.P., C.C., P.K., C.M.D., M.V., L.D.C., and J.C. analyzed data; and A.D., C.A.W., T.W., C.M.D., M.V., L.D.C., and J.C. wrote the paper.
The authors declare no conflict of interest. This article is a PNAS Direct Submission.
Freely available online through the PNAS open access option.
1To whom correspondence may be addressed. Email: [email protected] or
calculations on appropriate time scales. To circumvent this prob-lem, coarse-grained methods have been adopted to allow the in-herent properties of a system to be preserved while using a reduced molecular representation to minimize the number of elements in the simulations (29).
Here we show that combined NMR and MD studies of RNCs
ofα-synuclein (αSyn), a protein whose aggregation is associated
with Parkinson’s disease (PD), can provide insight into the conformations sampled by a disordered polypeptide chain during synthesis, complementing information emerging from studies of the CTF of globular proteins, as well as existing structural
de-scriptions of αSyn that have been obtained for the protein in
isolation (30) and within cells (31, 32).
Results
αSyn Is Disordered on the Ribosome.αSyn RNCs, translationally
arrested using the SecM motif (33), were generated inE. coli(Fig.
1A), and the samples were purified based on our previous method
(34), with the removal of the N-terminal His(H6)-tag using
to-bacco etch virus (TEV) protease (Fig. S1AandB). The1H-15N
selective optimized flip-angle short transient heteronuclear mul-tiple quantum coherence (SOFAST-HMQC) (35) spectra with nonuniform weighted sampling sensitivity enhancement (36) were acquired (Fig. 1B) alongside biochemical analyses (37) (Fig. 1F
andFig. S1C–F) and15N-heteronuclear stimulated echo (XSTE)
diffusion measurements (38) (Fig. S1G–I) to monitor the integrity
of the RNC, which showed that the NC was attached and that the
samples remained essentially completely stable for∼72h.
The1H-15N NMR correlation spectrum of theαSyn RNC (Fig.
1B) shows a narrow range (8.0–8.8 ppm) of amide proton chemical shifts (CS) characteristic of an intrinsically disordered protein (IDP) and overlays closely with a matching spectrum of isolated
αSyn (Fig. S2B) in the presence of an equimolar concentration of
70S (Fig. 1CandD). CS differences were uniformly small (ΔδNH
<0.05ppm,Fig. S3A), indicating that the NC samples a range of
disordered state conformations similar to isolated αSyn, which
allowed the transfer of cross-peak assignments to that of the RNC (Fig. 1B). Owing to line broadening and overlap in the RNC
spectrum, 63 αSyn resonances, from M5-D135, were resolved
sufficiently to enable their intensities to be analyzed. Critically, the
observation of the D135 resonance (Fig. 1BandE), located just 28
residues from the PTC, indicates that the NC possesses extensive mobility near the opening of the exit tunnel.
Resonance Broadening Indicates Interactions of αSyn with the
Ribosome Surface. In contrast to the minimal CS perturbations
observed in the NC, large reductions in the intensities of NC
res-onances were observed relative to those of isolatedαSyn (Fig. 1D
andE). This effect provides a sensitive probe of the changes in NC dynamics associated with the gain in mobility of the polypeptide chain as it emerges from the exit tunnel, and with the loss of mobility arising from interactions with the ribosome surface.
The intensities of cross-peaks in the RNC spectrum were reduced
by>87% relative to isolatedαSyn in the presence of ribosomes, with
substantial variation across the sequence (Fig. 1E). The C-terminal resonances were highly broadened, but from residue D135–K58 resonances were generally observed to become narrower (and hence more intense), indicating that the NC mobility is increased as residues become more distant from the exit tunnel. However, from K58 to the N terminus this trend is reversed as resonances are progressively broadened, resulting in decreased intensities. These results indicate an increasing propensity of this region to interact with the ribosome surface, which seems to be correlated with a high density of positively charged residues. In contrast, the negatively charged C-terminal re-gion remains observable, despite its increased proximity to the ribo-some surface. In addition to these long-range trends, two clusters of residues, M5–S9 and V37–V40, were broadened beyond detection, whereas intensities in a third region centered around T92/G93 were attenuated to a lesser extent. These clusters seem to be associated with the aromatic residues F4, Y39, and F94, rather than generally
with hydrophobicity because the most hydrophobic region of the sequence, N65–T75, is also the region of greatest intensity.
For comparison, we also examined changes in the intensity of
isolatedαSyn in the presence of ribosomes. Reductions in intensity
of up to 60–70% were observed for N-terminal residues (M5, L8,
and S9), without any perturbations to the C-terminal region (Fig.
S2C). This broadening of N-terminal resonances is comparable to
that observed in theαSyn RNC, suggesting that similar interactions
occur with the ribosomal surface in both cases, although the effect is substantially weaker in the absence of the covalent tethering in the
RNC. Further analyses of charged isolatedαSyn variants suggested
that the polypeptide–70S interactions are at least in part due to
electrostatic interactions (Fig. S4).
To probe the dynamics of the NC in more detail,1H linewidths
were measured in spectra of the RNC and isolatedαSyn (Fig. 2A
andFig. S3B). RNC resonances were found to have significantly
broader linewidths (and hence larger R2relaxation rates) than
those in isolated αSyn, with an increase inR2 from 37± 7 s–1
(mean±SD) for the isolated protein to 109±38 s–1in the RNC
(Fig. 2B). To determine the significance of such values, we
es-timated the R2values that might be expected for a NC
immo-bilized by tight binding to the ribosome surface. The 1H-1H
dipolar interactions were calculated using an ensemble model of
the αSyn RNC (discussed in Structural modeling of the αSyn
8.8 8.4 8.0
129 125 120 115 110 15
N chemical shift/ppm
8.8 8.4 8.0
1H chemical shift/ppm 8.8 8.4 8.0
B
C
D
SecM Amphipathic region NAC Acidic tail
1 61 95 140
A
kDa 20 30 40 50 70S RNCtRNA bound NC
released NC RNC+RNase A
F
G86 G31 G68 G67 G73 G84 G41 T92 T54 T59 N103 Q109 A53 A89 V71 E83 H50 T81 T64 T72 T75 S129 V74 A69 A107 D135 K96 E130 E110 L8 M5 A29 T44 V82 K60 A76 V77 A85 A90 G93 Q99 L100 G101 G111 E104 D119 S9 D121 V48 V37 K21 V95 E126 V40 L38 G51 K58 K80 V63 N65 N122 A124 R R R R R R R R RE
Residue IRNC /Iα Syn+70S αSyn αSyn+70SαSyn RNC αSyn RNC(x10)αSyn+70S
120 160
0 0.05 0.1 0.15
0 40 80
PTC
-3 146 163
60
20 100 140
Amphipathic region NAC Acidic tail SecM
0 2 -2
[image:3.585.300.542.51.352.2]Hydropathy
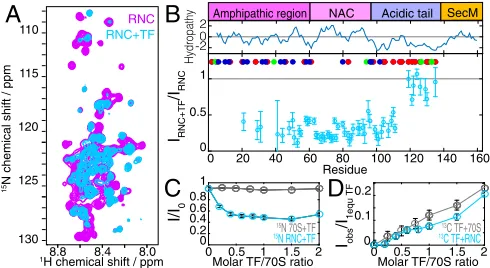
Fig. 1. NMR characterization of theαSyn RNC. (A) Schematic of theαSyn RNC construct. (B) The1H-15N SOFAST-HMQC spectrum of theαSyn RNC and
resonance assignments; R indicates 70S background peaks. (C) Comparison of1H-15N SOFAST-HMQC spectra of isolatedαSyn with and without 1 mol eq
of ribosomes. (D) Comparison of theαSyn RNC spectrum inBwithαSyn in the presence of 70S inC; RNC intensities amplified. (E) Cross-peak intensities in theαSyn RNC relative to isolatedαSyn in the presence of ribosomes; the gray-shaded area depicts the approximate length of the exit tunnel. A Kyte and Doolittle hydropathy plot and an amino acid classification of theαSyn protein sequence in positively charged (blue), negatively charged (red), and aromatic (green) residues is also shown. (F) Anti-SecM Western blot to probe for RNC integrity, showing tRNA-bound (∼40 kDa) and releasedαSyn NCs (∼20 kDa).
Deckert et al. PNAS | May 3, 2016 | vol. 113 | no. 18 | 5013
RNC), taking the rotational correlation time of the ribosome to
be 3.9μs at 277 K (39), from which we estimate the amide proton
relaxation rates of the bound state to be 16.1±4.4×10³s–1(Fig.
S3C). Using this estimate, and making the assumption that NC
resonances are in fast exchange between free and ribosome-asso-ciated states, as is typically the case for weak interactions, the ob-served relaxation rates will be a population-weighted average of the free and bound states (24). Thus, using the observed linewidths of residues between V48 and A124 (Fig. 2B), the estimated
pop-ulation of this NC segment bound to the ribosome surface is 0.45±
0.24% (Fig. S3D). Although this number could be increased if the
bound state were to be significantly mobile (Fig. 2C), this analysis nevertheless indicates that these interactions are of a weak and transient nature. It is likely that interactions with the ribosome surface for other segments of the NC, whose resonances are more severely broadened and so cannot be observed (Fig. 1E), could be considerably stronger.
NMR Analysis of TF–NC Interactions.To examine the impact of a
ribosome-associated chaperone on the behavior of theαSyn NC,
[2H,13CH3-ILV]-labeled TF was titrated into a 15N-labeled
sample of theαSyn RNC. Although ribosome-boundαSyn has
been shown to be a weak substrate for TF (40, 41), TF itself has a
moderate affinity for nontranslating 70S ribosomes [Kd∼1μM
(18)]. This combination of affinities was important in allowing saturation of the NC–TF interaction without the complication of strong NC binding causing substantial line broadening. We found that the addition of 1 mol eq of TF induced only small amide CS
perturbations (ΔδNH<0.06 ppm; Fig. 3Aand Fig. S5A),
indi-cating that the NC samples a similar distribution of disordered conformations as it does in the absence of TF. We observed, however, large and nonuniform reductions in the intensities of
theαSyn cross-peaks (Fig. 3B), which enabled the nature of the
TF–NC interaction to be analyzed. The intensities of residues
K21–G111 in the RNC spectrum were reduced to 30± 8% of
those observed in the absence of TF, whereas resonances of residues D119–D135 in the C-terminal region were less strongly
perturbed, with relative intensities reduced only to 88 ± 12%
(Fig. 3B). No effects on the resonances of residues N-terminal to K21 could be determined, because these resonances are already broadened beyond detection in the absence of TF (Fig. 1E). The addition of TF concentrations higher than 1 mol eq caused no further intensity changes in the RNC spectrum, indicating that, although the TF–NC interaction may be weak, the TF–70S in-teraction itself had reached saturation (Fig. 3C).
Analysis of the1H,13C spectrum of TF showed that methyl
res-onances experienced large reductions in intensity in the presence of
ribosomes (approximately sixfold relative to isolated TF;Fig. S5D),
but little additional broadening was observed in the presence of the
αSyn NC (Fig. 3D), which is consistent with previous
observa-tions using fluorescence techniques that showed no increased
recruitment of TF to ribosomes carrying anαSyn NC (41). For
comparison, we examined changes in the spectrum of isolatedαSyn
in the presence of 1 mol eq of TF. At concentrations of 5μM only
small intensity changes (<5%) were observed, in residues located
at the N terminus ofαSyn. However, additional line broadening
was evident at higher concentrations (100μM), or in the presence
of ribosomes (which promote the dissociation of the TF dimer)
(Fig. S5C). Thus, althoughαSyn is indeed a weak TF substrate
there is nevertheless some propensity to interact, and this may be promoted by the ribosome and, particularly, by the colocalization of TF and the NC during translation.
Structural Modeling of theαSyn RNC.Coarse-grained simulations
of theαSyn RNC were used to develop a model with which to
explore the structure and dynamics of the NC and to investigate potential sources of the NMR resonance broadenings observed. Here, we used the CamTube force field (42), in which the polypeptide chain is represented as a flexible tube as a means of describing its overall architecture. This approach increases the efficiency of sampling protein conformations relative to all-atom simulations, making it particularly effective for the study of large and flexible systems such as RNCs. Starting structures for the simulations were constructed from cryo-EM models of SecM-stalled translating ribosomes, where the 17-residue arrest se-quence has an extended conformation in the exit tunnel (43), and structural ensembles for the NC were then generated from a
2.4-μs trajectory (Fig. 4AandMovie S1). From this ensemble, we
found that the first NC residue to be located in the exit vestibule was D135, 28 residues (78 Å) from the PTC. Critically, this point coincides with the experimental observation of NC resonances, and the subsequent increase in intensity from D135 toward the N terminus (Fig. 1E). To estimate the rotational mobility of each residue within the NC, the structural ensemble was used to
cal-culate S2 order parameters, where a value of 1 describes rigid
residues and a value of 0 describes fully flexible residues. We found that the observed increase in NMR intensities from D135– E104 (Fig. 1E) was associated with a decrease by two orders of
magnitude in the calculated amideS2values (Fig. 4C), as well as a
large increase in mobility as described by the Cαroot mean square
fluctuations (RMSF) (Fig. 4D). However, both parameters also 8
8.4
8.8 00 100 200
5 10 15
frequency
1H chemical shift / ppm
x 20
G67 T92
A
B
αSynαSyn RNC
1-pbound
pbound= bound NC population
C
i S2 ,locally rigid
i 1-S2, locally flexible
i i i
αSyn
αSyn RNC
R2 (
[image:4.585.45.288.52.124.2]1H linewidth)/s-1
Fig. 2. The1H linewidth analysis of theαSyn RNC. (A) The1H cross-sections
through1H-15N SOFAST-HMQC spectra (δ
N113.15 ppm, Fig. 1B, dashed line)
of isolatedαSyn and theαSyn RNC fitted to a sum of Lorentzian functions (solid lines) to determine1HR2rates. (B) Distribution ofR2values obtained
from lineshape fitting of residues selected from V48–A124 for isolatedαSyn (34 residues) and theαSyn RNC (31 residues). (C) Schematic depicting the exchange of the NC between its free and ribosome-associated states. The globally bound state consists of a population-weighted average of a locally flexible state, where residueiis highly dynamic but in close proximity to residues tethered nearby, and a locally rigid state with residueibeing in direct contact with the ribosome surface. The relative proportions of these states are described by the generalized order parameter,S2.
B
8.8 8.4 8.0
130 125 120 115 110
15
N chemical shift / ppm
1H chemical shift / ppm
A
RNCRNC+TF
0 0.2 0.4 0.6 0.8 1
Iobs
/I1equ TF0.1 0.2
0 0.5 1 1.5 2 00 0.5 1 1.5 2
Molar TF/70S ratio Molar TF/70S ratio 0
0.5 1
100 120 140 160 20
0 40 60 80
C
D
IRNC+TF
/IRNC
I/I0
Residue
15N 70S+TF
15N RNC+TF
13C TF+70S
13C TF+RNC Amphipathic region NAC Acidic tail SecM
0 2 -2
Hydropathy
Fig. 3. NMR analysis of the interaction of TF withαSyn RNCs. (A) Comparison of1H-15N SOFAST-HMQC spectra of theαSyn RNC with and without 1 mol eq
TF. (B) Relative cross-peak intensities of theαSyn RNC following addition of TF. A Kyte and Doolittle hydropathy plot and an amino acid classification of the
αSyn protein sequence in positively charged (blue), negatively charged (red), and aromatic (green) residues is shown. (C) Changes in the integrals of15
N-edited1H amide envelopes of theαSyn RNC and15N-labeled 70S ribosomes with
increasing TF. (D) Changes in the integrals of13C-edited1H methyl envelopes
[image:4.585.302.547.480.614.2]predict a continued gain in mobility for residues more distant from the PTC, whereas the NMR data showed reduced peak intensities for residues in the vicinity of T92/G93 and for the N-terminal region (M5–V40) (Fig. 1E). We thus conclude that the observed perturbations in NMR peak intensity are the likely consequence of a combination of electrostatic effects induced by positively charged residues in the N terminus and interactions with aromatic residues (F4/Y39/F94).
The simulations were repeated in the presence of ribosome-bound TF, using a starting structure based on an NMR model of TF in complex with the disordered state of PhoA (21) (Fig. 4B
andMovie S2). We observed that theαSyn residues K21–G111,
which experienced the strongest reduction in resonance
inten-sities on TF binding (∼70%) (Fig. 3B), were able to contact
proposed substrate binding sites in TF previously identified in the absence of the ribosome (21). Conversely, we found that the C-terminal residues D119–D135, which were only marginally
broadened (∼12%) upon TF binding, were not able to contact
sites within TF. Interestingly, reductions in CαRMSF values and
S2 order parameters were observed in the presence of TF for
residues between E126 and the N terminus (Fig. 4C and D).
However, no TF-induced perturbations in NMR signal intensities were observed experimentally in the vicinity of E126 (Fig. 3B), suggesting that TF interactions do not occur within this region. Thus, whereas our modeling suggests that a restriction in mobility could be experienced from residues from E126, the NMR data show that interactions of the NC and TF seem only to occur from residues G111, presumably when these can begin to reach and interact with the TF cradle (Fig. 4B).
[image:5.585.297.541.54.343.2]Using the simulated RNC structures we identified ribosomal proteins accessible to the NC and also mapped the changes in NC accessibility of the ribosome surface that occur upon TF binding.
Fig. 4Eillustrates the accessibility of the ribosome surface for the
NC, which was calculated as the distance of closest approach be-tween the backbone atoms of the NC and atoms of the 70S surface. Regions close to the exit tunnel, which are within 10 Å of the NC (in red), include the ribosomal proteins L17, L22, and L32, which are important binding sites for protein biogenesis factors (44) such as peptide deformylase and methionine aminopeptidase, as well as L23, L24, L29, L32, and rRNA. Upon binding of TF, the NC formed additional contacts with the chaperone at the expense of other regions of the ribosome surface, which became sterically
occluded (Fig. 4F). Fig. 4Gindicates the changes of the NC surface
accessibility in the presence and absence of TF (compare Fig. 4E
andF). Regions corresponding to the ribosomal proteins L3, L17, L19, L22, and L32 (blue) became inaccessible upon binding of TF but as a consequence other regions (in red), including L4 and L28 as well as parts of L9 and L24, were sampled more often by the NC (Fig. 4H).
Discussion
We have used high-resolution solution NMR and coarse-grained MD to characterize the structure, dynamics, and interactions of
αSyn NCs during biosynthesis on the ribosome. The limited
solubility of RNC samples together with the observed NMR line broadening resulted in very weak signal intensities, equivalent to
just 50–100 nM concentrations of isolatedαSyn. Nevertheless, a
combination of methodological advances, including longitudinal relaxation optimized experiments and nonuniform weighted sampling (35, 36), have enabled quantitative measurements to be made of CSs and cross-peak intensities for the majority of NC residues. Most importantly, a combination of biochemical and noninvasive spectroscopic assays were applied to ensure that all NMR signals analyzed in this study arise from intact,
ribosome-bound NCs (Fig. 1FandFig. S1DandF–I).
Previous RNC structural studies have focused almost exclusively on examining folding competent globular proteins such as FLN5 (22, 25), SH3 (24) domains, and barnase (23). In contrast to folded states, which correspond to deep minima in free energy land-scapes, IDPs have relatively flat free energy landscapes (45) that are highly sensitive to external perturbations [e.g., from
mutations (46), posttranslational modifications (47), or from the intracellular environment (48)]. The investigation of IDPs there-fore allows a detailed exploration of the accessible conformational space for a polypeptide chain, without complications of folding.
NMR CSs are typically sensitive probes of protein structure, yet
we found thatαSyn amide CS perturbations resulting from
ribo-somal attachment, or from the presence of TF, were extremely
small (Figs. S3AandS5AandB). By contrast, the intensities of
cross-peaks in spectra of the RNC were highly variable relative to
isolatedαSyn (Fig. 1DandE). The tethered motion of the NC
inevitably affects NMR linewidths, given the thousand-fold differ-ence in the effective rotational correlation times of the ribosome
and of isolated αSyn. Residues will therefore generally gain
in-dependent mobility as they become more distant from the PTC and emerge from the exit tunnel. In this study, the residue closest in sequence to the PTC to be NMR-detectable was D135, from which point resonance intensities increased to a maximum at K58 (Fig. 1E). Our structural modeling indicated that the position of D135, 28 residues from the PTC, coincides with the emergence of the NC from the constricted tunnel into the exit port (Fig. 4A). The
B
C
D
< 6 10 20 Å
E
F
> 25
L28
A
C
α
RMSF [nm]
120 160
80 40 0
Residue
2400 0 400 800 1200 1600 2000
G
H
1.0 0.5 0
0 2 4 6 8
TF exit
tunnel
IRNC+TF/IRNC
S
10-4 10-3 10-2 10-1 1.0
120 160
80 40 0
Residue
+TF -TF +TF
-TF
simulation length / ns
110 115 120 125 130 135 140 110 115 120 125 130 135 140 1
2
140
C
α
RMSF [nm]
Residue
0.0
S
2
10-4 10-3 10-2
Residue D135 0.1 0.05 0
IRNC/IαSyn+70S
L22
L23 L24
L17 L32 L22 L24
L4
L9
2
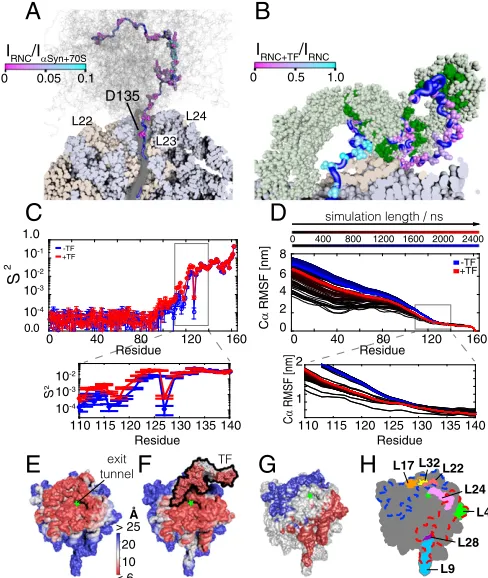
Fig. 4. Structural modeling of theαSyn RNC. (A) Cross-section of the simulated
αSyn RNC showing the NC ensemble (gray) with a representative NC structure highlighted (blue), ribosomal proteins (beige), and RNA (blue-gray). Observed NMR resonances (relative to isolatedαSyn in the presence of 70S , Fig. 1E) are shown as spheres colored according to their relative intensity (Fig. 1E). (B)αSyn RNC model with TF monomer (light green) and substrate binding pockets (21) (dark green); the observed NC resonances are shown as spheres colored according to the relative intensity in Fig. 3B. For clarity, residues 1–31 are not shown. (C) AmideS2order
parameters determined from simulated ensembles with and without TF. (D) Cα RMSF of theαSyn RNC calculated over increasing lengths of the simulation tra-jectory, with and without TF. (E) Ribosome surface colored according to the dis-tance of closest approach of the simulated NCs and (F) ribosome and TF surfaces colored as described inE. (G) Difference in ribosome surface accessibility (distance of closest approach) on TF binding. Blue regions become sterically restricted, whereas red regions represent parts of the ribosome surface that are more fre-quently contacted by the NC due to the steric restrictions imposed by TF on other parts of the ribosome surface. (H) Schematic diagram of ribosomal proteins in close proximity to the exit tunnel; ribosome orientation as inE–G.
Deckert et al. PNAS | May 3, 2016 | vol. 113 | no. 18 | 5015
BIOPHYSIC
S
AND
COMPUTAT
IONAL
detection of these resonances therefore demonstrates the potential to structurally dissect the behavior of NCs that are close to, and potentially even within, the exit vestibule.
Further from the PTC, from residues K58–M5, our simulations indicate that the mobility of each residue continues to increase
(Fig. 4CandD). We observed, however, that the intensities of NC
resonances in this region were significantly less than those of res-idues closer to the PTC. In particular, clusters of resonances in the N-terminal region, encompassing M5–S9 and V37–V40, were broadened beyond detection as well as resonances around T92/
G93, which showed a significant (∼97%) attenuation in NMR
signal (Fig. 1E), indicating the existence of interactions between the NC and the ribosome surface. Interestingly, the line broadening observed in the N-terminal region of the RNC was also observed
for isolated αSyn in the presence of ribosomes (Fig. S2C),
sug-gesting a similar mode of interaction, although substantially weaker
in the absence of a covalent link to the ribosome (Fig. S4F). Such
interactions have previously been observed for RNCs, by NMR for FLN5 (22, 25) and SH3 (24), by fluorescence methods for the IDP PIR (11), and by optical force spectroscopy for T4 lysozyme (9). In the latter two cases, interactions were driven at least partially by the high negative charge density of the ribosome surface, and modu-lations of the electrostatic environment by ionic strength (9) or differently charged variants of the NC (11) were shown to perturb the binding interaction. In the present study, the large number of resolved NC resonances provided us with the ability to unravel sequence determinants of these interactions, from the
identifica-tion ofαSyn residues interacting with the ribosome surface. We
conclude that the net positive charge of the N-terminal region
(resulting from the αSyn KTKEGV repeat motif) induces
elec-trostatic interactions with the ribosome surface, which in isolation
are reduced in the reverse-charged K6–60EαSyn variant, in which
positive charges are eliminated, or increased in the more positively
charged H6-taggedαSyn (Fig. S4). We also observed that
interac-tions of the clusters around M5–S9, V37–V40, and T92–G93 are associated with the aromatic residues F4, Y39, and F94 (Fig. 1E). As the interaction pattern does not appear to correlate with the
known region of hydrophobicity withinαSyn (Fig. 1E), this would
indicate that there may be a specific affinity of the ribosome sur-face for aromatic residues. Interestingly, similar patterns of NMR
line broadening have been observed forαSyn within bacterial (32)
and mammalian cells (49), which suggests that there may be a common role for charged and aromatic residues in governing protein interactions both with the ribosome surface and with other components of the cellular milieu.
NMR intensity analysis provides a sensitive and high-resolution probe of ribosome surface interactions, but due to the interplay of
1H and15N relaxation processes their quantitative interpretation in
terms of NC dynamics is not currently possible. We therefore also
measured1H linewidths for 31 NC residues from V48–A124, to
provide a quantitative estimate of ribosome binding (Fig. 2 andFig.
S3 B–D). Relaxation rates for the bound state of the NC were
evaluated using an ensemble model of the RNC in which the correlation time of the NC was set equal to that of the ribosome
(Fig. S3C), and on this basis we determined an average bound state
population of 0.45±0.25% for residues in this segment of the NC
(Fig. S3D). Although this interaction is rather weak, residues that
were unobservable by NMR (M5–S9 and V37–V40) are likely to be interacting more strongly with the ribosome surface. Moreover, because the bound state may represent a set of interconverting states rather than a single rigid conformation, the collective effect of many weak interactions means that the total population of the NC in association with the surface at any given instant may be substantially greater than 0.45% (Fig. 2C).
Finally, we have reported residue-specific details of the in-teraction of the ribosome-associated chaperone TF with a NC.
Intensity reductions of∼70% were observed for residues K21–
G111 of the αSyn RNC in the presence of TF. Although this
region spans the net positively charged N-terminal region (K21– E61), the hydrophobic NAC region (Q62–V95), and part of the negatively charged C-terminal region (K96–G111), the observed
broadening was found to be approximately uniform and hence in-dependent of the previously identified preferences of TF for basic and hydrophobic substrates (19, 21). Instead, our structural modeling indicates that the observed broadening can be better correlated with those residues able to reach the TF cradle and its associated binding sites (21) (Fig. 4B). These NMR data indicate that 52 residues are necessary from the PTC to initiate an interaction with TF, with G111 being the first residue to be significantly perturbed in intensity. Cross-linking studies (50) as well as theoretical calculations based on the crystal structure of ribosome-bound TF (15) have found similar minimum lengths to be necessary for NC–TF contact formation (47 and 43 residues, respectively). The results described here add resi-due-specific detail to these previous findings, confirming that NC lengths of about 50 residues are required to initiate interactions with TF.
In summary, this study begins to describe the structural and dy-namic characteristics of disordered NCs during biosynthesis by
examining the behavior ofαSyn, an IDP associated with PD and
related neurodegenerative conditions. BecauseαSyn is free from
competition with CTF processes encountered by globular proteins, this study provides an insight into the earliest events experienced by emerging NCs, before the onset of CTF. The results show that the
disordered structural ensemble ofαSyn is not strongly perturbed
when tethered to the ribosome, although with the sensitivity of the NMR measurements it was possible to identify and characterize very weak interactions of the NC with ribosomal proteins near the exit tunnel. Such interactions, mediated by charge and aromatic residues, are also likely to be determining factors that affect CTF of globular proteins, particularly because the ribosome is associated with having a direct chaperoning capacity (8, 9). Furthermore,
al-thoughαSyn is a weak TF substrate, we could show that TF
in-teracts with the N-terminal ∼110 αSyn residues, including the
positively charged N-terminal region, the hydrophobic NAC region, as well as, unexpectedly, residues of the negatively charged C-terminal region. This study shows that even weak substrates, including residues not known to bind TF, are affected by the presence of the chaperone, indicating that an interplay exists be-tween the surface of the ribosome and that of the TF cradle upon the immediate exit of a NC from the ribosome. These observations have implications for understanding the CTF process, because the folding of a NC may not only be assisted by interactions with the ribosome surface, but also by the extent of TF involvement, resulting in a complex folding landscape. Such interactions could thus have a protective role for emerging NCs, particularly those likely to possess substantial regions of disorder, by preventing cotranslational mis-folding induced by nonnative intra- or intermolecular interactions during biosynthesis (51).
Materials and Methods
Detailed materials and methods are given inSI Materials and Methods.
Preparation ofαSyn RNCs.TheαSyn gene was cloned into a pLDC-17 vector
(34) and site-directed mutagenesis was used to introduce a TEV protease cleavage sequence between the N-terminal H6-tag andαSyn. Uniformly 15
N-labeled RNCs were expressed inE. coliand purified as described pre-viously (34). TEV protease was used to cleave the H6-tag from the RNCs
following nickel affinity chromatography.
Preparation of TF.Isotopically labeled TF, including selective protonation of
Ile, Leu, and Val methyl side chains, was produced inE. coliaccording to standard procedures.
Detection of RNCs.RNC samples collected during purification or NMR acquisition
were run on Bis-Tris polyacrylamide gels (pH 5.8) before Western blot. Polyclonal rat anti-αSyn (epitope residue 15–123) (BD Laboratories) and polyclonal rabbit anti-SecM (epitope SecM motif) antibodies were used to detect the NC.
NMR Spectroscopy.NMR data were acquired at 4 °C on a 700-MHz Bruker
Avance III spectrometer with TXI cryoprobe. The1H-15N SOFAST-HMQC (35)
spectra were recorded using nonuniform weighted sampling (36).15N-XSTE
diffusion delay of 100 ms and bipolar trapezoidal gradient pulses (total length, 4 ms; shape factor, 0.9) with strengths of 0.028 and 0.532 Tm−1.
Coarse-Grained MD Simulations of theαSyn RNC.An atomic model of a stalled
NC on the ribosome was derived from cryoEM data (43) by molecular-dynamics flexible fitting (52). To produce anαSyn RNC starting model, the original NC sequence in the model was replaced and extended to the sequence of the
αSyn RNC using Swiss-PDB Viewer. TF bound to the ribosome was modeled based on the cryoEM data of the ribosome–TF complex (50) and the structure of TF (14, 15). Simulations of theαSyn RNC were performed in Gromacs (53) using a version of the tube model (42), known as the CamTube force field using a 2.4-μs trajectory. The NC mobility for each residue was calculated as the RMSF from the average position of the CA atoms within the trajectory and amideS2generalized
order parameters were calculated from an ensemble of 8,000 all-atom structures.
ACKNOWLEDGMENTS. We thank B. Bukau (Ruprecht-Karls-University) for the anti-SecM antibody and J. Gumbart (Georgia Institute of Technology) and K. Schulten (University of Illinois) for providing the stalled ribosome-starting structure. J.C. acknowledges the use of the Biomolecular NMR Facility, University College London, and thanks T. Frenkiel and G. Kelly of the Medical Research Council Biomedical NMR Centre at the Crick Institute, London for the use of the facility. J.C. and T.W. acknowledge the use of the Advanced Research Computing High End Resource (ARCHER) UK National supercomputing service (www.archer.ac.uk/). L.D.C. is supported by the Wellcome Trust and by an Alpha-1 Foundation grant. T.W. is supported as a European Molecular Biology Organization Long-Term Fellow and is also supported by the Wellcome Trust. A.D. is supported by the Motor Neurone Disease Association. The work of C.M.D and M.V. is supported by a Wellcome Trust Programme Grant (094425/Z/10/Z to C.M.D. and M.V.). This work was supported by a Biotechnology and Biochem-ical Sciences Research Council New Investigators Award (BBG0156511 to J.C.) and a Wellcome Trust Investigator Award (097806/Z/11/Z to J.C.).
1. Liang ST, Xu YC, Dennis P, Bremer H (2000) mRNA composition and control of bac-terial gene expression.J Bacteriol182(11):3037–3044.
2. Bhushan S, et al. (2010)α-Helical nascent polypeptide chains visualized within distinct regions of the ribosomal exit tunnel.Nat Struct Mol Biol17(3):313–317.
3. Lu J, Deutsch C (2005) Secondary structure formation of a transmembrane segment in Kv channels.Biochemistry44(23):8230–8243.
4. Ciryam P, Morimoto RI, Vendruscolo M, Dobson CM, O’Brien EP (2013) In vivo trans-lation rates can substantially delay the cotranstrans-lational folding of the Escherichia coli cytosolic proteome.Proc Natl Acad Sci USA110(2):E132–E140.
5. Zhang G, Ignatova Z (2011) Folding at the birth of the nascent chain: Coordinating translation with co-translational folding.Curr Opin Struct Biol21(1):25–31. 6. Dobson CM (2003) Protein folding and misfolding.Nature426(6968):884–890. 7. Frydman J, Erdjument-Bromage H, Tempst P, Hartl FU (1999) Co-translational domain
folding as the structural basis for the rapid de novo folding of firefly luciferase.Nat Struct Biol6(7):697–705.
8. Hoffmann A, et al. (2012) Concerted action of the ribosome and the associated chaperone trigger factor confines nascent polypeptide folding.Mol Cell48(1):63–74. 9. Kaiser CM, Goldman DH, Chodera JD, Tinoco I, Jr, Bustamante C (2011) The ribosome
modulates nascent protein folding.Science334(6063):1723–1727.
10. Ellis JP, Culviner PH, Cavagnero S (2009) Confined dynamics of a ribosome-bound nascent globin: Cone angle analysis of fluorescence depolarization decays in the presence of two local motions.Protein Sci18(10):2003–2015.
11. Knight AM, et al. (2013) Electrostatic effect of the ribosomal surface on nascent polypeptide dynamics.ACS Chem Biol8(6):1195–1204.
12. Gershenson A, Gierasch LM (2011) Protein folding in the cell: Challenges and prog-ress.Curr Opin Struct Biol21(1):32–41.
13. Preissler S, Deuerling E (2012) Ribosome-associated chaperones as key players in proteostasis.Trends Biochem Sci37(7):274–283.
14. Kramer G, et al. (2002) L23 protein functions as a chaperone docking site on the ri-bosome.Nature419(6903):171–174.
15. Ferbitz L, et al. (2004) Trigger factor in complex with the ribosome forms a molecular cradle for nascent proteins.Nature431(7008):590–596.
16. Kaiser CM, et al. (2006) Real-time observation of trigger factor function on translating ribosomes.Nature444(7118):455–460.
17. Mashaghi A, et al. (2013) Reshaping of the conformational search of a protein by the chaperone trigger factor.Nature500(7460):98–101.
18. Patzelt H, et al. (2002) Three-state equilibrium of Escherichia coli trigger factor.Biol Chem383(10):1611–1619.
19. Patzelt H, et al. (2001) Binding specificity of Escherichia coli trigger factor.Proc Natl Acad Sci USA98(25):14244–14249.
20. Raine A, Lovmar M, Wikberg J, Ehrenberg M (2006) Trigger factor binding to ribo-somes with nascent peptide chains of varying lengths and sequences.J Biol Chem
281(38):28033–28038.
21. Saio T, Guan X, Rossi P, Economou A, Kalodimos CG (2014) Structural basis for protein antiaggregation activity of the trigger factor chaperone.Science344(6184):1250494. 22. Hsu S-TD, et al. (2007) Structure and dynamics of a ribosome-bound nascent chain by
NMR spectroscopy.Proc Natl Acad Sci USA104(42):16516–16521.
23. Rutkowska A, et al. (2009) Large-scale purification of ribosome-nascent chain com-plexes for biochemical and structural studies.FEBS Lett583(14):2407–2413. 24. Eichmann C, Preissler S, Riek R, Deuerling E (2010) Cotranslational structure
acquisi-tion of nascent polypeptides monitored by NMR spectroscopy.Proc Natl Acad Sci USA
107(20):9111–9116.
25. Cabrita LD, et al. (2016) A structural ensemble of a ribosome-nascent chain complex during co-translational protein folding.Nat Struct Mol Biol23(4):278–285. 26. Christodoulou J, et al. (2004) Heteronuclear NMR investigations of dynamic regions of
intact Escherichia coli ribosomes.Proc Natl Acad Sci USA101(30):10949–10954. 27. Elcock AH (2006) Molecular simulations of cotranslational protein folding: Fragment
sta-bilities, folding cooperativity, and trapping in the ribosome.PLOS Comput Biol2(7):e98. 28. O’Brien EP, Christodoulou J, Vendruscolo M, Dobson CM (2012) Trigger factor slows
co-translational folding through kinetic trapping while sterically protecting the na-scent chain from aberrant cytosolic interactions.J Am Chem Soc134(26):10920–10932. 29. Ingólfsson HI, et al. (2014) The power of coarse graining in biomolecular simulations.
Wiley Interdiscip Rev Comput Mol Sci4(3):225–248.
30. Dedmon MM, Lindorff-Larsen K, Christodoulou J, Vendruscolo M, Dobson CM (2005) Mapping long-range interactions inα-synuclein using spin-label NMR and ensemble molecular dynamics simulations.J Am Chem Soc127(2): 476–477.
31. Li C, et al. (2008) Differential dynamical effects of macromolecular crowding on an intrinsically disordered protein and a globular protein: Implications for in-cell NMR spectroscopy.J Am Chem Soc130(20):6310–6311.
32. Waudby CA, et al. (2013) In-cell NMR characterization of the secondary structure populations of a disordered conformation ofα-synuclein withinE. colicells.PLoS One8(8):e72286. 33. Nakatogawa H, Ito K (2001) Secretion monitor, SecM, undergoes self-translation
ar-rest in the cytosol.Mol Cell7(1):185–192.
34. Cabrita LD, Hsu ST, Launay H, Dobson CM, Christodoulou J (2009) Probing ribosome-nascent chain complexes producedin vivoby NMR spectroscopy.Proc Natl Acad Sci USA106(52):22239–22244.
35. Schanda P, Brutscher B (2005) Very fast two-dimensional NMR spectroscopy for real-time investigation of dynamic events in proteins on the real-time scale of seconds.J Am Chem Soc127(22):8014–8015.
36. Waudby CA, Christodoulou J (2012) An analysis of NMR sensitivity enhancements obtained using non-uniform weighted sampling, and the application to protein NMR.
J Magn Reson219:46–52.
37. Kirchdoerfer RN, Huang JJ-T, Isola MK, Cavagnero S (2007) Fluorescence-based analysis of aminoacyl- and peptidyl-tRNA by low-pH sodium dodecyl sulfate-poly-acrylamide gel electrophoresis.Anal Biochem364(1):92–94.
38. Ferrage F, Zoonens M, Warschawski DE, Popot JL, Bodenhausen G (2003) Slow dif-fusion of macromolecular assemblies by a new pulsed field gradient NMR method.
J Am Chem Soc125(9):2541–2545.
39. Amand B, Pochon F, Lavalette D (1977) Rotational diffusion ofEscherichia coli ribo-somes. I. - Free 70 S, 50 S and 30 S particles.Biochimie59(10):779–784.
40. Tomic S, Johnson AE, Hartl FU, Etchells SA (2006) Exploring the capacity of trigger factor to function as a shield for ribosome bound polypeptide chains.FEBS Lett580(1):72–76. 41. Lakshmipathy SK, Gupta R, Pinkert S, Etchells SA, Hartl FU (2010) Versatility of trigger factor
interactions with ribosome-nascent chain complexes.J Biol Chem285(36):27911–27923. 42. Banavar JR, Maritan A (2007) Physics of proteins.Annu Rev Biophys Biomol Struct36:
261–280.
43. Bhushan S, et al. (2011) SecM-stalled ribosomes adopt an altered geometry at the peptidyl transferase center.PLoS Biol9(1):e1000581.
44. Sandikci A, et al. (2013) Dynamic enzyme docking to the ribosome coordinates N-terminal processing with polypeptide folding.Nat Struct Mol Biol20(7):843–850. 45. Papoian GA (2008) Proteins with weakly funneled energy landscapes challenge the
classical structure-function paradigm.Proc Natl Acad Sci USA105(38):14237–14238. 46. Camilloni C, Vendruscolo M (2013) A relationship between the aggregation rates of
α-synuclein variants and theβ-sheet populations in their monomeric forms.J Phys Chem B117(37):10737–10741.
47. Bah A, et al. (2015) Folding of an intrinsically disordered protein by phosphorylation as a regulatory switch.Nature519(7541):106–109.
48. Deleersnijder A, Gerard M, Debyser Z, Baekelandt V (2013) The remarkable conforma-tional plasticity of alpha-synuclein: Blessing or curse?Trends Mol Med19(6):368–377. 49. Theillet FX, et al. (2016) Structural disorder of monomericα-synuclein persists in
mammalian cells.Nature530(7588):45–50.
50. Merz F, et al. (2008) Molecular mechanism and structure of Trigger Factor bound to the translating ribosome.EMBO J27(11):1622–1632.
51. Brandt F, et al. (2009) The native 3D organization of bacterial polysomes.Cell136(2):261–271. 52. Gumbart J, Schreiner E, Wilson DN, Beckmann R, Schulten K (2012) Mechanisms of
SecM-mediated stalling in the ribosome.Biophys J103(2):331–341.
53. Pronk S, et al. (2013) GROMACS 4.5: a high-throughput and highly parallel open source molecular simulation toolkit.Bioinformatics29(7):845–854.
54. Sivashanmugam A, et al. (2009) Practical protocols for production of very high yields of recombinant proteins usingEscherichia coli.Protein Sci18(5):936–948. 55. Best RB, de Sancho D, Mittal J (2012) Residue-specificα-helix propensities from
mo-lecular simulation.Biophys J102(6):1462–1467.
56. Betancourt MR, Thirumalai D (1999) Pair potentials for protein folding: Choice of reference states and sensitivity of predicted native states to variations in the in-teraction schemes.Protein Sci8(2):361–369.
57. Ernst RR, Bodenhausen G, Wokaun A (1987)Principles of Nuclear Magnetic Resonance in One and Two Dimensions(Oxford Univ Press, New York).
58. Johnson E, Showalter SA, Brüschweiler R (2008) A multifaceted approach to the in-terpretation of NMR order parameters: A case study of a dynamicα-helix.J Phys Chem B112(19):6203–6210.
59. Koppel DE (1974) Study ofEscherichia coliribosomes by intensity fluctuation spec-troscopy of scattered laser light.Biochemistry13(13):2712–2719.
Deckert et al. PNAS | May 3, 2016 | vol. 113 | no. 18 | 5017
BIOPHYSIC
S
AND
COMPUTAT
IONAL