http://dx.doi.org/10.4236/ns.2016.87035
Effect of Different Levels of Phosphorus
and Method of Application on the
Growth and Yield of Wheat
Shahzado Noonari
1, Shahmir Ali Kalhoro
2,3, Amjad Ali
4, Amanullah Mahar
4,
Sajjad Raza
4, Muneer Ahmed
3,4, Syed Fayaz Ali Shah
5, Sana Ullah Baloch
61Department of Agronomy, Sindh Agriculture University, Tandojam, Pakistan 2Institute of Soil & Water Conservation, Northwest A&F University, Yangling, China
3Faculty of Agriculture, Lasbela University of Agriculture, Water and Marine Science, Uthal, Pakistan 4College of Natural Resources & Environment, Northwest A&F University, Yangling, China
5Agricultural Research Institute (Tarnab), Peshawar, Pakistan
6Key Laboratory of Crop Physiology, Ecology and Production, Huazhong Agricultural University, Wuhan, China
Received 13 December 2015; accepted 9 July 2016; published 12 July 2016
Copyright © 2016 by authors and Scientific Research Publishing Inc.
This work is licensed under the Creative Commons Attribution International License (CC BY).
http://creativecommons.org/licenses/by/4.0/
Abstract
An experiment was conducted to evaluate the productivity of wheat under different levels of phosphorus and method of application at Department of Agronomy, Sindh Agriculture University, Tandojam. Experiment was laid out in a RCBD (factorial) with three replications. The treatments were four phosphorus levels (P1 = 0 Kg∙ha−1 +Recommended Nitrogen, P2 = 30 Kg∙ha−1 +
Recom-mended Nitrogen, P3 = 60 Kg∙ha−1 + Recommended Nitrogen and P4 = 90 Kg∙ha−1 +Recommended
Nitrogen) and two placement methods (A1 = Drilling method and A2 = Broadcast method). The statistical analysis of phosphorus levels and placement exhibited significant differences to the maturity days, plant height, tiller production, spike length, grains per spike, seed index, harvest index and grain yield ha−1. However, the interactions of P levels and placement in all crop
charac-ters were non-significant except the grain yield/ha−1. The results revealed that application of 90
kg P ha-1 prolonged 143 days for maturity, taller plants (100.16 cm), more tiller plant−1 (13.50),
lengthy spikes (12.83 cm), more grains spike−1 (51.33), heavier seed index (48.16 g), better
harv-est index (50.82%) and satisfactory grain yield (4240.50 Kg∙ha−1). The unit increase in grain yield
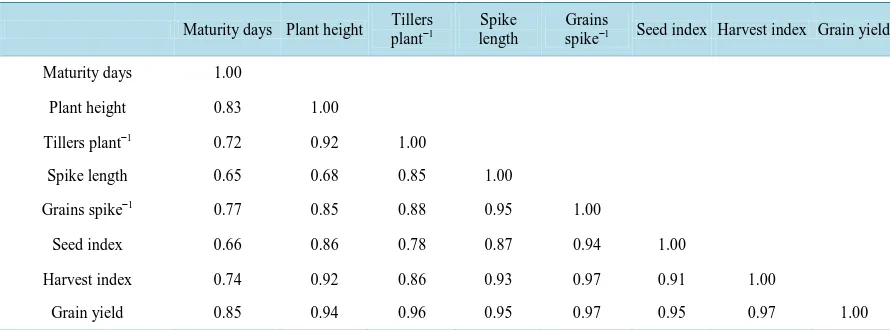
was positively correlated with the increased values of observed crop parameters by extending the values of maturity r = 0.85, plant height r = 0.94, tillers plant r = 0.96, spike length r = 0.95, grains spik−1 r = 0.97, seed index r = 0.95 and harvest index r = 0.97. It was concluded that 90 kg P ha−1
Keywords
Wheat, Phosphorous, Broadcasting, Drilling, Yield
1. Introduction
Phosphorous (P) is the second essential plant nutrient required by plant in large quantity after Nitrogen (N) for growth [1]. Phosphorous is the primary constituent of plant and animal life. P always plays a vital role in several metabolic processes. It has structural function in macromolecules, metabolic pathways and degradation [2]. The required amount of P for wheat crop is more as compared to other crops [3]; however, the recovery is as low as 15% - 20% of the applied P, while the remaining is fixed as insoluble P in soils matrix. Furthermore 0.1% out of the total P exists in a soluble form to available for plant and the fixations occurred as unreachable form to plant for growth [4]. Wheat is the most widely cultivated crop around the world and Pakistan is one of the im-portant wheat producing countries in the world. Wheat responds well to fertilizer application with balance N:P ratio for increased wheat productivity [5] [6].
Wheat is an energetic food commodity of Pakistan, because the demand is increased day by day with increas-ing population of the country. P fertilizers increase wheat yield with the increasincreas-ing rates of phosphorus [7]. However the appropriate amount in balanced fertilization of wheat is not only for the enhancing of yield but also impact phosphorus uptake by plant [8]. Phosphorus (P) fertilizer recommendations are higher as compared to other fertilizers for wheat production. Generally there are two methods for the application of P fertilizer, i.e., broadcast and band [9]. Many research revealed that application of phosphorus to wheat crop significantly in-creased the plant height, number of tillers plant−1, straw and grain yield over control [2] [10] [11]. Moreover the improved growth of wheat depends on the source of phosphorus in soil and rate of application [12] [13]. Fur-thermore seed placement and side-banding of P fertilizer rates are equally efficient for grain yield increase [14] [15].
In addition the banding application of phosphorous is appropriate for the improvement of plant height, shoots and roots in wheat [13]. Many researchers revealed that the efficiency of phosphorus through fertilization proved better than broadcast application [10]. However wheat yields improved with adequate amount of P ferti-lizer [16]-[18]. Moist condition of fine texture soil has less effect from high fertiferti-lizer rates in contact with seed and in dry condition coarse textured soils. The unbalanced nutrients in soil from the improper input of nutrients are probably responsible for the reduced flag leaf and canopy photosynthetic characteristics and LAI, and for the fast declining of flag leaf photosynthetic traits during grain filling, resulting in the reduced yield [19]. The effi-ciency of applied nutrient’s can be improved by placement and synchronized application at growth stages [20]. Keeping in view the importance of P as an important nutrition for wheat, the present study was conducted.
2. Materials and Methods
The field experiment was conducted at student’s Farm, Department of Agronomy, Sindh Agriculture University, Tandojam. The purpose of experimental studies to analysis of different levels of P and their effect on different methods applications on the growth and yield of wheat. The seed of wheat variety Mehran-89 was obtained from wheat section Agriculture Research Institute Tandojam.
Research Design:
Experiment: Randomized Complete Block Design (RCBD) Plot size: 5 m × 3 m = 15 m2
Replications: Three (3) Treatments: Eight (8)
Sowing methods: Broadcasting and Drilling Factor A: Phosphorus levels (3)
P1 = 0 Kg∙ha−1 + Recommended Nitrogen
P2 = 30 Kg∙ha−1 + Recommended Nitrogen
P3 = 60 Kg∙ha−1 + Recommended Nitrogen
Factor B: Placements (2) A1 = Drilling method
A2 = Broadcast method
Land preparation: Land was prepared by giving two cross wise dry plowings with mould board plough fol-lowed by clod crushing and land leveling. Land was saturated when come in better condition and one plowing was given with rotary plough followed by leveling the active seed bed.
Sowing of seed: Crop was drilled at the depth of 3.4 cm apart and the distance between row to row 22.5 cm was maintained in all treatments.
Phosphorus placement methodology: Phosphorous are applied in two ways, Broadcast and Drilling, broadcast is the common practice and commonly used by farmers, in this way all phosphorus (fertilizer) was applied dur-ing land preparation and the recommended N fertilizer (Urea) was incorporated on the surface of the soil in three split applications of irrigations. However in drill application phosphorus was directly applied at the time of drilling of seed and nitrogen was applied on surface of soil in three split applications of irrigations.
Irrigation: After 20 days of sowing of seed 1st irrigation was applied and subsequent irrigations were given as requirement of sap.
Weeding: After one month of germination of wheat, weeding & cultural practices were carried out.
Crop maturity and harvest: Crop was harvested when more than 90% of ear heads were revolutionize the col-or from green to yellow and declared the maturity of crop.
Plant height, spike length, number of grains spike−1 & number of tiller plant−1: Plant height, spike length, number of grains of spike−1 and number of tiller plant−1 was recorded at the time of harvesting & randomly five plants were selected from each treatment for plant height, spike length, number of grains spike−1 & number of tiller plant−1 and data were recorded.
Seed index and harvesting of seed: Seed index were calculated byweight of 1000 grains of wheat from each treatment, however harvest index were calculated by using the formula.
(
)
Grain Yield 1000 Harvest index
Biological Yield grain straw
∗ =
+
3. Statistical Analysis
All the analysis was performed in triplicate samples and the mean values are presented. The software SPSS ver-sion 13.0 for Windows was used for the statistical analysis. Data about the different P application treatments were checked by one-way ANOVA for the independent variable analysis.
4. Result & Discussion
Days to maturity: The statistical analysis of variance for (Table 1) days to maturity sowed that phosphorus le-vels and placements were significantly different; however, their interaction was non-significant at 5% probabili-ty level. The recorded data maximum days of maturiprobabili-ty 142.33 in case of application of phosphorus through drilling method, whereas, the minimum days to maturity 140.66 were observed in case of P-broadcast. Applica-tion of P-fertilizer of 90 kg P ha−1 taken more days 143.66 maturity of crop followed by 60 kg P ha−1 141.66 days. 139.16 days recorded as the minimum days of maturity of crop in control. The interaction between place-ment and phosphorus levels revealed that phosphorus at the rate of 90 kg P ha−1 through drilling method exhi-bited more maturity days 144.67 and minimum days 138.32 for maturity were found under broadcasting of 0 kg P ha−1.
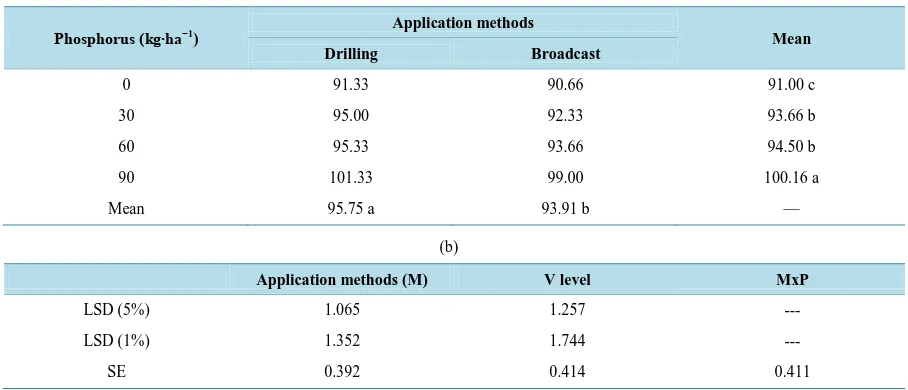
Plant height (cm): The analysis data of plant height of wheat in (Table 2) showed the analysis of variance of plant height was highly significant for phosphorus levels and placements and the interaction of P placement and P levels was non-significant. In case of height of plant drilling application of P plants were tall 95.75 cm, fol-lowed by broadcast P placement practice were recorded as 93.91 cm plant height.
The different level of P also effect on the height of plant, 90 kg P ha−1 in recorded as the tall plants 100.10 cm, followed by 60 kg P ha−1 94.50 cm moreover the dwarf 91.00 cm plants height was recorded in the control 0 kg P ha−1, followed by 30 kg P ha−1 application through broadcast.
Table 1. Days to maturity of wheat under different phosphorus levels and application methods. Mean followed by common
letter arc not significantly different.
(a)
Phosphorus (kg∙ha−1) Application methods
Drilling (days for maturity) Broadcast (days for maturity)
0 140.00 138.00
30 142.00 141.00
60 142.00 140.00
90 144.00 142.00
(b)
Application methods (M) P level I MxP
LSD (5%) 1.05 1.348 ---
LSD (1%) 123 1.871 ---
SE 0332 0.444 0.3051
Table 2. Plant height (cm) under different phosphorus levels and application methods. Mean followed by common letter are
not significantly different.
(a)
Phosphorus (kg∙ha−1) Application methods Mean Drilling Broadcast
0 91.33 90.66 91.00 c
30 95.00 92.33 93.66 b
60 95.33 93.66 94.50 b
90 101.33 99.00 100.16 a
Mean 95.75 a 93.91 b —
(b)
Application methods (M) V level MxP
LSD (5%) 1.065 1.257 ---
LSD (1%) 1.352 1.744 ---
SE 0.392 0.414 0.411
control 0 kg P ha−1.
Number of tillers/plant: The statistical analysis of variance of number of tillers plant−1 are affected on differ-ent level and placemdiffer-ent of P (Table 3) showed the number of tillers plant−1 was significantly different due to different P levels and placements; however, their interaction was non-significant. Experiential result explain the highest average numbers of tillers 11.41 per plant were observed in drilling application of P while, the lowest number of tillers plant 9.50 were found in P application by broadcast. However 90 kg P ha−1 produced maximum number of tillers plant−1 13.50, followed by 60 kg P ha−1 11.83 and the minimum number of tillers plant−1 9.66 were 30 kg P ha−1 followed by control 0 kg P ha−1 6.83. The application of drilling at the rate of 90 kg P ha−1 produced maximum number of tillers plant−1 14.66 followed by drilling of 60 kg P ha−1 13.00 and the minimum numbers of tillers plant−1 6.66 were observed under control.
4.1. Spike Length (cm)
Table 3. Tillers plant−1 of wheat under different phosphorus levels and application methods. Mean followed by common
let-ter are not significantly different.
(a)
Phosphorus (kg∙ha−1) Application methods Mean Drilling Broadcast
0 7.00 6.66 6.83 d
30 11.00 8.33 9.66 c
60 13.00 10.66 11.83 b
90 14.66 12.33 13.50 a
Mean 11.41 a 9.50 b —
(b)
Application methods (M) P level MxP
LSD (5%) 1.132 0.891 --
LSD (1%) 1.426 1.237 ---
SE 0.353 0.298 0.154
Table 4. Spike length (cm) of wheat under different phosphorus levels and application methods. Mean followed by common
letter are not significantly different.
(a)
Phosphorus (kg∙ha−1) Application methods Mean Drilling Broadcast
0 7.33 1 7.33 I 7.33 d
30 10.66 d 8.66 c 9.66 c
60 12.66 h 10.00 d 11.33 h
90 14.00 a 11.66 c 12.83 a
Mean 11.16 a 9.41 b —
(b)
Application methods (M) P level (I1) MxL
LSD (5%) 0.563 0.655 0.926
LSD (1%) 0.865 0.909 1.286
SE 0.323 0.216 0.305
that the length of spike was significantly affected due to application of different phosphorus levels and place-ments and their interactions.
The maximum average spike length 11.16 cm was observed in application of drilling, while, minimum spike length 9.41 cm was found in broadcasting.
The P level of at the rate of 90 kg P ha−1 produced significantly maximum spike length 12.83 cm, followed by 60 kg P ha−1 11.33 cm and the minimum 7.33 cm spike length was exhibited in control.
The interaction between placement and phosphorus levels revealed that the drilling application at the rate of 90 kg P ha−1 produced lengthy spikes 14.00 cm followed by drilling at the rate of 60 kg P ha−1 12.66 cm and the minimum spike length 7.33 cm was recorded in both the methods (Drilling & Broadcasting) of P applications.
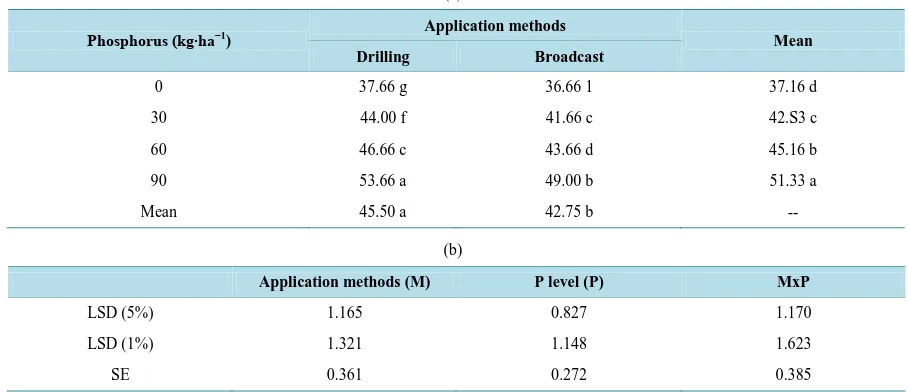
4.2. Number of Grains Spike
−1Table 5. Number of grains spike−1 under different P levels and application methods. Mean followed by common letter arc
not significantly different.
(a)
Phosphorus (kg∙ha−1) Application methods Mean Drilling Broadcast
0 37.66 g 36.66 1 37.16 d
30 44.00 f 41.66 c 42.S3 c
60 46.66 c 43.66 d 45.16 b
90 53.66 a 49.00 b 51.33 a
Mean 45.50 a 42.75 b --
(b)
Application methods (M) P level (P) MxP
LSD (5%) 1.165 0.827 1.170
LSD (1%) 1.321 1.148 1.623
SE 0.361 0.272 0.385
grains per spike were significant, the maximum number of grains spike−1 45.50 were observed in P application by drilling and the minimum number of grains spike−1 42.75 were observed in application of P as broadcast. The nitrogen level at the rate of 90 kg P ha−1 produced significantly maximum number of grains spike−1 51.33 fol-lowed by 60 kg P ha−1 45.16 grains spike−1 and the minimum grains spike−1 37.00 were recorded in control. The interaction between P placement and P doses showed that drilling methods of P at the rate of 90 kg P ha−1 pro-duced more grains spike−1 53.66, followed by broadcast at the rate of 90 kg P ha−1 49.00 grains spike−1 and the lowest numbers of grains spike−1 36.66 were recorded in control.
4.3. Seed Index (1000 Grain Weight in Grains)
Analysis result of seed index are illustrated in (Table 6) the seed index affected significantly by the different phosphorus levels and placement and their interaction was non-significant. P placement illustrated the greater seed index 39.33 g was recorded in drilling method of application and the minimum seed index 37.33 g was recorded under broadcast application of P. P application at the rate of 90 kg P ha−1 produced maximum seed in-dex 48.16 g, followed by 60 kg P ha−1 41.00 g and the minimum seed index 30.83 g, was recorded in control. The interaction between placement and phosphorus levels revealed the drilling application at the rate of 90 kg P ha−1 produced higher seed index 49.33 g and the interaction illustrated lower seed index values 30.66 g in control.
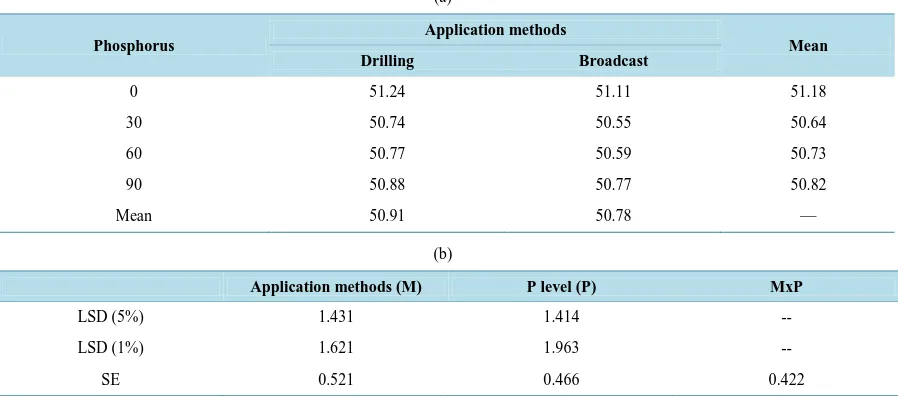
4.4. Harvest Index
Analysis result of harvest index are illustrated (Table 7) the analysis of variance that the harvest index was non-significant affected due to application of different nitrogen levels placements and their interactions. The maximum values of harvest index were observed in drilling application of P as compared to broadcasting 50.91 and 50.78. Whereas P application at the rate of 90 kg∙ha−1 showed better harvest index 50.82% followed by 60 kg P ha−1 50.33% and the minimum 51.18% harvest index was recorded in control. The interaction of P place-ment and levels were non-significant and the drilling application of P at the rate of 90 kg P ha−1 had higher harvest index 50.88% followed by broadcast at the rate of 90 kg P ha−1 50.77% and the minimum harvest index 51.11% was initiate in control.
4.5. Grain Yield (
kg∙ha
−1)
Table 6. Seed index (1000 grain weight g) of wheat under different phosphorus levels and application methods. Mean fol-lowed by common letter are not significantly different.
(a)
Phosphorus (kg∙ha−1) Application methods Mean Drilling Broadcast
0 30.66 31.00 30.83 d
30 35.00 31.66 3 13 c
60 42.33 39.66 41.00 b
90 49.33 47.00 48.16 a
Mean 39.33 a 37.33 b —
(b)
Application methods (M) P level (P) MxP
LSD (5%) 1.431 1.414 ---
LSD (1%) 1.621 1.963 ---
SE 0.521 0.466 0.422
Table 7. Harvest index (%) of wheat under different P levels and application methods. Mean followed by common letter are
not significantly different.
(a)
Phosphorus
Application methods
Mean Drilling Broadcast
0 51.24 51.11 51.18
30 50.74 50.55 50.64
60 50.77 50.59 50.73
90 50.88 50.77 50.82
Mean 50.91 50.78 —
(b)
Application methods (M) P level (P) MxP
LSD (5%) 1.431 1.414 --
LSD (1%) 1.621 1.963 --
SE 0.521 0.466 0.422
in P application by drilling and the minimum grain yield 2808 kg∙ha−1 were observed in P application by broad-cast. However, nitrogen levels illustrated the application at the rate of 90 kg P ha−1 produced significantly max-imum wheat grain yield 4240.50 kg∙ha−1, followed by 60 kg P ha−1 3213.66 kg∙ha−1 and the minimum grain yield 1700.00 kg∙ha−1 were recorded in control. The interaction between placement and phosphorus levels revealed that drilling application at the rate of 90 kg P ha−1 significantly produced maximum grain yield 4532.33 kg∙ha−1, followed by broadcast at the rate of 90 kg P ha−1 3948.66 kg∙ha−1 and the minimum grain yield 1700 kg∙ha−1 were recorded in control.
4.6. Relationship of Crop Parameters with Wheat Grain Yield
Table 8. Grain yield (kg∙ha−1) of wheat under different P levels and application methods. Mean followed by common letter
arc not significantly different.
(a)
Phosphorus (kg∙ha−1) Application methods Mean Drilling Broadcast
0 1700 c 1700 c 1700 d
30 2941.66 d 2668.33 d 2805.00 c
60 3512.33 c 2915.00 d 3213.66 b
90 4532.33 a 3948.66 b 4240.50 a
Mean 3171.58 a 2808.04 b —
(b)
Application methods (M) P level (I1) MxP
LSD (5%) 135.85 150.60 70.22
LSD (1%) 265.16 209.00 295.60
SE 56.861 49.650 70.220
Table 9. Co-relation coefficient values of various parameters under P levels and placements.
Maturity days Plant height plantTillers −1 length Spike Grains spike−1 Seed index Harvest index Grain yield
Maturity days 1.00
Plant height 0.83 1.00
Tillers plant−1 0.72 0.92 1.00
Spike length 0.65 0.68 0.85 1.00
Grains spike−1 0.77 0.85 0.88 0.95 1.00
Seed index 0.66 0.86 0.78 0.87 0.94 1.00
Harvest index 0.74 0.92 0.86 0.93 0.97 0.91 1.00
Grain yield 0.85 0.94 0.96 0.95 0.97 0.95 0.97 1.00
5. Discussion
[image:8.595.90.535.351.516.2]References
[1] Wahid, F., Sharif, M., Khan, M.A., Ali, A., Khattak, A.M. and Saljoqi, A.R. (2015) Addition of Rock Phosphate to Different Organic Fertilizers Influences Phosphorus Uptake and Wheat Yield. Journal of Ciencia E Tecnica Vitivini-cola, 30, 91-100.
[2] Barbers, S.A. (1995) Soil Nutrient Bioavailability: A Mechanistic Approach. Fertilizers Development. New York Bio-Fertilizers, 36-51.
[3] Timsina, J. and Connor, D.J. (2001) Productivity and Management of Rice-Wheat Cropping Systems: Issues and Chal-lenges. Journal of Field Crops Research, 59, 93-132. http://dx.doi.org/10.1016/S0378-4290(00)00143-X
[4] Rodriguez, H. and Fraga, R. (1999) Phosphate Solubilizing Bacteria and Their Role in Plant Growth Promotion.
Jour-nal of Biotechnology Advances, 17, 319-339. http://dx.doi.org/10.1016/S0734-9750(99)00014-2
[5] David, H., Speirs, A., Flavel, P., Motley, K. and Dyson, C. (2003) Phosphorus-Yield in Wheat, Canola and Field Peas Grown at Different Soil P and Levels. Australian Society of Agronomy, 20, 1-6.
[6] Oyedeji, S., Animasaun, D.A., Bello, A.A. and Agboola, O.O. (2014) Effect of NPK and Poultry Manure on Growth, Yield, and Proximate Composition of Three Amaranths. Journal of Botany, 10, 1155.
http://dx.doi.org/10.1155/2014/828750
[7] Rehman, H., Ghani, A., Shah, G.A. and Khan, J. (1992) Relating Soil Test Values of NaHCO3 Extractable Phosphorus
with Yield of Wheat and Rice. NFDC, 331-344.
[8] Rehman, O., Zaka, M.A., Rafa, H.U. and Hassan, N.M. (2006) Effect of Balanced Fertilization on Yield and Phospho-rus Uptake in What-Rice Rotation. Journal of Agricultural Research, 44, 105-113.
[9] Rehm, G., Schmitl, M. and Munter, R. (1993) Fertilizing Wheat in Minnesota. Minnesota Extension Service AG-FO- 3772-I3. University of Minnesota.
[10] Alam, S.M., Latif, A. and Iqbal, Z. (2002) Wheat Yield and Phosphorus Use Efficiency as Influenced by Method of Phosphorus and Zinc Application. Pakistan Journal of Scientific and Industrial Research, 45, 117-119.
[11] Dahnkc, W.C. (1983) Soil Testing and Soil Fertility Management. Crop Production Guide. North Dakota State Univer-sity, Fargo, 75-86.
[12] Peterson, S.G.A., Sander, D.H., Grabouski, P.H. and Hooker, M.L. (1981) A New Looks at Row and Broadcast Phos-phate Recommendations for Winter Wheat. Agronomy Journal, 73, 13-17.
http://dx.doi.org/10.2134/agronj1981.00021962007300010004x
[13] Valizadeh, G.R., Rengel, Z. and Rate, A.W. (2002) Wheat Genotypes Differ in Growth and Phosphorus Uptake When Supplied with Different Sources and Rates of Phosphorus Banded or Mixed in Soil in Pots. Australian Journal of
Ex-perimental Agriculture, 42, 1103-1111. http://dx.doi.org/10.1071/EA01087
[14] Karamanos, R.E., Stonehouse, T.A. and Flore, N.A. (2003) Response of Winter Wheat to Nitrogen and Phosphate Fer-tilizer Placement and Time of Application. Canadian Journal of Plant Science, 83, 483-488.
http://dx.doi.org/10.4141/P02-071
[15] Rehm, G.W., Sims, A.L. and Lamb, J.A. (2003) Influence of Rate and Placement of Phosphate Fertilizer on Growth and Yield of Hard Red Spring Wheat in Diverse Tillage Systems. Nutrient Cycling in Agroecosystems, 67, 75-83. http://dx.doi.org/10.1023/A:1025169825754
[16] Halvorson, A.D., Havlin, J.L. and Reule, C.A. (2002) Fertilizer Phosphorus Management Options for No-Till Dryland Winter Wheat. Better Crops with Plant Food, 86, 4-7.
[17] Franzcn, I.W. (1996) North Dakota Fertilizer Handbook. NDSU Extension Service EB-65. North Dakota State Univer-sity, Fargo.
[18] Rehm, G.W. (1986) Using Starter or Row Applied Fertilizer for Minnesota Crops. Minnesota Extension Service AG- FS-2933. University of Minnesota, Minneapolis.
[19] Jiang, D.T., Dai, Q., Xing, C.W., Hui, Z., Qin, Z., Mei, F.X., Zhen, C.R., Hua, F.G., Tao, L.D. and Jun, Z.A. (2004) Effects of Long-Term Combined Application of N, P and K Fertilizer on Grain Quality in Winter Wheat. Scientia
Agricultura Sinica, 37, 566-571.
[20] Sharma, A.R. (2004) Fertilizer Management in Maize-Wheat Cropping System in the Western Himalayan. Fertilizer News, 49, 13-18, 21-28, and 31-32.
[21] Ali, A., Khaliq, T., Ahmad, A., Ahmad, S., UllahMalik, A. and Rasul, F. (2012) How Wheat Responses to Nitrogen in the Field? A Review. Crop & Environment, 3, 71-76.
[22] Hussain, N., Khan, M.B. and Ahmad, R. (2008) Influence of Phosphorus Application and Sowing Time on Perfor-mance of Wheat in Calcareous Soils. International Journal of Agriculture and Biology, 10, 399-404.
of Wheat to NPK Fertilizer. Science International (Lahore), 24, 185-189.
[24] Shah, K.H., Siddiqui, S.H., Memon, M.Y., Aslam, M., Imliaz, M. and Khan, P. (2003) Performance of Fertigation Technique for P Usage Efficiency in Wheat. Asian Journal of Plant Sciences, 2, 1088-1091.
[25] Al-Rashidi, G.A. (2004) The Effect of N and P Fertilizers Application on the Growth and Yield of Wheat Crop. var. Kalyansona. University of Aden Journal of Natural and Applied Sciences, 8, 19-24.
[26] Bhakare, D. and Sonar, K.R. (2004) Influence of Phosphate Application on Yield, P Uptake and Nutrient Status of Soil after Soybean-Wheat Cropping Sequence in an Inceptisol. Journal of Maharashtra Agricultural Universities, 29, 240- 241.
[27] Robinson, I.L., Pinchak, W.E., Sij, J.W., Bevers, S.J., Gill, R.J., Malinowski, D.P. and Baughman, T.A. (2004) Phos-phorus Fertilizer Impacts Forage, Beef, and Grain Production from Wheat. Better Crops with Plant Food, 88, 8-11.
[28] Burmestcr, C.H., Patterson, M. and Reeves, D.W. (1994) Cover System and Starter Fertilizer Placement for No-Till Cotton. Proceedings of the Beltwide Cotton Conferences, New Orleans, 10-14 January 1994.
[29] Jiang, D., Dai, T., Jing, Q., Cao, W., Zhou, Q., Zhao, H. and Fan, X. (2004) Effects of Long-Term Fertilization on Leaf Photosynthctic Characteristics and Grain Yield in Winter Wheat. Photosynthetica, 42, 439-446.
[30] Joshi, O.P. and Billore, S.D. (2004) Fertilizer Management in Soybean (Glycine Max)-Wheat (Triticum aestivum) Cropping System. Indian Journal of Agricultural Sciences, 74, 430-432.
[31] Kostadinova, S. (2003) Nitrogen Fertilization and Agronomic Efficiency at Winter Wheat. Ecology and Future—Bul-
garian Journal of Ecological Science, 2, 33-36.
[32] Misas, Y., Kostadinova, S. and Tomov, T. (2003) Uptake of Nitrogen, Phosphorus and Potassium by Wheat cv. Prelom.
Pochvoznanie Agrokhimiya-i-Ekologiya, 38, 24-27.
[33] Manolov, I., Dimitrova, M. and Chalakov, H. (2003) Effect of Fertilizing System to Weed Infestation of Winter Cereal Crops. Bulgarian Journal of Agricultural Science, 9, 1-4.