7576
GROUP FORMATION METHOD THROUGH HEURISTICS
ALGORITHM
1OKTARIANI NURUL PRATIWI, 2BUDI RAHARDJO, 3SUHONO HARSO SUPANGKAT
1,2,3School of Electrical Engineering and Informatics, Institut Teknologi Bandung, Indonesia E-mail: 1[email protected], 2[email protected], 3[email protected]
ABSTRACT
Cooperative learning is an approach of learning that work together in small group to achieve goal together. This method has proven can increase student ability, confident and communication skill. One method of cooperative learning is Jigsaw method. Jigsaw method requires formation in heterogeneous groups, but remains homogeneous between groups. Unfortunately, determination of appropriate group formation according to the method is difficult, especially if the number of students is large. Therefore, this research attempts to propose an algorithm to set heterogeneous group formation of student properly. The right formation can encourage students to learn optimally and able to improve students' understanding well. In this study, the process of grouping students based on student dissimilarity. This paper contributes a group formation algorithm with the Optimization approach. For comparison, in this study the Centered-Optimization algorithms compared to Centered-Random algorithms. As result, the Centered-Centered-Optimization algorithm can provide the highest heterogeneous fitness value. Based on ANOVA Univariate analysis, the fitness value of fixed-root-optimization algorithm is significantly different from the two comparison algorithms.
Keywords: Cooperative learning tools, computer science education, e-learning, group formation,
1 INTRODUCTION
COOPERATIVE learning is a method of learning in small groups where teachers will provide direction to solve a problem together to be able to improve the ability of each student in terms of understanding the material to social skills [1],[2]. Based on the results of several studies, cooperative learning can provide many advantages in learning outcomes [3], among them are to increase student learning activeness in learning process [1], encouraging students to be able to share and care about their group's friends [1], and effective in improving students' abilities[4]. Therefore, cooperative learning method is widely used in the learning process either face to face in school or through online learning.
Cooperative learning method that is quite popular is JIGSAW [1]. JIGSAW is a method of learning in a heterogeneous group, where students are grouped with other students who have different characteristics and abilities. The formations in the group are heterogeneous, and each group has the same group composition (homogeneous)[5]. It aims to make the equalization of the learning process can
be achieved. The number of students in each group based on the Jigsaw method is 5-6 people.
Usually, groups of student in schools is determined by teachers based on their ability, randomly or determined by the students themselves [6]. However, the composition of the student formation appropriately can not be done randomly [7] or based on the student's name order [8] because it allows students with the same characteristics to be in the same group so that the results of cooperative learning are not optimal. Obstacles on grouping manually by teachers are difficult to find the composition of the formation that is truly optimal and the process can take a long time, especially in the class that has many students [9]. Furthermore, this study what is the relationship between the number and type of attributes to the process of students heterogeneous grouping
7577 Therefore, we need tools to be able to help teachers in grouping students automatically. Thus, the objective of cooperative learning process can be achieved maximally.
There have been several researches about cooperative learning tools. Both in software development and improvements of grouping algorithm. This study contributes to the improvement of algorithms to determine the form of heterogeneous groups. This research aims to optimize heterogeneous grouping algorithm.
The limitations of the research in this study are:
1. Case studies in a senior high school.
This research was conducted with a case study in a senior high school in Bandung. The number of students proposed in this case study consisted of 3 classes. The subjects implemented are craft subjects, because classes with these subjects are available and the time is right for cooperative learning. Although this case study is limited to school, the implementation of this research can be carried out for a broader learning environment. 2. Automation of determining the formation of student learning groups.
Case studies of this study require a learning environment with cooperative learning methods. The part that helped by the application is the automation of determining the formation of student groups. The learning process is entirely within the authority of the teacher concerned, but the determination of the formation of student groups is done automatically by the system based on the proposed grouping process model.
The paper is organized as follows: we describe existing research of heterogeneous grouping method in Section 2. Section 3 describe Jigsaw cooperative learning method. We describe about student model in Section 4. Our proposed method is introduced in Section 5. We describe the experiment in Section 6. Result and analysis of experiments in Section 7. Finally, conclusions are proposed in Section 8.
2 RELATEDWORKSANDRESEARCH
METHODOLOGY
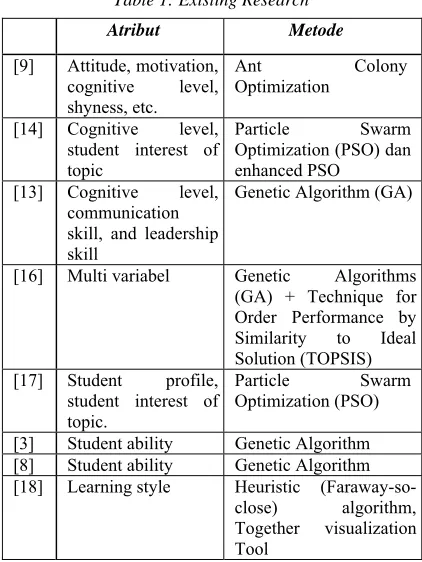
There are many researches try to solve the problem of group formation, those are Genetic Algorithm method [12], [13], [8], Ant Colony [9], Particle Swarm Optimization [14], Tabu Search
[image:2.612.312.523.134.415.2][15], etc. Comparison of this study can be seen in the table 1.
Table 1: Existing Research
Atribut Metode
[9] Attitude, motivation, cognitive level, shyness, etc.
Ant Colony
Optimization
[14] Cognitive level, student interest of topic
Particle Swarm
Optimization (PSO) dan enhanced PSO
[13] Cognitive level, communication skill, and leadership skill
Genetic Algorithm (GA)
[16] Multi variabel Genetic Algorithms (GA) + Technique for Order Performance by Similarity to Ideal Solution (TOPSIS) [17] Student profile,
student interest of topic.
Particle Swarm
Optimization (PSO)
[3] Student ability Genetic Algorithm [8] Student ability Genetic Algorithm [18] Learning style Heuristic
(Faraway-so-close) algorithm, Together visualization Tool
In addition, the differences of these studies are characteristics of students used for grouping process. Many researches use characteristics of student like the level of student cognitive, social interaction of students, learning styles of students, and communication skills.
Basically students have a lot of characteristic data. This research tried to use student characteristic data based on jigsaw method and other student characteristics, internal and external student characteristics.
The research methodology incorporated in this study can be described as follows:
1. Literature study
We used a large number of books, journals, reports, and websites relating to the research topic, especially about dissimilarity object, cooperative learning and educational data mining.
2. Data gathering
7578 This research needs a support system that can test the algorithm. The system can gather data from student, preprocess data, calculate dissimilarity of student, implement the algorithm of grouping student.
4.Test and analysis
We implemented the system in a senior high school in Bandung, Indonesia. It took 3 months in 2017. Then we analyzed the result of cooperative learning process statictically used ANOVA.
5. Research report and documentation
The results, references, and all other findings related to this research were documented in a research report. Publication of the research results was also done in the research phase.
3 JIGSAWMETHOD
The Jigsaw method was developed by Elliot Aronson in 1971 in Texas [19]. Jigsaw cooperative learning method has succeeded in reducing the problem of racism, discrimination and hatred in schools that reduce the level of students' learning ability into collaboration that can lead to a positive learning atmosphere. The jigsaw process encourages students to be able to listen, improve self-activity, and improve empathy. The Jigsaw method divides the students into several heterogeneous groups but, however, maintains its intergroup homogeneity. Each group consists of 5-6 people with different characteristics based on gender, ethnicity, race and ability of students. Each group member has an important part in the learning process.
Many studies have proven the success of the Jigsaw method in improving students' learning abilities. Many schools in different places of the Jigsaw derived method are the characteristics of students used for grouping basis. Race in Indonesia is not a problem, because the majority of Indonesian race is the same, that is Malay. However, the problem of discrimination sometimes still occurs. Therefore, by adapting the Jigsaw learning process, this study aims to form learning groups that can be used in cooperative learning process based on student characteristics that are slightly different from the original Jigsaw method
.
4 STUDENTMODEL
The student model represents the data on student characteristics used for the group formation process. Based on the Jigsaw method, the characteristics of students used for the basis of
grouping are race, gender, ethnicity and ability. In addition, to adapt to actual classroom conditions in the hope of providing appropriate grouping heterogeneous grouping formations then, this study also adds some attributes of other student characteristics.
Characteristics of student attributes that are used based on the students' internal side and the student's external side. The students' internal data consists of non-academic data and academic data. Non-academic data consists of religion, age, family status. External data used are parents' educational background, economic situation, residence and learning facilities. Academic data are student's ability, and learning style.
The learning style used in this research is visual, auditory, and kinesthetic [20]. Learning style of each student is obtained after students answer the questionnaire given online. Questionnaire given in the form of multiple choice by 30 questions. Students are given time to be able to choose an answer based on the circumstances that best suit themselves.
Student data collection is collected online through the provided e-learning system and data derived from document files. The documents obtained are documents provided by teachers manually.
Some preprocessing step of data, the value of each of these characteristics is limited to the following:
1. Gender: male or female;
2. Religion: Islam Protestantism, Catholicism, Hinduism, Buddhism;
3. Parent education background: elementary, junior high, graduate, master, doctor
4. Economics: financial sources of fathers and / or mothers;
5. Learning style: visual, audio, kinestetik 6. Age: too young, right, too old;
7. Tribe: Sundanese, Javanese, Batak, Minang, Betawi, Dayak, Mixed;
8. Birth order: Eldest, Middle, Youngest, Single; 9. Place of residence: Together with parents, not with parents;
7579
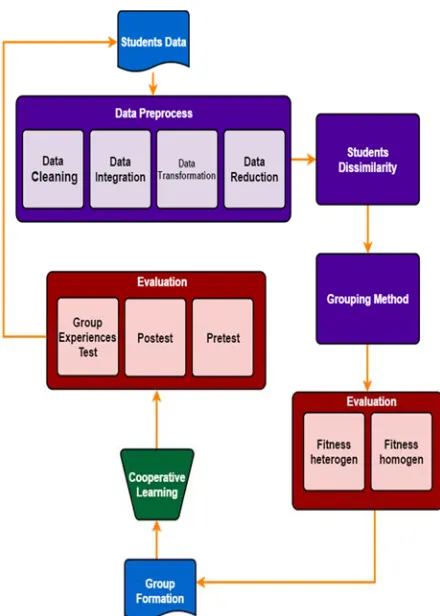
5 AUTOMATICGROUPFORMATION
[image:4.612.79.299.123.431.2]Automatic group formation consists of several stages, namely preprocess, student dissimilarity, grouping and evaluation process. Automatic Group Formation process shown in Figure 1.
5.1 Preprocess
As discussed in the Student Model section, this study uses some characteristics of student data. Where each value data characteristics have different data types. Prior to the process of grouping students, the process of measuring dissimilarity among students.
The measurement of dissimilarity between students divided the data into several data types. The definition of the data type is [21]:
1.Binary data (symmetric), data consist of 2 state of equal value;
2.Binary (asymmetric), data consist of 2 state and both state are not equal;
3.Categorical, data consist more 2 state;
4.Ordinal data, resembles a categorical variable, except that the M states of the ordinal value are ordered in a meaningful sequence.
[image:4.612.315.519.209.404.2]Referring to data type, student data is processed into the data type above. The adjustment of data types of student characteristics used in this study are as follows:
Table 2: Student Data Types
No Atribut Tipe
1 Gender Binary (symmetric) 2 Religion Categorical 3 Parent education
background
Ordinal
4 Economics Binary (asymmetric) 5 Learning
Style Categorical 6 Age Categorical 7 Tribe Categorical 8 Birth order Categorical 9 Residence Binary
(asymmetric) 10 Learning
facility Ordinal 11 Cognitive Ordinal
Stages of preprocess data: 1.Data cleaning
Data cleaning is a process to handle incomplete data, handle outliers, and eliminate inconsistent data [21]. The incompleteness of the data in this study is caused by students not entering school during the process of input data value, either during pretest or posttest. To address the problem, the researcher fills in the data using the grade average. 2.Data integration
Data integration is the process of combining data from multiple sources in order to avoid duplication of data [21]. Data integration can combine data from e-learning system database and data from the teacher.
3.Data transformation
Data transformation is the process of converting data into an appropriate type [21]. Stages of data transformation used in this study:
• Aggregation. Some data values are summed up into a data value only. This process is implemented on the student's initial value attribute which is the result of the aggregation of the daily task value and the student exams.
• Generalization, converting data from lowlevel concepts to higher-level concepts. One of the
7580 implementations conducted on student data in this study is the age attribute.
4.Data reduction
Data reduction aims to reduce the amount of data [21]. In this research, data reduction process used is attribute subset selection using information gain decision tree. Subset selection is the process of reducing data by eliminating attributes that are not very relevant to the results.
5.2 Student Dissimilarity
After the preprocessing phase, the next step is the measurement of dissimilarity among students. The value of dissimilarity among students is measured based on student characteristics data. Student data consists of many attributes with various data types.
Therefore, to be able to measure dissimilarity value among students who have various data types using equation 1[21]. Output of this dissimilarity measurement is matrix dissimilarity. This matrix contains dissimilarity values between students. Dissimilarity (d) between students is a common scale of the interval [0.0,1.0]. Closer to 0, the students are similar. Closer to 1, the students increasingly different.
𝑑 𝑖, 𝑗 ∑ 𝛿 𝑑
∑ 𝛿
(1)
Where 𝛿 = 0 if either (1) 𝑥 or 𝑥 is missing, or (2) 𝑥 =𝑥 =0 and variable f is asymmetric binary. Otherwise, 𝛿 =1. The contribution of variable f to the dissimilarity between i and j, that is, 𝑑 , is computed dependent on its type [21]:
1.if f is interval-based:
𝑑 𝑥 𝑥
𝑚𝑎𝑥 𝑥 𝑚𝑖𝑛 𝑥
2.if f is binary or categorical: 𝑑 =0 if 𝑥 =𝑥 ; otherwise 𝑑 =1
3.If f is ordinal: computer the ranks 𝑟 and 𝑧 , and treat 𝑧 as interval scaled.
If f is ratio-scaled: either perform logarithmic transformation and treat the transformed data as interval-scaled; or treat f as
continuous data, compute 𝑟 dan 𝑧 , and then treat 𝑧 as interval-scaled
5.3 Grouping Method
This research used Fixed Root Algorithm to determine formation of grouping student. Fixed root is a pair of student (Si, Sj) which is the most dissimilar in student population. The fixed root saved is as many as N/5, N is number of students. Thus, the number of groups formed based on the number of Centered specified. Where student population (N) divided by 5, based on Jigsaw method, in a group consist of 5 or 6 students.
In order to get a heterogeneous group, in this study conducted 2 kinds of Centered. The first root fix is a pair of students who have the highest dissimilarity value. The second experiment was a pair of students who have median value of dissimilarity.
[image:5.612.325.530.428.741.2]After get the Centered, to meet the formation of groups consisting of 5 students, and then made the process of determining the rest of the students. We compared the process of determination the rest of students by random and our optimization algorithm. We name the approach algorithm as Centered-Random, Centered Max-Optimization, and Centered Median-Optimization.
7581
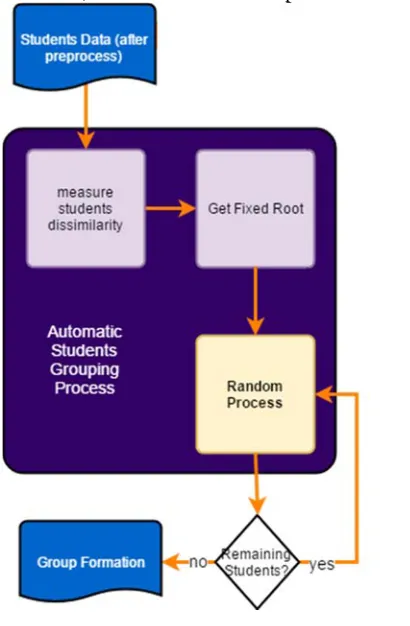
5.3.1 Centered-Random
As described earlier, Centered-Random is an algorithm to get formation of grouping student by find the root student and then get the rest of students by random. Centered is a pair of student that have median value of dissimilarity. After preprocess data, analysis of dissimilarity level among students in class using equation (1) and then, we determined the root. After that, we determined the rest of students in each group by random. This process diagram shown in Figure 2.
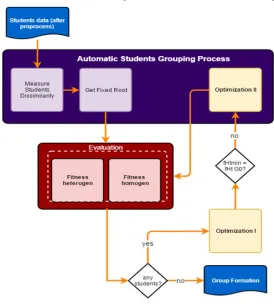
5.3.2 Centered-Max Optimization and Centered-Median Optimization
Centered-Optimization is an algorithm that is essentially same as Centered Random, where the first thing to do in group formation is determination the Centered. The Centered is a pair
of students with maximum dissimilarity (Centered-Max) and a pair of students who have median value dissimilarity of matrix dissimilarity (Centered-Median). Different with Centered-Random, Centered Optimization determines the rest of the student in group formation with the optimization process. The purpose of this optimization is to determine the students who are able to make the level of heterogeneity in the group to be maximal. However, the resulting formation remains balanced
with other groups (homogeneous). This process can be seen in Figure 3.
After preprocess data, and system measures the dissimilarity level among students in class using equation (1). The output of the dissimilarity level of students is matrix dissimilarity. Based on matrix dissimilarity, we find number of pairs of students who will be Centered. Centered is attempted in the form of a pair of students with the maximum dissimilarity value (max) and a pair of students with median dissimilarity value.
Once Centered is determined, and then the rest of the students who will join the Centered is determined by 2 stages of optimization. The first optimization is to know which remaining students are able to maintain group heterogeneity.
Meanwhile, the second optimization is to increase the heterogeneity of the smallest group to be better, without reducing the heterogeneity of other groups.
[image:6.612.158.432.300.604.2]The process of determining the rest of the students is done one by one. It aims to maintain the heterogeneity of each group and the homogeneity of the groups to keep maximum. In first optimization process, the remaining students calculated the heterogeneous fitness value of each
7582 root 𝑓𝐻𝑡 𝑆. Save the highest 𝑓𝐻𝑡 𝑆 of each root, that is max 𝑓𝐻𝑡 𝑆. From all of the max 𝑓𝐻𝑡 𝑆, we can get the minimum of max 𝑓𝐻𝑡 𝑆, that is value of COG (Center of Groups). The group which have the minimum max 𝑓𝐻𝑡 𝑆 will be the Fixed Group (G0 fix). G0 fix is the first group to look for new members.
After that, we categorized the rest of students into COG(up) and COG(down). If 𝑓𝐻𝑡 𝑆
is greater than COG, then add S in COG(up). Otherwise, if 𝑓𝐻𝑡 𝑆 is smaller than COG, then add S in COG(down). New member added to the groups one by one sequentially, based on number of S in COG(up) or
𝑓𝐻𝑡𝑆
.The remaining students who become candidates for new members are prioritized S who are located in the COG group (up) and closest to the limit of COG. It aims to make the value of heterogeneity maximal. However, if the candidate S has been selected by another G (group), then the system will take S that is above or below it. And so on, until all G has a new member candidate.
Every finish added a new member to all groups, then calculate the heterogeneous fitness of each group. Ensure the group that has min 𝑓𝐻𝑡
value is still G0 fix. If it change to other group, then go to the second optimization. Because if G0 fix change to other group, we assess the level of heterogeneity decreases and requires another process to increase the value of the 𝑓𝐻𝑡 again.
The second optimization aims to increase
min 𝑓𝐻𝑡 . The second optimization process starts
from G which has min 𝑓𝐻𝑡 . Students who become candidates for new members in the group are replaced with other students as long as that student not new candidate in another group.
After finding a new member candidate, then recalculated the heterogeneous fitness value of each group. If the new min 𝑓𝐻𝑡 value is greater than the old min 𝑓𝐻𝑡 then the new member candidate is saved as a new group member. However, if the new min 𝑓𝐻𝑡 value is smaller than the old min 𝑓𝐻𝑡 , then add the old member candidate. Do the Process until full group formation and no students left.
5.4 Evaluation
Based on the Jigsaw method, grouping of students for cooperative learning should form heterogeneous groups and homogeneous
intergroups. Then calculate the heterogeneous fitness value in the group and the homogeneous fitness value between the groups. Heterogeneous fitness values and homogeneous fitness values were obtained using student and group dissimilarity. The following is an explanation of the method used for Jigsaw group formation optimization.
A class consist of many students, denoted by S = {m, n, o, …, S}. The students are divided
into groups G = { G1, G2, …, Gn }. In a group there are many students 𝑠 . 𝑑 𝑚, 𝑛 is the value of dissimilarity between students m and n in a group. Attributes of student denoted by a, where 𝑎 is first attribute of student m.
Average of dissimilarity between student denoted by 𝑑̅, used to calculate heterogeneous values in groups. To calculate heterogeneous levels in each group can be calculated by equations (3).
𝑑̅ ∑ 𝑑
𝑗
(3)
𝑗 𝑠 𝑠
2
(4)
𝑓𝐻𝑡 𝑑
𝑑̅
(5)
Where, 𝑑 is the smallest dissimilarity between student. 𝑑̅ is the average of dissimilarity between student. To maximize heterogeneous levels in the group, the dissimilarity values among students in the group should be as big as possible. Hence, in the process of determining group members, students who have the lowest dissimilarity should be exchanged to other group members who have the lowest dissimilarity levels as well from other groups.
To ensure group formation is already heterogeneous or not, by looking at the heterogeneous fitness value (𝑓𝐻𝑡) in a group. Equation 5 to calculate the 𝑓𝐻𝑡. Where 𝑓𝐻𝑡 value is interval 0-1, if 𝑓𝐻𝑡 closer to 1 the group is getting heterogeneous.
7583 (𝑓𝐻𝑡) is below:
𝑓𝐻𝑡 ∑ 𝑓𝐻𝑡
𝑔
(6)
Intergroup formation can be said to be homogeneous if the (𝑓𝐻𝑡) value of each group is the same. To ensure that between homogeneous groups by looking at the value of homogeneous fitness (𝑓𝐻𝑚 between the groups. As (𝑓𝐻𝑚 approaches 1, the homogenous level between groups is better.. The equation (𝑓𝐻𝑚 is as follows:
𝑓𝐻𝑚 𝑓𝐻𝑡
𝑓𝐻𝑡
(7)
The group formation resulting from the optimization process based on Dissimilarity with the highest 𝑓𝐻𝑡 and 𝑓𝐻𝑚 values, it can be said to be the most heterogeneous group formation in the group and the homogeneous intergroup of the class. The formation was tested in class with Jigsaw cooperative learning to know the progress of student learning using the formation of this research.
6 AUTOMATICGROUPFORMATION
The experiment was conducted in 3 classes of high school. Total number of students is 85 students. Experiment conducted to test Centered-Random, Centered-Optimization Max, and Centered-Optimization Median. The results of the group formation process were evaluated based on the students' heterogeneous fitness scores in the group, and the fitness values of the group's homogeneity.
The group formation of students produced by the system, then tested in class. By doing pretest first. After the pretest, students learn in groups with cases and materials that have been determined by the teacher. After the cooperative learning process, student did the posttest and Group Experience questionnaire. It aims to know the formation of learning groups on the development of student learning and student satisfaction to the formation of groups that are given automatically.
7 RESULTS&ANALYSIS
Measurements of fitness values between groups were carried out to determine the distribution of students in all groups. So it is expected that each group has the same heterogeneity value so that homogeneity between groups can be achieved. The comparison of the homogeneity fitness values between the groups based on the methods can be seen in the table 3.
Table 3: Homogeinity Fitness
Metode Kelas
A B C
Centered Random 0.589 0.364 0.431
Centered Opt-Max 0.719 0.800 0.962
Centered Opt-Med 0.704 0.650 0.870
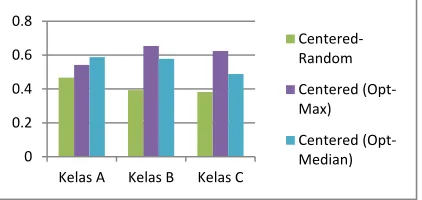
Heterogeneous fitness in the group can be seen in table 4.
Table 4: Heterogeneous Fitness
METHOD GROUP MEAN
G1 G2 G3 G4 G5 G6
A Centered
Random 0.436 0.451 0.266 0.453 0.662 0.438 0.451 Centered
Opt-Max 0.445 0.604 0.694 0.656 0.644 0.669 0.619 Centered
Opt-Med 0.846 0.600 0.753 0.480 0.594 0.812 0.680 B Centered
Random 0.581 0.191 0.479 0.523 0.574 0.800 0.525 Centered
Opt-Max 0.642 0.749 0.803 0.531 0.729 0.531 0.664 Centered
Opt-Med 0.876 0.762 0.854 0.487 0.757 0.762 0.750 C Centered
Random 0.148 0.206 0.517 0.405 0.348 0.436 0.343 Centered
Opt-Max 0.655 0.624 0.623 0.688 0.617 0.643 0.642 Centered
Opt-Med 0.600 0.724 0.549 0.537 0.647 0.519 0.596
[image:8.612.317.528.462.562.2]Visualization from table 4 can be seen in Figure 4. Based on Figure 4, we can see Centered-Optimization able to generate the best heterogeneous fitness group formation.
7.1 Anova
From the result of measurement of heterogeneous in the group then we analyzed using Univariate Analysis of Variance (Univariate ANOVA) in SPSS. The purpose of Univariate ANOVA in this research is to know the significance of heterogeneous fitness value based on the method. The results from Univariate ANOVA can be seen in table 5.
0 0.2 0.4 0.6 0.8
Kelas A Kelas B Kelas C
Centered‐ Random
Centered (Opt‐ Max)
Centered (Opt‐ Median)
7584
Table 5: Univariate ANOVA Comparison
(I) Metode (J)Metode Sig.
1 2 .000
3 .000
2 1 .000
3 .444
3 1 .000
2 .444
In table 5, method 1 is Centered-Random, method 2 is Centered-Optimization Max, and method 3 is Centered-Optimization Median. Based on table 5, it can be seen that there is a statistically significant difference between method 1 with method 2 and 3
(𝑝 𝑣𝑎𝑙𝑢𝑒 0.5 . We can see in Table 4, that the
heterogeneous fitness values in the group resulting from the Centered-Optimization Max grouping and the Centered-Optimization Median formations are significantly better than the heterogeneous fitness values of the Centered-Random method.
7.2 Pretest and Postest
Cognitive evaluation based on pretest and posttest results. The questions used in pretest and posttest are the same questions and given by the teacher. The pretest and posttest comparisons after learning in groups was determined by the teacher and in the group defined by the system using the Centered-Optimization method. The comparison results can be seen in table 6. In table 6 we can see the comparisons of pretest and postest after student learned in groups, which determined by teacher and groups that determined by system.
Table 6: Pretest and Postest Comparison
By teacher By system
Pretest Postest Pretest Postest A 12.53 84.89 11.32 81.31
B 15.42 88.15 16.04 77.18
C 19.04 90.07 14.37 82.97
Mean 15.66 87.70 13.91 80.49
Based on Table 6, the value of pretest and posttest significantly increased after cooperative learning process. By looking at posttest value, both group learning show good cognitive score. This suggests the system is capable of providing group formations as well as grouping by teacher.
7.3 Group Experience Questionnaire
To see the results of student satisfaction on the formation of groups that determined the system, the researchers conducted the distribution of questionnaires. This questionnaire includes
[image:9.612.309.529.172.295.2]questions of student satisfaction on learning formation, to the assessment of the activity among students during learning in groups. The question and answer result of student questionnaire as a whole is as follows:
Table 7: Homogeinity Fitness
N o.
Questions Answer
Positive Netral Negative 1 Can you learn with
a group well?
51% 32% 17%
2 Do you like
formation of
learning groups that are formed automatically by system?
36% 59% 5%
8 CONCLUSION
The main contribution of this research is Fixed Root Optimization method. This method can be used for grouping student heterogeneously. The difference between this method and the other method is this method apply the fixed root. So, the grouping process becomes faster and each group is similar heterogeneous.
One of the advantages of this dissertation process model is there is no limit to the number and types of attributes used for determining heterogeneous group formation. The difference in the use of the number and type of student attributes as parameters for heterogeneous groupings that are different in each school is a challenge for this process model to be able to determine the local characteristics that exist in the school environment. This is because the attributes used for the process of determining group formation are handled in the process of dissimilarity between mix data type. Where attributes that are homogeneous in a collection of students will have a value of dissimilarity 0 (zero). The model process for determining group formation proposed in this study can be used by a group of students in various types of schools. This helps the process of determining attribute usage automatically because the number and type of attributes will not significantly influence the heterogeneous grouping process time.
[image:9.612.89.303.505.585.2]7585 Median are considered to be significantly different from other algorithms.
Moreover, result of pretest and posttest after cooperative learning shows some good improvement. The students progress of learning almost as good as the progress when student learn in groups that determined by the teacher. Students can accept the group formation that determine automatically by system.
From these results, we can see that the process of student searching each student can give good results and worth to do. The heterogeneity level and the student learning satisfaction are good. For next research, we can try to find the best way to reduce number of student characteristic based on the situation in each school.
9 ACKNOWLEDGMENT
This research was supported by DRPM – Ministry of Research, Technology and Higher Education (Indonesia). We would also like to thank Reni Susanti, S.Pd as counselor teacher in this research.
REFERENCES
[1] R. Bekele, “Computer-Assisted Learner Group Formation Based on Personality Traits,” 2005.
[2] J. Israel and R. Aiken, “Supporting Collaborative Learning With An Intelligent Web-Based System,” Int. J. Artif. Intell. Educ., vol. 17, 2007.
[3] A. Sukstrienwong, “Heterogeneous Grouping of Students with a Fair Distribution of Multiple Academic Attributes : A Case Study,” vol. 9, no. 16, pp. 3565–3578, 2014.
[4] S. Liu, M. Joy, and N. Griffiths, “iGLS: Intelligent Grouping for Online Collaborative Learning,” 2009 Ninth IEEE Int. Conf. Adv. Learn. Technol., pp. 364–
368, Jul. 2009.
[5] Q. I. a O. Mengduo and J. I. N. Xiaoling, “Jigsaw Strategy as a Cooperative Learning Technique : Focusing on the Language Learners,” J. Appl. Linguist., pp. 113–125,
2010.
[6] T. R. Henry, “Creating Effective Student Groups : An Introduction to groupformation.org,” in Proceeding of the 44th ACM technical symposium on Computer science education, 2013, pp. 645–
650.
[7] Anthony S. Dallmann-Jones, The Expert Educator: A Reference Manual of Teaching Strategies for Quality Education. Three Blue
Herons Pub, 1994.
[8] H. Iima, “Genetic Algorithms for Student Grouping Problems,” 2015.
[9] S. Graf and R. Bekele, “Forming Heterogeneous Groups for Intelligent Collaborative Learning Systems with Ant Colony Optimization,” in Intelligent Tutoring Systems, 2006, vol. 4053, pp. 217–226.
[10] D. W. Johnson and R. T. Johnson, The Internal Dynamics of Cooperative Learning Groups. USA: Springer US, 1985.
[11] R. E. Slavin, “Development and Motivational Perspective on Cooperative Learning: A Reconciliation,” Spec. Issue Sch. Dev., vol. 58, no. 5, pp. 1161–1167,
1987.
[12] A. Sukstrienwong, “Genetic Algorithm for Forming Student Groups Based on Heterogeneous Grouping 3 Basic Concepts Algorithms 4 . Detail of the Genetic Algorithm for Heterogeneous Grouping ( GAHG ),” pp. 92–97.
[13] J. Moreno, D. a. Ovalle, and R. M. Vicari, “A genetic algorithm approach for group formation in collaborative learning considering multiple student characteristics,”
Comput. Educ., vol. 58, no. 1, pp. 560–569,
Jan. 2012.
[14] Y.-T. Lin, Y.-M. Huang, and S.-C. Cheng, “An automatic group composition system for composing collaborative learning groups using enhanced particle swarm optimization,” Comput. Educ., vol. 55, no. 4,
pp. 1483–1493, Dec. 2010.
[15] R. Hu, “Assigning Students to Groups Using General and Context-Specific Criteria,” vol. 3, no. 3, pp. 178–189, 2010.
[16] M. M. B. Jozan and F. Taghiyareh, “A Semi-Pareto Optimal Set based Algorithm for Grouping of Students,” in The 4th International Conference on e-Learning and e-Teaching, ICELET 2013, 2013, pp. 10–13.
[17] H. Tien, Y. Lin, and Y. Chang, “Advances in Web-Based Learning - ICWL 2011,” vol. 7048, pp. 11–22, 2013.
[18] P. Paredes, A. Ortigosa, and P. Rodriguez, “A Method for Supporting Heterogeneous-Group Formation through Heuristics and Visualization,” J. Univers. Comput. Sci., vol.
16, no. 19, pp. 2882–2901, 2010.
7586 Strategy,” 2007.
[20] Swinburne University of Technology, “VAK Learning Styles Self-Assessment Questionnaire.” .
[21] J. Han and M. Kamber, Data Mining,