Technology (IJRASET)
Area efficient DA based Fir filter for EEG
Classification
P. Dharsana
Assistant Professor, Department of Electronics and Communication Engineering, Apollo Engineering College, Chennai. Tamil Nadu, India
Abstract— Due to the recent development of digital signal processing algorithms and very large-scale integrated circuit technologies, the initial implementation obstacles of the orthogonal frequency division multiplexing (OFDM) no longer exist. Therefore, OFDM has been adopted in several digital communication systems such as digital audio broadcasting, terrestrial digital television and HDTV broadcasting. Moreover, various projects and prototypes of OFDM systems are widely used, including digital video broadcasting for digital terrestrial television (DVB-T) by the European Broadcasting Union, WLAN, and WiMAX, etc. This work presents a new technique for blind and joint estimation of symbol timing and carrier frequency offset in wireless orthogonal frequency division multiplexing (OFDM) systems. The joint estimation is achieved by sensing the interference introduced at the fast Fourier transform (FFT) output when a carrier frequency or timing offsets exist. The synchronization parameters are selected such that the interference is minimized. The proposed joint estimator is highly efficient because it does not require any overhead or channel state information. Simulation results show that the system is effective and robust even at low signal-to-noise ratios.
Keywords— Wavelet transform, Adaptive algorithm, Partial product method, Bit serial concept, BS algorithm
I. INTRODUCTION
Every day we are exposed to several solicitations for purchasing products, voting or supporting particular politicians and even improving our life style. Such pressure has become usual, being mediated by the entire current media available, video, audio, and even internet. How and to what extent these messages could be detected and recognized by our brain is still not well understood. In fact, the study of brain responses to commercial and political announcements has been measured mainly by the hemodynamic responses of the different brain areas, by using the functional Magnetic Resonance Imaging devices (fMRI).
However, both the stimuli and the relative brain responses have rapidly shifting characteristics that are not tracked by the evolution of the hemodynamic blood flow, which usually lasts 4–6 seconds. Different brain imaging tools, mainly EEG and Magneto encephalography, exhibit a sufficient time resolution to follow the brain activity at an expense of a coarse level of spatial resolution with respect to the fMRI. In fact, during those last ten years, the use of the high resolution EEG techniques has retrieved an increased amount of information related to the brain during activities related to complex cognitive tasks, such as memory, visual attention, short-term memory, and so forth.
In order to enhance the poor spatial content of the EEG activity, the High Resolution EEG technologies are employed to detect cortical areas involved in the task. Basically, these techniques involve the use of a large number of scalp electrodes and rely on realistic MRI-constructed head models and spatial de convolution estimations, which are usually computed by solving a linear-inverse problem based on Boundary-Element Mathematics.
Subjects were comfortably seated on a reclining chair, in an electrically shielded, dimly lit room. A 64-channel EEG system (Brain Amp, Brain products GmbH, Germany) was used to record electrical potentials by means of an electrode cap, accordingly to an extension of the 10–20 international system. In the present work, the cortical activity was estimated from scalp EEG recordings by using realistic head models whose cortical surfaces consisted of about 5000 triangles uniformly disposed.
II. BACKGROUND
A. Wavelet Transform
Technology (IJRASET)
analyzed with different resolutions.
A wave is an oscillating function of time or space and is periodic. In contrast, wavelets are localized waves. They have their energy concentrated in time or space and are suited to analysis of transient signals. While Fourier Transform and STFT use waves to analyze signals, the Wavelet Transform uses wavelets of finite energy.
B. The Discrete Wavelet Transform and the Wavelet Series
The Discrete Wavelet Transform (DWT) is provided by equation 1.1, where x(t) is the signal to be analyzed. ψ(t) is the mother wavelet or the basis function. All the wavelet functions used in the transformation are derived from the mother wavelet through translation (shifting) and scaling (dilation or compression).
The mother wavelet used to generate all the basic functions is designed based on some desired characteristics associated with that
function. The translation parameter τ relates to the location of the wavelet function as it is shifted through the signal. Thus, it
corresponds to the time information in the Wavelet Transform. The scale parameter s is defined as |1/frequency| and corresponds to frequency information.
III. LITERATURE SURVEY
EEG signal is a spontaneous bioelectricity activity that is produced by the central nervous system. It includes abundant information about the state and change of the neural system; therefore it is widely used in clinic and neural-electricity physiological research. In recent years, with the development of the nonlinear dynamics, more and more evidences indicate that the brain is a nonlinear dynamic system, and EEG signal can be regarded as its output. In 1985, Babloyantz et al. first put forward that II and IV stage EEG signals of human sleep cycle are chaotic. Hereafter, a large number of study results were reported that the EEG was derived from chaotic systems. Therefore, people try to analyze EEG signals by way of nonlinear dynamics to get new knowledge of the brain. Lindenberg, Lehnertz and Ferri et al. researched several kinds of physiological and pathologic conditions; and computed the relevant data under various conditions. They point out finally, the nonlinear characteristic of the physiological EEG signals greatly differs from that of the pathology; when clear-headed, and the brain has higher chaotic degree, processes information more quickly and can make more responses. Chaos is unordered, but in some situations, it has organizing structures and high order and is the source of system information.
A. Comparison between Wavelets and Conventional Digital Filtering
Some examples of single-trial evoked potentials, thus allowing us to compare results obtained with Wavelet Transform and with digital filtering. In addition, the figure shows the relation between the wavelet coefficients and the waveforms reconstructed from the wavelet coefficients for the scale corresponding to the alpha band (note that throughout this article the statistical tests refer to wavelet coefficients, while figures show the corresponding reconstructed waveforms).
We would like to remark that the sweeps selected do not necessarily show a clear event related response, but they are suitable for showing the better resolution achieved with the multi-resolution decomposition based on the Wavelet Transform in comparison with conventional digital filtering. The digital filter used was an `ideal filter' (i.e. a digital filter based on band pass filtering in the Fourier domain used in several earlier papers) (Bascar, 1980), with the filter limits set in agreement with the limits obtained with the multi-resolution decomposition for the alpha band. As a general remark, we can state that with the wavelet coefficients a better multi-resolution and localization of the features of the signal is achieved. In between the vertical dotted lines in sweep #1, 3 oscillations in the alpha range with the last oscillation having a larger amplitude as observed in the original sweep. This is well resolved with the wavelet coefficients as well as in the reconstructed form. However, the fine structure of this train of alpha oscillations is not resolved by digital filtering; i.e. reading a maximum from this curve is imprecise. In sweep #2, in between the dotted vertical lines, a transient is shown with a frequency clearly lower than the range of alpha band. The digital filtering does not resolve this transient and it spuriously `interpolates' alpha oscillations in continuity with the ones that precede or follow the transient. However, the wavelet coefficients show a decrease in this time segment, this phenomenon being also visible in the reconstructed form.
B. Adaptive Algorithm
Technology (IJRASET)
form of optimization procedure that minimizes an error criterion that is useful for the task at hand. In this section, we present the general adaptive filtering problem and introduce the mathematical notation for representing the form and operation of the adaptive filter. We then discuss several different structures that have been proven to be useful in practical applications.
We provide an overview of the many and varied applications in which adaptive filters have been successfully used finally, we give a simple derivation of the least-mean-square (LMS) algorithm, which is perhaps the most popular method for adjusting the coefficients of an adaptive filter, and we discuss some of this algorithm’s properties. As for the mathematical notation used throughout this section, all quantities are assumed to be real-valued. Scalar and vector quantities shall be indicated by lowercase (e.g., x) and uppercase-bold (e.g., X) letters, respectively. We represent scalar and vector sequences or signals as x(n) and X(n), respectively, where n denotes the discrete time or discrete spatial index, depending on the application.
C. Review of Partial Product Method
The value of xmn is 0 or 1, and there are 2M kinds of different . If we construct a LUT which can store all the possible combination of values [2], and the value of 2M is calculated in advance and store them in the LUT. Using xmn , the shifting (2-1 operation) and adding operation are performed on the output of the LUT. It can be realized through N-1 cycles and multiplication accumulation can be achieved directly. So the complicated multiplication-accumulation operation will be converted to the shifting and adding operation.
The parallel computing is implemented to improve the speed of calculation. The complicated multiplication-accumulation operation are converted to the shifting and adding operations when the BS algorithm is directly applied to realize linear time invariant system. The scale of the LUT will increase exponentially with the coefficient. If the coefficient is small, it is easy to realize through the rich structure of FPGA LUT; and when the coefficient is large, it will take a lot of storage resources of FPGA and reduce the calculation speed.
Meanwhile, the N-1 cycles also results in the long LUT time and the low computing speed. The paper presents the improvement and optimization of the BS algorithm aiming at the problems of the configuration in the coefficient of FIR filter, the resource and the calculating the speed, which make the memory size smaller and the operation speed faster to improve the computational performance.
Fig.1 The circuit structure through the algorithm improvement
D. Proposed Reconfigurable Improved Design Of The Bs Algorithm
BIT SERIALwas first brought up by Croisier[1], and was extended to cover the signed data system by Liu , and then it was introduced into FPGA design in order to save MAC blocks with the development of FPGA technology. The N-length FIR filter can be described as:
Technology (IJRASET)
filter coefficient bit width, which occur in direct method and consume negligible hardware resources [3].
BIT SERIALis introduced into the design of FIR filters as follows. In the two's complement system, x[n] can be described as:
E. Filters Design
In FIR filters design, ringings are generated at the edge of transition band for the reason that finite series Fourier transform cannot produce sharp edges. So that windows are often used to produce suitable transition band, and Kaiser window is mainly used for providing good performance. The parameter _ is an important coefficient of Kaiser window which involves windows types. There are variety of windows like Rectangular window, Hanging window, Hamming window, and Blackman window with the adjustment. A 31-order FIR low-pass filter is designed using Kaiser window, and the parameter is as follows: _=3.39, w=0.18. We can obtain the filter coefficients using Matlab as follows.
h(0)=h(31)=0.0019;h(1)=h(30)=0.0043;h(2)=h(29)=0.0062;h(3)=h(28)=0.0061; h(4)=h(27)=0.0025;h(5)=h(26)=-0.0050;h(6)=h(25)=-0.0148; h(7)=h(24)=-0.0236;h(8)=h(23)=-0.0266;
h(9)=h(22)=-0.0192;h(10)=h(21)=0.0015;h(11)=h(20)=0.0351;h(12)=h(19)=0.0774;h(13)=h(1 8)=0.1208;h(14)=h(17)=0.1566;h(15)=h(16)=0.1768.
IV. PROPOSED SYSTEM
A. Bit Serial Concept
BIT SERIALis an technique to implement digital signal processing (DSP) functions in FPGAs. It provides an approach for the implementation of DSP systems, it is an algorithm and with the help of lookup table (LUT) that stores the precomputed values and it can be read out easily, which makes BS-based computation suited for FPGA realization, because the LUT is the basic component of FPGA. BS specifically targets computation that is found in many of the important DSP filtering and frequency transforming functions. The BS based technique consists of Look Up Table, shift registers and scaling accumulator.
B. Algorithm for Distributed Arithmetic
BS is an important FPGA technology. We briefly outline here the conventional BS approac h for inner product computation.Here is the detail of BS . To understand the BS design consider the ‘‘sum of
products’’ inner product shown below, Where,
1) A=[A1, A2,…, An] is a matrix of “constant” values
2) x=[x1, x2,…, xn] is maatrix of input “variables”
3) Each An is of M-bits
4) Each xn is of N-bits
Technology (IJRASET)
where b denotes the b th bit of the nth sample of x. The inner product can, therefore, be repres ented as
y=Re-distributing the order of simulation thus the “BS” results in
y= A[0]( [0] + [0] + ...+ [0] )
+ A[1]( [1] + [1] +... + [1] ).
.
+ A[N-1]( [N-1]+ [N -1] +...+ [N-1] )
= (A[0]( [0] + A[1][1] + ...+c[N-1] [N-1]
+(A[0]( [0] + A[1] [1] +... +c[N-1] [N-1]
+(A[0]( [0] + A[1] [1] +...+c[N-1] [N -1]
In more compact form is
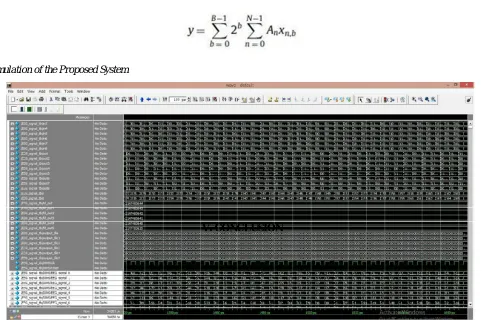
A. Simulation of the Proposed System
[image:6.612.64.560.365.685.2]V. CONCLUSION
Technology (IJRASET)
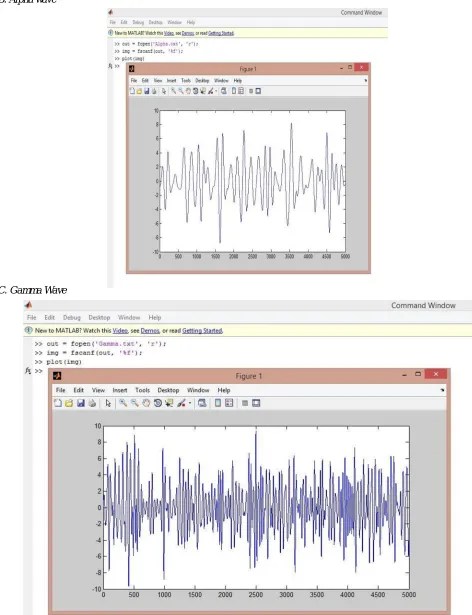
B. Alpha wave
[image:7.612.43.515.83.698.2]C. Gamma Wave
Technology (IJRASET)
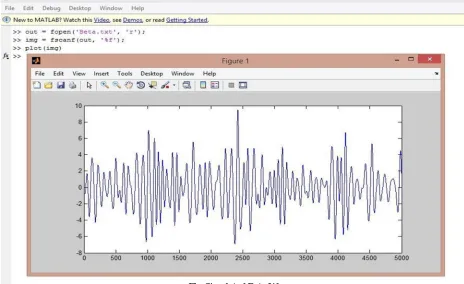
[image:8.612.66.530.99.383.2] [image:8.612.92.536.437.676.2]D. Beta Wave
Fig Simulated Beta Wave
E. Theta wave
Technology (IJRASET)
V. CONCLUSIONSIn this paper, we analyze the performance of DA based model that combines shifting and adding techniques to carried out FIR filtering in EEG signal classifications. The effectiveness of our new model is demonstrated by using the process simulated and standard EEG data. The new model is able to classify in the low-frequency band even when their frequency is overlapping with that of the EEG signal.
REFERENCES
[1] T. P. Jung, S. Makeig, C. Humphries, T. W. Lee, M. J. McKeown, V. Iragui, and T. J. Sejnowski, “Removing electroencephalographic artifacts by blind source separation,”Psychophysiology, vol. 37, pp. 163–178, Sep. 2000.
[2] G Gratton, M. G. Coles, and E. Donchin, “A new method for off-line removal of ocular artifact,”Electroencephalogr. Clin. Neurophysiol., vol. 55, no. 4, pp. 468–484, Apr. 1983.
[3] J. C. Woestengurg, M. N. Verbaten, and J. L. Slangen, “The removal of the eye movement artifact from the EEG by regression analysis in the frequency domain,”Biological Psychol., vol. 16, pp. 127–147, Feb./Mar. 1983.
[4] T. D. Lagerlund, F. W. Sharbrough, and N. E. Busacker, “Spatial filtering of multichannel electroencephalographic recordings through principal component analysis by singular value decomposition,”Clin. Neurophysiol., vol. 14, no. 1, pp. 73–82, 1997.
[5] I. T. Joliffe, Principal Component Analysis. New York, NY, USA: Springer-Verlag, 1986.
[6] R. N. Vigario, “Extraction of ocular artifacts from EEG using independent component analysis,”Electroencephalogr. Clin. Neurophysiol., vol. 103, pp. 395– 404, 1997.
[7] S. Hu, M. Stead, and G. A Worrell, “Automatic identification and removal of scalp reference signal for intracranial EEGs based on independent component analysis,”IEEE Trans. Biomed. Eng., vol. 54, no. 9, pp. 1560– 1572, Sep. 2007.
[8] R. Vigario, J. Sarela, V. Jousmaki, M. Hamalainen, and E. Oja, “Independent component approach to the analysis of EEG and MEG recordings,” IEEE Trans. Biomed. Eng., vol. 47, no. 5, pp. 589–593, May 2000.