M E T H O D
Open Access
gespeR: a statistical model for deconvoluting
off-target-confounded RNA interference screens
Fabian Schmich
1,2, Ewa Szczurek
1,2, Saskia Kreibich
3, Sabrina Dilling
3, Daniel Andritschke
3, Alain Casanova
4,
Shyan Huey Low
4, Simone Eicher
4, Simone Muntwiler
4, Mario Emmenlauer
4, Pauli Rämö
4, Raquel Conde-Alvarez
5,
Christian von Mering
6,2, Wolf-Dietrich Hardt
3, Christoph Dehio
4and Niko Beerenwinkel
1,2*Abstract
Small interfering RNAs (siRNAs) exhibit strong off-target effects, which confound the gene-level interpretation of RNA interference screens and thus limit their utility for functional genomics studies. Here, we present gespeR, a statistical model for reconstructing individual, gene-specific phenotypes. Using 115,878 siRNAs, single and pooled, from three companies in three pathogen infection screens, we demonstrate that deconvolution of image-based phenotypes substantially improves the reproducibility between independent siRNA sets targeting the same genes. Genes selected and prioritized by gespeR are validated and shown to constitute biologically relevant components of pathogen entry mechanisms and TGF-βsignaling. gespeR is available as a Bioconductor R-package.
Keywords:RNAi, siRNA, Off-target, Confounded, Phenotype, Deconvolution, Statistical model, Hit prioritization, Pathogen infection screen
Background
The discovery of RNA interference (RNAi) brought the exciting prospect of targeted gene interventions for detailed characterization of biological processes to the functional genomics community. Today, there exist multiple commercial and academic libraries, based on different reagents, such as small interfering RNA (siRNA) or small hairpin RNA (shRNA), for human cell lines and a range of model organisms. However, pheno-typic readouts of RNAi knockdown experiments using distinct reagents targeting the same gene exhibit poor reproducibility [1–3]. For siRNAs, this lack of reproduci-bility is largely due to sequence-dependent off-target effects. The intended on-target gene is silenced through full complementarity of the siRNA to the open reading frame (ORF) of its transcript. Each siRNA, however, si-lences hundreds of additional off-target genes, which has been shown in vitro [4] and in silico (Additional file 1). Using the microRNA (miRNA) pathway, the set of off-target genes of an siRNA is mainly determined by
complementarity of its seed region (positions 2–8) to the 3’ untranslated regions (UTRs) of the transcript [5]. Thus, rather than a single-gene knockdown, an
RNAi knockdown experiment is a combinatorial
knockdown of multiple genes, where the resulting knock-down phenotype does not directly reveal the effect of individual genes [6, 7].
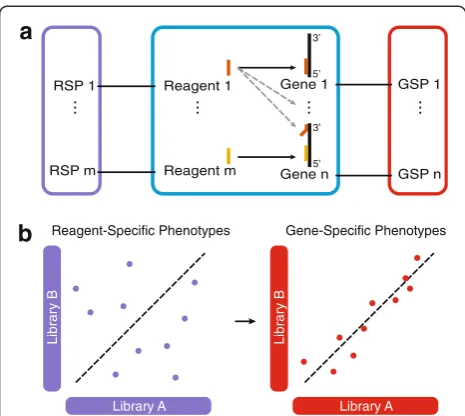
In fact, despite improved algorithms for the design of RNAi reagents [8], chemical modifications of reagents [9, 10], and the development of computational methods to improve reproducibility and to minimize the risk of reporting false positive hits [11–13], it remains challen-ging to identify the specific effect of each individual gene on the phenotype from RNAi screens. These limitations dampened initial excitement and raised concerns about the utility of the technology [11, 14]. Here, we address this challenge and introduce gespeR (for gene-specific phenotypeestimator), a statistical model for the estima-tion of hidden gene-specific phenotypes (GSPs) from observed reagent-specific phenotypes (RSPs). We model the observed RSPs as the weighted sum of individual GSPs from all on- and off-target genes, where the weights are proportional to the strengths of gene knock-downs by a reagent (Fig. 1a). Unlike RSPs, the inferred GSPs are gene-specific, deconvoluted phenotypes, i.e., * Correspondence:[email protected]
1Department of Biosystems Science and Engineering, ETH, Zurich,
Switzerland
2SIB Swiss Institute of Bioinformatics, Lausanne, Switzerland
Full list of author information is available at the end of the article
they are independent of the underlying RNAi library and hence highly reproducible between distinct RNAi librar-ies (Fig. 1b) and ultimately allow constructing uncon-founded gene hit rankings for follow-up analyses.
For the validation of gespeR, we performed extensive in silico and in vitro experiments, including (1) evaluating the performance of our model to predict new, unseen siRNA phenotypes, (2) demonstrating strong reproducibil-ity between GSP estimates from different RNAi libraries, and (3) evaluating the biological significance of estimated GSPs. We applied gespeR to phenotypes derived from three high-content, image-based pathogen infection screens and an additional, previously published screen on transforming growth factor (TGF)-β signaling [6]. Where applicable, the performance of gespeR was compared with established RNAi gene prioritization strategies: in silico pooling (ISP), redundant siRNA analysis (RSA) [15] and haystack [16]. ISP is defined as simple averaging over all RNAi reagent phenotypes for the same gene and subsequent ranking. RSA per-forms statistical tests for the enrichment of multiple reagents targeting the same gene at the top and bot-tom of ranked phenotype lists and ranks genes ac-cording to p values. Haystack uses iterative forward selection of gene transcripts to build a linear model that explains observed phenotypes based on predicted
off-target effects. gespeR is related to haystack (see "Comparison of the gespeR and haystack models" section), but is based on elastic net regularization [17] to select and prioritize genes and additionally uses on- and off-targets of RNAi reagents to model observed phenotypes.
Results and discussion
The gespeR model for deconvoluting RNAi phenotypes
gespeR can be applied to any RNAi screening data set confounded by off-target effects. The input to the model consists of observed RSPs (e.g., from siRNA, shRNA, or even small-molecule knockdown experiments) and reagent-to-gene target relations. The relationships be-tween each reagent i and each gene j are summarized in the matrix X= (Xij) ∈ [0, 1]n × p. They are typically
not provided by library vendors, but can be experi-mentally determined or, in the case of siRNAs as in this study, predicted using additional tools. We define the j-th column ofX,Xj∈[0, 1]nas the vector of knockdown
strengths of gene j for siRNAs i= 1, …, n. For observed phenotypes 1,…,k, we denote byY∈ℝn×kthe matrix of kreal-valued RSPs for siRNAsi= 1,…,n. We assume that the conditional expectation ofYis linear inX1,…,Xpand
that the deviations ofYaround its expectation are additive and Gaussian. Hence, the observed RSPs for reagentsi= 1,…,nare modeled as the weighted sum of GSPsβj∈ℝk
of all targeted genesj= 1,…,p:
Y¼Ε YjX1;…;Xp
þε¼X
p
j¼1
Xjβjþε;
where the error ε~Ν(0, σ2Ik). In this study, we
exclu-sively analyze univariate phenotypes (k= 1) derived from
a single read-out.
Application to image-based pathogen infection screen phenotypes
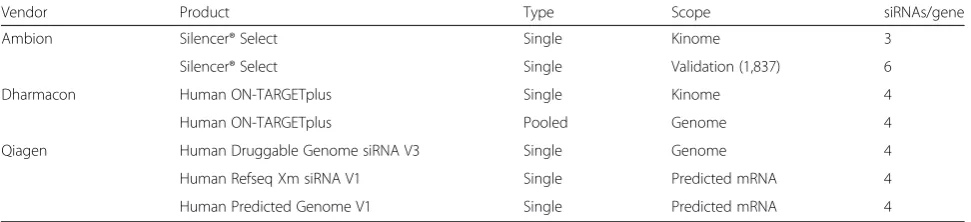
We applied gespeR to an extensive data set from high-content, image-based pathogen infection screens de-signed for the investigation of the entry pathways of three facultative intracellular bacterial pathogens: Bru-cella abortus,Bartonella henselae, andSalmonella typhi-murium (see "Image-based pathogen infection screens" section). In total, we analyzed 115,878 knockdown ex-periments per pathogen screen using single siRNA and pooled siRNA libraries from Ambion, Dharmacon, and Qiagen (Table 1). The primary phenotype extracted from quantified image features was Infectivity, defined as the fraction of infected cells within a well. We removed readouts from outlier wells with low cell count resulting from lethal siRNA transfections, i.e., wells that contained less than 250 cells from approximately 2500–4000 cells expected under normal growth, in order to avoid large
a
b
RSP 1
...
RSP m
Reagent 1
... Gene 1... 5’ 3’
5’ 3’
Reagent m Gene n
Reagent-Specific Phenotypes
Library A
Library B
Gene-Specific Phenotypes
Library A
Library B
GSP 1
...
GSP n
Fig. 1Gene-specific phenotypes (GSPs;red) estimated from off-target-confounded RNAi screens.aSchematic representation of a knockdown screen. RNAi reagents (e.g., siRNAs) target their intended on-target (black solid arrow) and additional off-target (grey dashed line arrows) genes. Each gene has a hidden GSP, whereas the observed reagent-specific phenotypes (RSPs;violet) correspond to the combined effect of on- and off-target genes.
[image:2.595.57.290.87.295.2]variation in the multiplicity of infection (MOI). In addition, we removed outlier wells with less than five in-fected cells, because we cannot rule out experimental failure in these cases. Row and column plate effects were corrected for using the B score model without applying the smoothing option (Additional file 2) [18]. Pheno-types were scaled per plate using median-absolute devi-ation (MAD) and aggregated per siRNA by the mean over all replicates.
Model validation and benchmarking
In the absence of a ground truth for cellular signaling of pathogen entry, we validated gespeR in several inde-pendent ways and, whenever possible, compared its per-formance with two established prioritization methods, RSA [15] and haystack [16], as well as with the baseline of RSPs (the observed RSPs) or in silico pooling. We first assessed the predictive power and concordance of phe-notypes between distinct libraries, since high predictive power and strong concordance are necessary conditions for meaningful gene-level interpretation of RNAi screens (see "Necessary conditions for model validity" section). Second, we evaluated the biological relevance of priori-tized hit genes by inter-pathogen comparisons, gene set enrichment analysis (GSEA), and literature validation of hit lists in two independent biological systems. Note that GSP estimates from convoluted RSPs cannot be directly validated by additional RNAi experiments on the same gene, because it has to be assumed that off-target effects will again confound the validation experiment RSPs.
Measures of mutual concordance between ranked lists of phenotypes
In order to capture most important aspects of mutual concordance, in the analyses described below we applied four different measures to compare ranked lists of phe-notypes. First, because genes with a strong positive or negative phenotype are of major interest, we determined the rank-biased overlap [19] of the top (rbo↓) and
bot-tom (rbo↑) of gene lists ranked by their phenotype. In
addition, since gespeR, haystack, and RSA, in general, do
not necessarily select fully overlapping subsets of relevant genes, we measured the overall relative overlap of selected genes using the Jaccard index (J), which is defined as the cardinality of the intersection divided by the cardinality of the union of two sets. Furthermore, we calculated Spearman’s correlation coefficient (ρ) between phenotypes, which indicates the overall rank similarity. In order to ensure fair comparisons between methods, ranked lists of RSPs and ISPs, respectively, were trimmed to the lengths of the corresponding lists of GSPs estimated by gespeR, keeping the number of selected positive and negative phenotypes fixed.
gespeR accurately predicts siRNA knockdown phenotypes
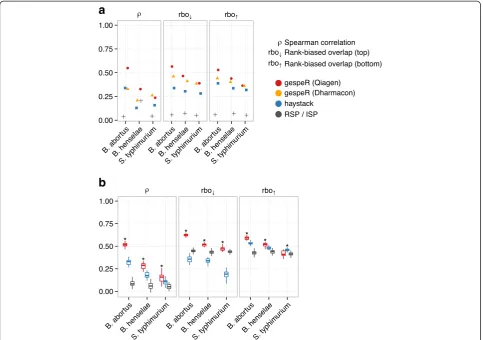
[image:3.595.56.542.101.212.2]In order to assess the predictive power of our model in a blind test, we predicted combinatorial RSPs for 1871 previously unseen Ambion validation screen siRNAs prior to the validation experiment, and seven kinome-wide data sets. Using gespeR, we first estimated gene-specific phenotypes for all pathogens from the joint set of 90,264 Qiagen siRNAs, denoted GSPQ, and 18,041 Dharmacon siRNA pools, denoted GSPD. GSPQs and GSPDs were then independently used to compute the expected phenotypes of the unseen screens (Additional file 3). In this analysis, we compared the predictive per-formance of gespeR only with ISP of RSPs and haystack, because RSA cannot predict RSPs (see “Limited applic-ability of RSA and haystack”section in Additional file 4). Haystack operates on seed-averaged phenotypes and not on full siRNA phenotypes. Therefore, as an approxima-tion to the predicapproxima-tion of the RSP for a specific siRNA using the haystack model, we predicted matching seed-phenotypes based on haystack’s phenotype estimates from the same Qiagen data set. Performance was evalu-ated by measuring concordance of predicted against measured RSPs. For the prediction of the new, unseen siRNA phenotypes, gespeR showed higher concordance than predictions from both haystack and ISP as evalu-ated by correlation between phenotypes and rank-biased overlap of ranked gene lists across all pathogens (Fig. 2a). The predictive performance was stronger for GSPQs for
Table 1siRNA libraries for pathogen infection screens
Vendor Product Type Scope siRNAs/gene
Ambion Silencer® Select Single Kinome 3
Silencer® Select Single Validation (1,837) 6
Dharmacon Human ON-TARGETplus Single Kinome 4
Human ON-TARGETplus Pooled Genome 4
Qiagen Human Druggable Genome siRNA V3 Single Genome 4
Human Refseq Xm siRNA V1 Single Predicted mRNA 4
Human Predicted Genome V1 Single Predicted mRNA 4
all pathogens, except for S. typhimurium, where GSPDs performed slightly better, likely due to strain-specific effects from the Qiagen genome-wide screen for S. typhimurium.
gespeR also showed significantly better predictive performance than haystack and ISP on kinome-wide phenotypic readout available for seven independent siRNA knockdowns (3× Dharmcon single-siRNA and 4× Dharmacon pooled). We selected from the seven read-outs all combinations of two disjoint sets, each of size three. Each time, we held out one set as a test set and used the remaining set for predictions. Using gespeR, combinatorial RSPs were predicted based on GSPQ esti-mated from Qiagen siRNAs not contained in either of the two sets. For haystack, parameters learned from the same Qiagen data set were used for predictions. ISP pre-dictions were obtained by averaging over all phenotypes from reagents targeting the same gene. Predictions were compared with the mean phenotype of the test set and
performance was evaluated using the measures of con-cordance described above (Fig. 2b).
gespeR GSPs are highly concordant between distinct libraries
[image:4.595.57.541.89.429.2]exhibit low correlation (medianρ= 0.14) and rank-biased overlap (median rbo↓= 0.16, rbo↑= 0.18), confirming that
even sets of strongly negative or positive observed pheno-types do not agree between different siRNAs targeting the same gene. Experimental noise alone cannot account for this poor reproducibility, as correlation between technical replicates (repeated knockdowns using the same siRNA) was much higher (0.8 on average) [20]. Mutual concord-ance between estimated GSPs obtained from gespeR were close to the level of concordance between technical repli-cates and, compared with RSPs, up to five times higher with respect to correlation and rbo for both the top and bottom of ranked gene lists. Corresponding pairwise dis-tributions of GSPs and RSPs are provided in Additional files 5 and 6. Haystack estimates showed strikingly high correlation between sets of selected genes, although at the cost of extremely small sets of mutually selected genes
between different sub-libraries (median J = 0.25). The me-dian number of mutually selected genes for haystack was m = 13 genes, while we could not evaluate concordance for B. henselae due to a median overlap of m = 2. In contrast, the overall relative overlap between sets of genes selected by gespeR is significantly higher (J = 0.44, m = 1093.5 genes), indicating a more stable and com-prehensive gene selection procedure. Moreover, gespeR showed significantly higher rbo than haystack, for both the top and the bottom of ranked gene lists. gespeR also outperforms RSA across all measures of concordance. RSA did not show significant improvement over RSPs, which may be due to the fact that RSA strongly depends on the number of reagents per gene.
[image:5.595.60.540.87.457.2]vendors (Qiagen versus Dharmacon) compared with RSPs (Fig. 3b). Performance was worse for S. typhimur-ium, likely due to the use of different HeLa cell lines and slightly different pathogen strains in the Qiagen and Dharmacon screens (Table 1). We omitted comparisons to haystack and RSA, as both methods are not applicable to the pooled siRNA library (see“Limited applicability of RSA and haystack”section in Additional file 4). In order to rule out model biases as the underlying source of re-producibility, we showed that gespeR GSPs estimated from randomized RSPs and from randomized siRNA-to-gene target relations did not show concordance (see “Application of gespeR to randomized data” section in Additional file 4 and Figure S6a in Additional file 7). We also confirmed that GSPs estimated by gespeR are not biased towards specific transcript features such as GC content or the number of nucleotides (Figure S6b in Additional file 7).
Single-siRNA libraries yield better model fits
Model fits for Qiagen sub-libraries, and the pooled Dharmacon library were appreciable for B. abortus and S. typhimurium, with a coefficient of determination (R2) of over 0.5 for the Qiagen libraries and over 0.35 for the Dharmacon library. The fits for B. henselae showed slightly lower R2 values of around 0.25 for both library types (Additional file 8). This indicates that, given the same number of siRNAs, gespeR yields higher perform-ance on phenotypic data stemming from single-siRNA libraries than pooled libraries.
Inter-pathogen comparison of GSPs results in the biologically expected pattern
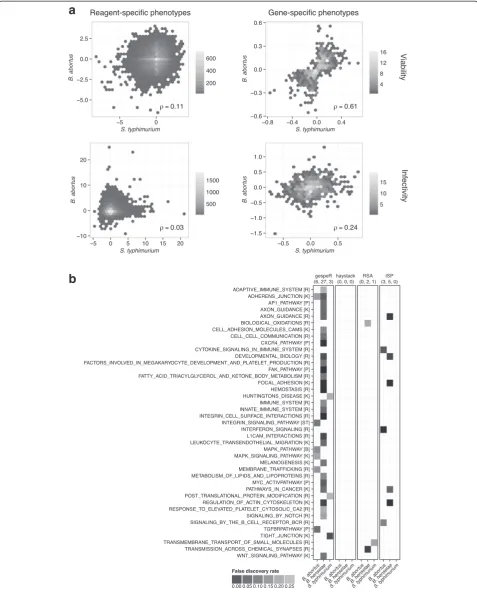
In order to assess inter-pathogen concordance between GSPs estimated by gespeR, we compared GSPQ esti-mates for B. abortus and S. typhimurium for Infectivity and the auxiliary phenotype of Viability, defined as the normalized cell count after infection, between two dis-tinct genome-wide Qiagen sub-libraries (Fig. 4a). Unlike RSPs, GSPs showed strong correlation for Viabilityand weak correlation for Infectivity. This phenomenon is biologically expected, because gene knockdowns with a strong effect on the growth rate of cells (Viability) are largely pathogen-independent. Infectivity, in contrast, is pathogen dependent and subtle correlation may be ex-plained by a few shared components between different pathogen entry mechanisms.
GSEA reveals biologically relevant pathways for pathogen entry
GSEA was performed in order to test for enrichment of known biological pathways based on ranked gene lists from gespeR, haystack, RSA, and ISP [21]. We deployed the GSEAPreranked module from the Broad Institute
GSEA suite [22] and used (estimated) phenotypes as the ranking statistic with default parameters and 1000 per-mutations. Enrichment was tested against the Canonical Pathway database (c2.cp.v4.0.entrez.gmt) downloaded from MSigDB [21]. GSEA results are visualized using a heat map representation of significantly enriched path-ways (Y-axis) for each pathogen (X-axis) grouped in panels for each method (Fig. 4b). All pathways enriched for at least one method-pathogen combination with a false discovery rate smaller than 0.25 are shown. We fo-cused on decreased Infectivity phenotypes, the pheno-type of primary interest for follow-up studies indicating a repressive role in pathogen infection. gespeR identified 37 significantly enriched pathways in total for all studied pathogens, including a number of pathways exclusively enriched for GSPs, which were previously reported to play a role in infection [23, 24], such as focal adhesion, integrin-signaling, and TGF-βsignaling. Five out of eight (62.5 %) pathways enriched for ISPs are also enriched for gespeR GSPs. For RSA, three pathways are enriched, not overlapping with any other method, while for haystack, the threshold of a default minimum overlap of n = 15 genes was not met for any tested gene set, resulting in no significant enrichment.
Top-ranked GSPs are enriched for canonical hits for pathogen entry
Investigation of the top 50 hit genes ranked according to the absolute gene-specific phenotype provides additional evidence for the biological relevance of GSPs estimated by gespeR for the three investigated pathogens (Tables S1–S3 in Additional file 4). The hit lists contain several genes of previously reported pathways, for instance, genes related to actin dynamics and the COPI complex for B. abortus (CDC42, ARF1), integrin signaling and invasome formation for B. henselae (ITGA5, ITGB1), as well as components related to theS. typhimurium entry mechanism (MYH9, IQGAP1). The distribution of B. henselae GSPs exhibits lower variation compared with GSP estimates for both other pathogens. This obser-vation can be attributed to the fact that RSP input to our model for B. henselae also showed lower variation (Additional file 9).
gespeR identifies hits for TGF-βsignaling in independent RNAi data set
well as their respective roles as positive and negative regulators among the top ten genes (Table S4 in Additional file 4). While the two upstream modulators were successfully identified in the original study,SMURF1 as a negative regulator was not. When tested against the KEGG (Kyoto Encyclopedia of Genes and Genomes) path-way for TGF-βsignaling (hsa04350), gespeR yielded larger overlap with its top-100 predicted hits (eight genes) than both haystack (one gene) and RSA (four genes). In addition to TGF-βsignaling, GSEA revealed that gespeR’s ranked GSP estimates are significantly enriched for four further pathways, while no enrichment was found for haystack, RSA, or ISP (Additional file 10).
Conclusions
Despite substantial evidence of sequence-dependent, miRNA-like off-target silencing in RNAi screens [14], the problem has been widely ignored in the field of func-tional genomics for a long time. This shortfall has re-sulted in high numbers of reported false positive hits and virtually no overlap between similar siRNA-based intervention studies [25]. Recently, a shift in the field led to the development of off-target-aware computational methods to analyze RNAi screens [16, 26, 27]. With gespeR, we provide a statistical framework to correct for confounding off-target effects and to infer deconvoluted, GSPs. We have shown on different RNAi data sets from image-based pathogen infection screens and a reporter protein-based TGF-β-signaling screen that inferred GSPs are, unlike observable RSPs, highly reproducible between different siRNA libraries. In order to test for the reprodu-cibility between ranked lists of phenotypes, we compiled a set of measures that capture different aspects of concord-ance between ranked lists of genes. gespeR was bench-marked against three established methods commonly used for the analysis of RNAi phenotypes (RSA, haystack, and ISP) and shown to yield superior performance.
In a typical siRNA screening study, a major challenge is the evaluation of biological relevance for prioritized genes, because off-target effects again confound valid-ation experiments that use additional siRNAs. We have avoided this pitfall and were able to predict the out-comes of new phenotypes from validation experiments
before they were performed. In general, we (1) show that gespeR successfully predicts combinatorial RSPs based on previously estimated GSPs and target relations for novel siRNAs and (2) provide evidence that prioritized genes are biologically meaningful when performing inter-pathogen comparisons, enrichment analyses, and manual literature validation for top ranked genes. In the future, CRISPR/Cas9 nuclease-based genome edit-ing [28] may become a suitable tool to experimentally validate inferred GSPs but, to date, the technology is not established as a high-throughput technique.
Our study demonstrates that gespeR is a useful tool for the analysis of RNAi data sets. While in the present study we have focused on analyzing data harboring uni-variate phenotypes, the statistical model and imple-mented inference algorithm can also be applied to higher-dimensional phenotypes, e.g., those derived from high-content image-based screens. Allowing for un-biased gene-level interpretation of RNAi screens, gespeR significantly improves the selection and prioritization of genes for follow-up analyses and advanced downstream models, e.g., for perturbation-based network reconstruc-tion [29, 30].
Materials and methods
Reagent-to-gene target relationsxij
Several current miRNA target prediction tools [31–33] can be employed to predict miRNA-like sequence-dependent off-targets for siRNAs. In this study, we used TargetScan [31] version 6.2 to predict siRNA-to-gene target relations. TargetScan is a linear regression model on gene expression fold change from miRNA sequence features. Its so-called context + scoring [34] considers seed-pairing stability and high target site abundance, which allows for quantitative prediction of gene tran-script suppression due to siRNA off-targeting with ap-preciable performance (see supplementary material of [34]). For our application, we removed the TargetScan feature of using conservation between miRNAs, because it is not applicable to exogenous RNAi reagents. We predicted induced fold changes of expression based on 3’UTR sequences obtained from the HeLa genome [35]. Let fijbe the predicted log2 fold-change of gene jupon
(See figure on previous page.)
transfection with siRNAi. Then we define the strength of knockdown by siRNAiof genejasXij ¼12fij with 0≤Xij≤1. In this way, large Xij values correspond to
strong inhibition of target j by siRNA i. On average, TargetScan predicts around 2000 off-targets per siRNA, including many off-target relations that result only in minor changes of transcript abundance (Additional file 1).
Full 19-nucleotide complementarity matches of an siRNA to a transcript were identified using BLAST and were set to Xij= 0.75, following a manufacturer’s
state-ment of at least 75 % reduction of expression of intended on-targets [36]. The exact choice of this value did not affect model performance appreciably (Additional file 11), most likely because of dominating off-target effects (Additional file 12) [6, 37].
Transcript level scores predicted by TargetScan were aggregated to gene level by the arithmetic mean over all scores from transcripts corresponding to the same gene. For pooled libraries, we predicted off-target relations for each individual siRNA in the pool and computed the joint off-target relations of the pool as the maximum of all individual siRNAs in the pool. Using the maximum effect of all individual siRNAs in the pool, rather than the arithmetic mean of effects, led to an overall increase in concordance (Additional file 13).
We showed that our method is stable with respect to numerous alterations of the siRNA-to-gene target rela-tion matrix, which disturb the original TargetScan pre-dictions. For instance, we evaluated the performance of our model after adding increasing amounts of noise, or false positive and false negative target relations to the matrix, binarizing the matrix, changing the strength of the on-target effect, or keeping only strong off-target predictions above a certain threshold (see “gespeR’s performance under alterations to the siRNA-to-gene target relation”section in Additional file 4 and Additional file 11).
Model inference
The linear regression model is fit using elastic net regularization [17] with a group-lasso penalty [38], such that:
^
β¼argmin
β∈ℝpk
1 2n
Xn
i¼1
yi−β T
xi
2
Fþλ ð1−αÞk kβ
2
F=2þαX p
j¼1
βj
2
" #
whereyiis thei-th row of then×kresponse matrix and
βj is the j-th row of the p×k coefficient matrix β.
We place a group-lasso penalty on each coefficient
k-vector βj for a single predictor xj. For k> 1 the
group-lasso penalty enforces all coefficients for a predictor to be zero or nonzero together, whereas fork= 1 (univariate response), the penalty degenerates to
the normal lasso. The parameterλdetermines the amount
of regularization and αis the mixing parameter between
the ridge and lasso penalty with 0≤α≤1. The elastic net penalty selects variables (genes) like the lasso, and shrinks together the coefficients of correlated predictors like ridge. This allows for a sparse solution of GSPs, while retaining simultaneous selection of genes with similar RNAi reagent
binding patterns in their respective 3’ UTRs. In addition
to this biological motivation for using elastic net regularization, small-scale screens, with only a few hun-dred RSPs for thousands of genes, lead to underdeter-mined systems, unidentifiable without regularization. We performed tenfold cross-validation to estimate the
param-eter λ using the mean-squared error (MSE) as loss
function and fixedαat 0.5.
Necessary conditions for model validity
Concordance between estimated phenotypes for the same gene and the ability of the model to predict unseen phenotypes are necessary conditions for not rejecting the model prior to any follow-up analysis. Indeed, first, if phenotypes estimated from two independent sets of RNAi reagents targeting the same gene are not concord-ant, it is impossible to unambiguously identify the im-pact of the respective gene on the phenotype. Hence, only concordant phenotypes can yield reliable results that are interpretable on the single-gene level. Second, the fact that a model fails to predict unseen data indi-cates that it was misspecified or poorly fitted to the training dataset, and that it does not accurately capture the structure inherent to the modeled system.
Comparison of the gespeR and haystack models
Image-based pathogen infection screens
High-content, image-based pathogen infection screens were performed in the following steps: (1) siRNA reverse transfection, (2) pathogen-specific infection, (3) cell fixation and staining, and (4) microscopic imaging and feature extraction, as described in [20]. For each patho-gen, the data are composed of knockdown phenotypes from a genome-wide pooled library from Dharmacon, its kinome-wide single-siRNA counterpart (each with four siRNAs per gene), a genome-wide single-siRNA library from Qiagen (four siRNAs per gene), and 1871 add-itional single-siRNA validation screen siRNAs from Ambion (Table 1). All screens were performed in HeLa ATCC CCL-2 cells, except for the genome-wide Qiagen screens forS. typhimurium(HeLa cell clone Kyoto cells). In this study, we focus on the infectivity phenotype, i.e., the fraction of infected cells per well. This pheno-type is constructed from image features, described in detail in [20].
gespeR Bioconductor package
The gespeR model, including functionality for efficient, parallelized fitting of large data sets, phenotype concord-ance evaluation, stability selection, and visualization, is available from Bioconductor as the package gespeR[39]. The package is released under the GNU General Public License (GPL) version 3 and contains a vignette with an exemplary data analysis workflow, as well as a simulated example data set.
Availability of supporting data and software
siRNAs and phenotypic readout from the pathogen
infection screens are available through PubChem
[PubChem:1117357]. Pre-computed siRNA-to-gene tar-get relation matrices for Ambion, Dharmacon, and Qiagen libraries used in this study (Table 1) and for the library from Schultz and co-workers [6] are available online at [40]. In addition, scripts facilitating the automation of TargetScan predictions for the generation of siRNA-to-gene target relations for large collections of siRNAs, in-cluding step-by-step instructions, are available from the same website.
Additional files
Additional file 1: Figure S1.Distribution of the number of off-targets per siRNA for different strength cutoffs on theXijreagent-to-target values. Data are shown for the joint set of all four Qiagen unpooled sub-libraries. On average, each siRNA is predicted to bind around 2000
sequence-dependent off-targets. (PDF 7 kb)
Additional file 2: Figure S2.Removal of row and column effects using B score normalization [18] illustrated for a 384-well plate from theB. abortus
screen. Columns 1, 2, 23, and 24 contain controls and were removed. B score normalized plates (bottom) do not exhibit strong column and row effects, as seen in the observed data (top), e.g., in row P or column 15. (PDF 207 kb)
Additional file 3: Figure S3.Prediction of RSPs using the gespeR model. Reagent-specific phenotypes Y(p)
i are predicted by matrix multiplication of
GSP estimatesβ(m)
j from one data set (top) with reagent-specific target
relations X(p)
ij for another data set (bottom). (PDF 298 kb)
Additional file 4:Supplementary material [15, 16, 31, 34, 41, 42]. Table S1Top 50 hits forBrucella abortusranked by absolute value of
InfectivityGSPs. PubMed PMIDs are provided for previously reported components.Table S2Top 50 hits forBartonella henselaeranked by absolute value ofInfectivityGSPs. PubMed PMIDs are provided for previously reported components.Table S3Top 50 hits forSalmonella typhimuriumranked by absolute value ofInfectivityGSPs. PubMed PMIDs are provided for previously reported components.Table S4Top 50 hits for regulators of TGF-βsignaling ranked by absolute value of GSPs. PubMed PMIDs are provided for previously reported components. gespeR identifies known components of the TGF-βpathway not identified in the original study due to confounding off-target effects. (DOCX 49 kb)
Additional file 5: Figure S4.Pairwise GSP comparisons reveal high concordance between four Qiagen sub-libraries. Lighter color indicates higher number of points per hexagon. (PDF 429 kb)
Additional file 6: Figure S5.Pairwise RSP comparisons reveal low concordance between four Qiagen sub-libraries. Lighter color indicates higher number of points per hexagon. (PDF 474 kb)
Additional file 7: Figure S6.gespeR GSPs are not concordant for randomized data and do not correlate with GC content or length of 3’UTR transcripts. a Concordance between gene-specific phenotypes estimated from randomized siRNA-to-gene target relation matrices (covariate matrices;
left), and from observed siRNA-specific phenotypes (response vectors;right). Correlation and rank-biased overlap were throughout close to zero, indicating that no spurious concordance is introduced when gespeR is fit. Results shown are from theB. abortusQiagen screen, but were similar for other pathogens and libraries. b Correlation between estimated gene-specific phenotypes (GSPs) and GC content (left) and length of transcript 3' UTRs (right). Across libraries, estimated pheno-type correlation was close to zero, indicating that GC content and the length of 3' UTRs do not confound the estimation of GSPs. (PDF 145 kb)
Additional file 8: Figure S7.Coefficients of determination (R2) for
gespeR GSP estimates from data from Qiagen unpooled libraries and the Dharmacon pooled library indicate respectable model fits. (PDF 5 kb)
Additional file 9: Figure S8.Distributions for both GSPs and RSPs exhibit smaller variation forB. henselaecompared withB. abortusandS. typhimurium. (PDF 251 kb)
Additional file 10: Figure S9.Gene set enrichment analysis of GSP estimates for regulators of TGF-βsignaling reveals five significantly enriched pathways with a false discovery rate (FDR) smaller than 0.25. Canonical pathway databases:RReactome,KKEGG. GSPs estimated by gespeR are enriched for five pathways, including, as expected, TGF-β signaling. (PDF 127 kb)
Additional file 11: Figure S10.Various alterations to gespeR’s reagent-to-target relation matrix reveal stability with respect to concordance between GSP estimates from different libraries. The tested variants of the reagent-to-target relation matrix, all of which disturb the original TargetScan predictions, include:QU_SEEDMATCH, binary seed-to-3’UTR match indicator matrix which contains a 1 if the seed of an siRNA matches a 3’UTR and 0 otherwise;QU_BINARY, binarized baseline Qiagen matrices;QU_TH0x, thresholded matrices, with only off-targets stronger than 0.x included;QU_D0, on-target component removed;QU_D1, on-target component set to 100 % knockdown efficacy;QU_D3o4, randomly kept three or four out of four on-target components at 75 % and set the remaining ones to 0;QU_Drnorm, sampled on-target components from N(0.75, 0.1);QU_FPFN0x, swapped 10× percentage of predicted targets with predicted non-targets;
QU_N0x005, added N(0.x, 0.05) Gaussian noise added to all predicted targets. (PDF 65 kb)
Additional file 12: Figure S11.Off-targeted genes dominate observed reagent-specific phenotypes. The gespeR model was fit to theB. abortus
*βfor the on-targeted gene j and coff,i= Yi–con,i–εi. The distribution of
coff,i–con,iexhibits a strong positive tail, indicating that, in general, the
combined contribution to the RSP from all off-targeted genes exceeds the contribution from the on-targeted gene. (PDF 98 kb)
Additional file 13: Figure S12.Maximum aggregation of joint off-target effects for siRNA pools leads to increased concordance compared with arithmetic mean aggregation. (PDF 146 kb)
Abbreviations
gespeR:gene-specific phenotype estimator; GSEA: gene set enrichment analysis; GSP: gene-specific phenotype; ISP: in silico pooling; KEGG: Kyoto Encyclopedia of Genes and Genomes; miRNA: microRNA; ORF: open reading frame; rbo: rank-biased overlap; RNAi: RNA interference; RSA: redundant siRNA analysis; RSP: reagent-specific phenotype; shRNA: small hairpin RNA; siRNA: small interfering RNA; TGF: transforming growth factor;
UTR: untranslated region.
Competing interests
The authors declare that they have no competing interests.
Authors’contributions
FS and ES developed computational methods and analyzed data; FS, ES, and NB wrote the paper; CvM and NB conceived the study; SK, SD, DA, AC, SHL, SE, SM, ME, PR, RCA, WDH, and CD designed and performed experiments. All authors read and approved the final manuscript.
Acknowledgements
This work has been funded by SystemsX.ch, the Swiss Initiative in Systems Biology, under IPhD grant 2009/025 and RTD grants 51RT-0_126008 (InfectX) and 51RTP0_151029 (TargetInfectX), evaluated by the Swiss National Science Foundation. E.S. was supported by the ETH Zurich Postdoctoral Fellowship Program and the Marie Curie Actions for People COFUND program (grant FEL-13 12–1). We are grateful to Mihaela Zavolan for insightful discussions.
Author details 1
Department of Biosystems Science and Engineering, ETH, Zurich, Switzerland.2SIB Swiss Institute of Bioinformatics, Lausanne, Switzerland. 3
Department of Biology, ETH, Zurich, Switzerland.4Biozentrum, University of Basel, Basel, Switzerland.5Institute for Tropical Health and Departamento de Microbiología y Parasitología, Universidad de Navarra, Pamplona, Spain. 6Institute of Molecular Life Sciences, University of Zurich, Zurich, Switzerland.
Received: 23 July 2015 Accepted: 16 September 2015
References
1. Jackson AL, Bartz SR, Schelter J, Kobayashi SV, Burchard J, Mao M, et al. Expression profiling reveals off-target gene regulation by RNAi. Nat Biotechnol. 2003;21:635–7.
2. Birmingham A, Anderson EM, Reynolds A, Ilsley-Tyree D, Leake D, Fedorov Y, et al. 3′UTR seed matches, but not overall identity, are associated with RNAi off-targets. Nat Methods. 2006;3:199–204.
3. Bushman FD, Malani N, Fernandes J, D'Orso I, Cagney G, Diamond TL, et al. Host cell factors in HIV replication: meta-analysis of genome-wide studies. PLoS Pathog. 2009;5:e1000437.
4. Jackson AL, Burchard J, Schelter J, Chau BN, Cleary M, Lim L, et al. Widespread siRNA“off-target”transcript silencing mediated by seed region sequence complementarity. RNA. 2006;12:1179–87.
5. Sigoillot FD, King RW. Vigilance and validation: Keys to success in RNAi screening. ACS Chem Biol. 2011;6:47–60.
6. Schultz N, Marenstein DR, De Angelis DA, Wang W-Q, Nelander S, Jacobsen A, et al. Off-target effects dominate a large-scale RNAi screen for modulators of the TGF-βpathway and reveal microRNA regulation of TGFBR2. Silence. 2011;2:3.
7. Lin X, Morgan-Lappe S, Huang X, Li L, Zakula DM, Vernetti LA, et al.“Seed” analysis of off-target siRNAs reveals an essential role of Mcl-1 in resistance to the small-molecule Bcl-2/Bcl-XL inhibitor ABT-737. Oncogene. 2007;26:3972–9.
8. Anderson EM, Birmingham A, Baskerville S, Reynolds A, Maksimova E, Leake D, et al. Experimental validation of the importance of seed complement frequency to siRNA specificity. RNA. 2008;14:853–61.
9. Sioud M. Promises and challenges in developing RNAi as a research tool and therapy. Methods Mol Biol. 2011;703:173–87.
10. Behlke MA. Chemical modification of siRNAs for in vivo use. Oligonucleotides. 2008;18:305–19.
11. Echeverri CJ, Beachy PA, Baum B, Boutros M, Buchholz F, Chanda SK, et al. Minimizing the risk of reporting false positives in large-scale RNAi screens. Nat Methods. 2006;3:777–9.
12. Collinet C, Stöter M, Bradshaw CR, Samusik N, Rink JC, Kenski D, et al. Systems survey of endocytosis by multiparametric image analysis. Nature. 2010;464:243–9.
13. Siebourg J, Merdes G, Misselwitz B, Hardt WD, Beerenwinkel N. Stability of gene rankings from RNAi screens. Bioinformatics. 2012;28:1612–8. 14. Jackson AL, Linsley PS. Recognizing and avoiding siRNA off-target effects for
target identification and therapeutic application. Nat Rev Drug Discov. 2010;9:57–67.
15. Koenig R, Chiang C-Y, Tu BP, Yan SF, DeJesus PD, Romero A, et al. A probability-based approach for the analysis of large-scale RNAi screens. Nat Methods. 2007;4:847–9.
16. Buehler E, Khan AA, Marine S, Rajaram M, Bahl A, Burchard J, et al. siRNA off-target effects in genome-wide screens identify signaling pathway members. Sci Rep. 2012;2:428.
17. Zou H, Hastie T. Regularization and variable selection via the elastic net. J R Stat Soc B Stat Methodol. 2005;67:301–20.
18. Brideau C, Gunter B, Pikounis B, Liaw A. Improved statistical methods for hit selection in high-throughput screening. J Biomol Screen. 2003;8:634–47. 19. Webber W, Moffat A, Zobel J. A similarity measure for indefinite rankings.
Acm Trans Inf Systems. 2010;28.
20. Rämö P, Drewek A, Arrieumerlou C, Beerenwinkel N, Ben-Tekaya H, Cardel B, et al. Simultaneous analysis of large-scale RNAi screens for pathogen entry. BMC Genomics. 2014;15:1162.
21. Subramanian A, Tamayo P, Mootha VK, Mukherjee S, Ebert BL, Gillette MA, et al. Gene set enrichment analysis: A knowledge-based approach for interpreting genome-wide expression profiles. Proc Natl Acad Sci U S A. 2005;102:15545–50. 22. GSEA Suite. http://www.broadinstitute.org/gsea/.
23. Hardt WD, Chen LM, Schuebel KE, Bustelo XR, Galán JE. S. typhimurium encodes an activator of Rho GTPases that induces membrane ruffling and nuclear responses in host cells. Cell. 1998;93:815–26.
24. Guzmán-Verri C, Chaves-Olarte E, von Eichel-Streiber C, López-Goñi I, Thelestam M, Arvidson S, et al. GTPases of the Rho subfamily are required for Brucella abortus internalization in nonprofessional phagocytes: direct activation of Cdc42. J Biol Chem. 2001;276:44435–43.
25. Zhou H, Xu M, Huang Q, Gates AT, Zhang XD, Castle JC, et al. Genome-scale RNAi screen for host factors required for HIV replication. Cell Host Microbe. 2008;4:495–504.
26. Sigoillot FD, Lyman S, Huckins JF, Adamson B, Chung E, Quattrochi B, et al. A bioinformatics method identifies prominent off-targeted transcripts in RNAi screens. Nat Methods. 2012;9:363–6.
27. Diaz AA, Qin H, Ramalho-Santos M, Song JS. HiTSelect: a comprehensive tool for high-complexity-pooled screen analysis. Nucleic Acids Res. 2015;43:e16.
28. Sakuma T, Woltjen K. Nuclease-mediated genome editing: At the front-line of functional genomics technology. Dev Growth Differ. 2014;56:2–13. 29. Markowetz F. How to understand the cell by breaking it: network analysis of
gene perturbation screens. PLoS Comput Biol. 2010;6:e1000655. 30. Siebourg-Polster J, Mudrak D, Emmenlauer M, Rämö P, Dehio C, Greber U,
et al. NEMix: Single-cell nested effects models for probabilistic pathway stimulation. PLoS Comput Biol. 2015;11:e1004078.
31. Lewis BP, Burge CB, Bartel DP. Conserved seed pairing, often flanked by adenosines, indicates that thousands of human genes are microRNA targets. Cell. 2005;120:15–20.
32. Krek A, Grün D, Poy MN, Wolf R, Rosenberg L, Epstein EJ, et al. Combinatorial microRNA target predictions. Nat Genet. 2005;37:495–500. 33. Khorshid M, Hausser J, Zavolan M, van Nimwegen E. A biophysical
miRNA-mRNA interaction model infers canonical and noncanonical targets. Nat Methods. 2013;10:253–5.
35. Landry JJM, Pyl PT, Rausch T, Zichner T, Tekkedil MM, Stütz AM, et al. The genomic and transcriptomic landscape of a HeLa cell line. G3 (Bethesda). 2013;3:1213–24.
36. ON-TARGETplus siRNA Library. http://dharmacon.gelifesciences.com/rnai-and-custom-rna-synthesis/sirna/on-targetplus-sirna/search-gene/#formats. 37. Franceschini A, Meier R, Casanova A, Kreibich S, Daga N, Andritschke D,
et al. Specific inhibition of diverse pathogens in human cells by synthetic microRNA-like oligonucleotides inferred from RNAi screens. Proc Natl Acad Sci U S A. 2014;111:4548–53.
38. Yuan M, Lin Y. Model selection and estimation in regression with grouped variables. J R Stat Soc B Stat Methodol. 2006;68:49–67.
39. The gespeR Package. http://bioconductor.org/packages/release/bioc/html/ gespeR.html.
40. gespeR Project Website. http://github.com/cbg-ethz/gespeR. 41. Haystack Analysis Web Server. http://rnai.nih.gov/haystack/.
42. RSA Supplementary Material Website. http://carrier.gnf.org/publications/RSA/.
Submit your next manuscript to BioMed Central and take full advantage of:
• Convenient online submission
• Thorough peer review
• No space constraints or color figure charges
• Immediate publication on acceptance
• Inclusion in PubMed, CAS, Scopus and Google Scholar
• Research which is freely available for redistribution